by
submitted to
Japan Advanced Institute of Science and Technology in partial fulfillment of the requirements
for the degree of Doctor of Philosophy
School of Information Science
Japan Advanced Institute of Science and Technology
Chun-Fang Huang
A Study on a Three-Layer Model for the Perception of Expressive Speech
Supervisor: Professor Masato Akagi
Dec. 2008
Abstract
The goal of this research work is to find the answer to the question about what role non-linguistic information plays in the perception of expressive speech categories, and specifically, in the case with people who are from different culture/native-language backgrounds. A multi-layered model is proposed, which is based on the fact that there is a vagueness nature in human cognition. To achieve the research goal, this model will be built by perceptual experiments, verified by rule-based speech morphing, and applied to the analysis of non-linguistic verbal information.
The resulting model by the building process suggests that before listeners decide to which expressive speech category a speech sound belongs, they qualify a voice according to different descriptors, where each descriptor is an adjective for voice description. Different combinations of such descriptors by which a listener qualifies a voice can lead to the decision about to which different expressive speech categories that voice belongs.
To verify the resulting model, a rule-based speech morphing approach is adopted.
The built model is transformed to rules, which are used to create morphed utterances that are perceived as different semantic primitives and expressive speech categories with different intensity levels. The verification process goes a step further to show the validity of the finding in the building process.
Finally, the same model is applied with the same stimuli but different listeners with different culture/native-language background to show that the role non-linguistic information plays in perception of expressive speech categories is common to people who are from different culture/native-language background.
Acknowledgements
It is not possible to complete this research work without numerous supports from many people. I cannot hope to be exhaustive in my thanks to all the people who contributed in some way to my research work, but there are certain individuals whom I wish to single out for recognition.
First of all, I would like to express my deepest gratitude and appreciation to my supervision Professor Masato Akagi for supervising my research with great care and advices. I am very lucky to have him to be the supervisor of my master and PhD study.
His constant encouragement and many perceptive comments do not only help me to clarify my thinking when I was in a mess but also inspire me to find my own direction of research. He teaches me how to do a research meanwhile provides all supports I need, as well as demonstrate how to be a good researcher. I wish I could be a good researcher like him some day. My research work would never be successful without him.
My sincere appreciation goes to Professor Donna Erickson (from Faculty of Music, Showa University of Music). As my advisor of sub-theme, she does not only provide invaluable suggestions on my research, but also grateful encouragement and mental support. I am most grateful for the effort she devoted to reading my many drafts and making constructive suggestions. She is a great supervisor and a very good friend.
I would like also to express my sincere thanks to all member of the jury, Professor Donna Erickson (from Faculty of Music, Showa University of Music), Professor Jianwu Dang, Associate Professor Isao Tokuda and Associate Professor Masashi Unoki of the School of Information Science of JAIST. It is my honor and I would like to thank you all for serving on my thesis committee. I appreciate their efforts and the time they have spent examining this thesis.
I am very grateful to my principal advisor Professor Jianwu Dang for invaluable comments and encouragement during my work.
I wish also to extend my great thanks to Associate Professor Masashi Unoki for not only his great help on my research work but also for his scrupulosity in many business trips and my life in JAIST.
I would like also to thank Associate Professor Isao Tokuda for his kind
I wish to express my gratitude to Fujitsu Lab for the permission to use the emotional speech database.
My special thanks go to Dr. Kazuhito Ito for helping me to organize an experiment at start and provided many valuable discussions.
I would like to thank Dr. Yuichi Ishimoto, Dr. Hironori Nishimoto, Dr. Takeshi Saitou, Mr. Atsushi Haniu and all other member of the acoustic information science Lab.
in JAIST. They have been very friendly and given me a helping hand which made my study life in JAIST been easier and more joyful.
I am deeply indebted to the COE offered by JAIST, for three years financial support in research and business trips.
I am forever grateful and in depth to my mother, in memory of my father and my family for their endless loving support throughout my life.
Finally, this dissertation is dedicated to my husband Brian, my sons Wei-Wei and Wei-Chi. They are the most important to me. My life is nothing without them.
Contents
Abstract ... i
Acknowledgements ... i
Contents ... iii
List of Figures ... vii
List of Tables ... xi
Chapter 1. Introduction ... 13
1.1 Research background ... 15
1.1.1 Data collection ... 17
1.1.2 Acoustic cues measurements ... 18
1.1.3 Mathematical tool ... 21
1.1.4 Voice descriptors for music perception ... 23
1.2 Research approach ... 24
1.3 Dissertation organization ... 26
Chapter 2. Overview of the Model ... 28
2.1 Conceptual diagram of the model ... 28
2.2 Construction process ... 29
Chapter 3. The Building of the Three Layered Model ... 34
3.1 Three experiments for semantic-primitive selection ... 36
3.1.1 Experiment 1: Examination of Listeners’ Perception of Expressive Speech Utterances ... 37
3.1.2 Experiment 2: Construction of a Psychological Distance Modal ... 43
3.1.3 Experiment 3: Semantic Primitives Selection ... 45
3.2.1 Why apply fuzzy logic? ... 53
3.2.2 Experiment 4: Data collection for FIS building ... 53
3.2.3 Construction of FIS ... 54
3.2.4 Evaluation ... 55
3.2.5 Converge of FIS ... 56
3.2.6 Results and discussion ... 68
3.3 Analysis of a large number of acoustic features ... 69
3.3.1 Acoustic cues related to expressive speech ... 69
3.3.2 Acoustic feature analysis ... 73
3.3.3 Correlation analysis of acoustic measurements with semantic primitives .... 77
3.4 Results and discussion ... 78
3.5 Summary ... 94
Chapter 4. The Verification of the Three Layered Model ... 96
4.1 Morphing rule development ... 97
4.1.1 Concept of rule development ... 97
4.1.2 Principles of rule development ... 98
4.1.3 Rule development ... 99
4.2 Rule implementation ... 104
4.2.1 F0 contour modification ... 106
4.2.2 Spectrum modification ... 107
4.2.3 Duration modification ... 109
4.2.4 Power envelop modification ... 111
4.3 Perceptual experiments ... 112
4.3.1 Experiment for evaluating SR-base rule efficiency ... 112
4.3.2 Experiment for evaluating SR-intensity rule efficiency ... 114
4.3.3 Experiment for evaluating ER-base rule efficiency ... 118
4.3.4 Experiment for evaluating ER-intensity rule efficiency ... 119
4.4 General discussion ... 122
4.5 Summary ... 122
Chapter 5. Application of the Three-Layer Model ... 124
5.1 Introduction of model application ... 125
5.1.1 Related work ... 125
5.1.2 Motivation ... 126
5.2 Three experiments ... 126
5.2.1 Experiment 5 ... 127
5.2.2 Experiment 6 ... 130
5.2.3 Experiment 7 ... 133
5.3 Fuzzy inference system ... 135
5.4 Analysis of a large number of acoustic features ... 138
5.4.1 Correlation analysis of acoustic measurements with semantic primitives .. 138
5.5 General Discussion ... 142
5.6 Summary ... 142
Chapter 6. Summary and Future Work ... 144
6.1 Contributions ... 144
6.2 The building of the model ... 145
6.3 The evaluation of the model ... 147
6.4 The application of the model ... 148
6.5 Future work ... 149
6.6 Conclusion ... 150 References ... 151 Publication List ... 160
List of Figures
Figure 2-1. Conceptual diagram of the perceptual model. ... 29 Figure 2-2. Overall process of model building, evaluation, and application... 30 Figure 2-3. Building process, and the corresponding sections in the dissertation and in the model. ... 31 Figure 2-4. Evaluation process and the corresponding sections in the dissertation
and in the model. ... 32 Figure 2-5. Application process and the corresponding sections in the dissertation
and in the model. ... 33 Figure 3-1. Configuration of the Equipment Used in All Experiments of this
Research Work ... 41 Figure 3-2. The resulting perceptual space of utterances in different categories of
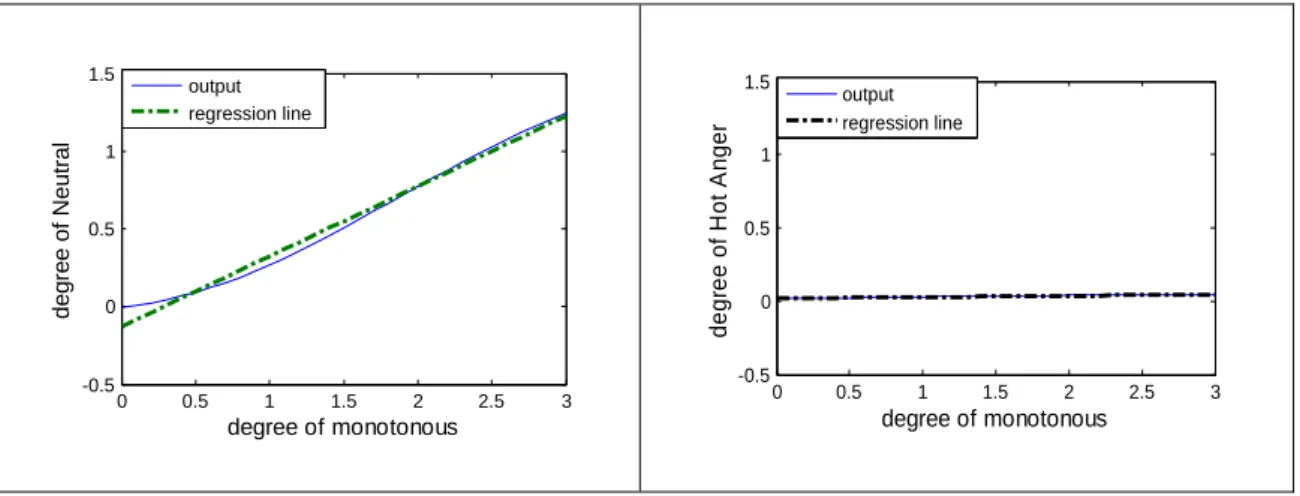
expressive speech. One circle represents one utterance. The number after each symbol represents the selected utterances. ... 45 Figure 3-3. Direction of adjectives in perceptual space. The figure was plotted with arrow-headed lines in (a) dimension-1 against dimension-2, (b) dimension-1 against dimension-3, and (c) dimension-2 against dimension-3 of the perceptual space in Figure 3-2. ... 52 Figure 3-4. Slope of regression line. Left graph describes the relationship between monotonous and Neutral, right graph describes the relationship between monotonous and Hot Anger. ... 56 Figure 3-5. Root mean squared error (RMSE) of the training data set of Neutral . 58 Figure 3-6. Root mean squared error (RMSE) of the checking data set of Neutral 58 Figure 3-7. Root mean squared error (RMSE) of the training data set of Joy... 59 Figure 3-8. Root mean squared error (RMSE) of the checking data set of Joy... 59 Figure 3-9. Root mean squared error (RMSE) of the training data set of Cold Anger
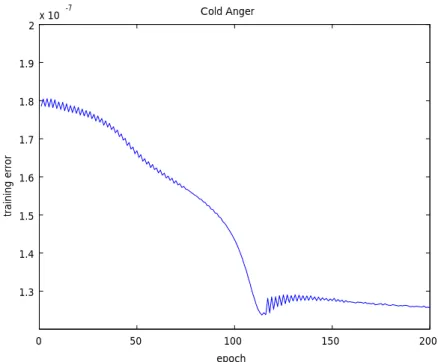
... 60
Figure 3-10. Root mean squared error (RMSE) of the checking data set of Cold
Anger ... 60
Figure 3-11. Root mean squared error (RMSE) of the training data set of Sadness ... 61
Figure 3-12. Root mean squared error (RMSE) of the checking data set of Sadness ... 61
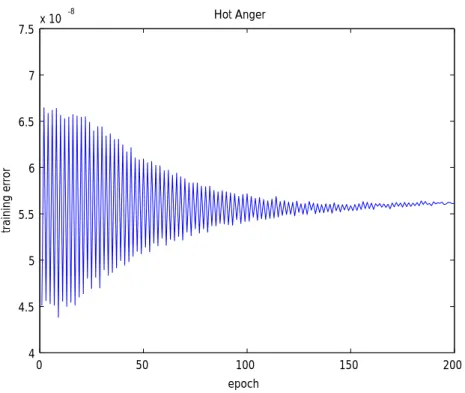
Figure 3-13. Root mean squared error (RMSE) of the training data set of Hot Anger ... 62
Figure 3-14. Root mean squared error (RMSE) of the checking data set of Hot Anger ... 62
Figure 3-15. Root mean squared error (RMSE) of the 50 sentences of Neutral that used to train and check FIS ... 64
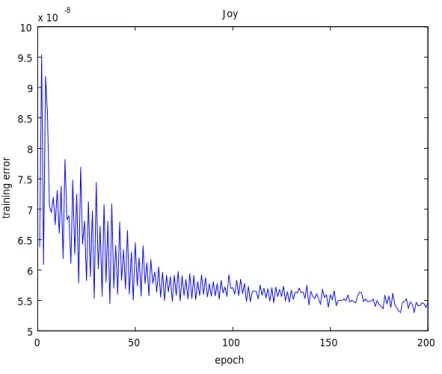
Figure 3-16. Root mean squared error (RMSE) of the 50 sentences of Joy that used to train and check FIS ... 65
Figure 3-17. Root mean squared error (RMSE) of the 50 sentences of Cold Anger that used to train and check FIS ... 66
Figure 3-18. Root mean squared error (RMSE) of the 50 sentences of Sad that used to train and check FIS ... 67
Figure 3-19. Root mean squared error (RMSE) of the 50 sentences of Hot Anger that used to train and check FIS ... 68
Figure 3-20. F0 Contour for accentual phrases and entire utterance of /a ta ra shi i ku ru ma o ka i ma shi da/. ... 75
Figure 3-21. Neutral and its related semantic primitives... 79
Figure 3-22. Joy and its related semantic primitives ... 79
Figure 3-23. Cold Anger and its related semantic primitives ... 80
Figure 3-24. Sadness and its related semantic primitives ... 80
Figure 3-25. Hot Anger and its related semantic primitives ... 81
Figure 3-27. Dark and its related acoustic features ... 82
Figure 3-28. High and its related acoustic features ... 82
Figure 3-29. Low and its related acoustic features ... 83
Figure 3-30. Strong and its related acoustic features ... 83
Figure 3-31. Weak and its related acoustic features ... 84
Figure 3-32. Calm and its related acoustic features... 84
Figure 3-33. Unstable and its related acoustic features ... 85
Figure 3-34. Well-modulated and its related acoustic features ... 85
Figure 3-35. Monotonous and its related acoustic features ... 86
Figure 3-36. Heavy and its related acoustic features ... 86
Figure 3-37. Clear and its related acoustic features... 87
Figure 3-38. Noisy and its related acoustic features ... 87
Figure 3-39. Quiet and its related acoustic feature ... 88
Figure 3-40. Sharp and its related acoustic features ... 88
Figure 3-41. Fast and its related acoustic features ... 89
Figure 3-42. Slow and its related acoustic features ... 89
Figure 3-43. Resultant perceptual model of Neutral. ... 91
Figure 3-44. Resultant perceptual model of Joy. ... 92
Figure 3-45. Resultant perceptual model of Cold Anger. ... 92
Figure 3-46. Resultant perceptual model of Sadness. ... 93
Figure 3-47. Resultant perceptual model of Hot Anger. ... 93
Figure 4-1. Process of morphing voices in STRAIGHT ... 105
Figure 4-2. Process of acoustic features modification. ... 106
Figure 4-3. Demonstration of F0 contour modification. ... 107
Figure 4-4. Demonstration of spectrum modification. ... 108
Figure 4-5. Formant shift and amplitude modify in spectrum modification ... 109
Figure 4-6. Duration modification ... 111
Figure 4-7. Power envelop modification ... 112
Figure 4-8. Template of the questionnaire for assessing intensity of the semantic primitive “bright” ... 116
Figure 4-9. Experimental results of semantic-primitive rule evaluation. The intended intensity levels are N < SU1 < SU2 < SU3. That is, SU3 should have a higher level of intensity perception than SU2 than SU1 than N. N is the neutral utterance, and SUn represent semantic primitive utterances created by the semantic primitive intensity rules. ... 117
Figure 4-10. Experimental result of intensity rule evaluation. The intended intensity levels are N < EU1 < EU2 < EU3. That is, EU3 should have a higher level of intensity perception than EU2 than EU1 than N. N is the neutral utterance, EUn represent expressive speech utterances created by the expressive speech intensity rules. ... 121
Figure 5-1. The resulting perceptual space of utterances in different categories of expressive speech of Experiment 6. Subjects are Taiwaness. ... 132
Figure 5-2. The resulting perceptual space of utterances in different categories of expressive speech of Experiment 2. Subjects are Japanese. ... 133
List of Tables
Table 3-1. Specifications of Vo37ice Data ... 38 Table 3-2. 19 Sentences Used in Experiment 1. This table lists all sentences used in Experiment 1. First column shows the id numbers of the sentences. Second column shows the sentences in Japanese. Id 14 was not in the database. ... 39 Table 3-3. 171 Utterances Used in Experiment 1. First column shows the utterances id numbers. Second column shows the intended emotion category. The UID is composed of a letter and a numerical code. The letter represented what emotion it is (a: Neutral, b, c: Joy, d, e: Cold Anger, f, g: Sadness, h, i: Hot Anger) and the numerical code presented what sentence it was in a014, b014, c014, d014, e014, F014, g014, h014, and i014 were not used. ... 40 Table 3-4. Equipment of Experiment 1 ... 41 Table 3-5. Evaluation form used in Experiment 1. ... 42 Table 3-6. Percentage of ratings of the 5 intended categories. The columns are the intended categories and the rows, the categories rated by subjects. ... 43 Table 3-7. 34 Adjectives Chosen from the Pre-Experiment. Experiment 3 selects
the 17 adjectives with character shading as semantic primitives for the perceptual model. The third column shows the correlation coefficients that are calculated for selecting suitable semantic primitives. ... 47 Table 3-8. 5 Semantic primitives that are most related to each category of
expressive speech. SP column lists the semantic primitives and S column lists the slope of the regression line as described in Figure 3-4. ... 56 Table 3-9. Correlation coefficients between the semantic primitives and the
acoustic features. ... 78 Table 4-1. Example of Rule Parameters for Bright. Values in the cells are the
variation of percentage to the acoustic features of the input neutral utterance.
Unlisted acoustic features in the table are not modified. ... 102 Table 4-2. An example of semantic primitive rule combination. ... 104
Table 4-4. Experiment results of base rule evaluation ... 119 Table 5-1. Percentage of ratings of the 5 intended categories. Subjects were
Taiwanese. ... 129 Table 5-2. Percentage of ratings of the 5 intended categories. Subjects were
Japanese. ... 130 Table 5-3. Semantic primitives selected in Experiment 7 by Taiwanese subjects 135 Table 5-4. Semantic primitives selected in Experiment 3 by Japanese subjects .. 135 Table 5-5. The related semantic primitives of each expressive speech category
selected by Taiwanese S’s ... 137 Table 5-6. The related semantic primitives of each expressive speech category
selected by Japanese S’s. ... 138 Table 5-7. Correlation coefficients between semantic primitives and acoustic
features, Taiwanese S’s. ... 140 Table 5-8. Correlation coefficients between semantic primitives and acoustic
features, Japanese S’s. ... 141
Chapter 1. Introduction
Communication is one of the most important activities of a human being. Humans use different kinds of communication tools, such as gestures, writing, music or speech to interact with each other. The information transferred by different communication tools is encoded through various types of media and recognized by a variety of receptor receivers. For example, music not only gives listeners beautiful sounds with melody to hear, but also communicates the emotion of the composers and performers [80].
Gestures, another example, communicate both information and emotion [40]. In speech communication, it is clearly not only language that is decoded, but also other types of information, such as age, gender, or even emotional categories, such as joy, sadness, anger etc. are decoded [22, 48, 49], and may not necessarily be all that apparent. It is interesting to know the kind of information in speech that can lead to the judgment of emotional categories. This question does not only apply to the situation that a listener is acquainted with the language they heard, but also to those that are not acquainted with that language. Although previous work had shown a statistical relationship between the physical characteristics of voice and the judgment of emotional state, these results are still far from satisfactory. The knowledge of how acoustic characteristics in voice are related to the judgment of expressive speech perception gained from previous work does not provide the necessary information to understand how humans’ interpretation of acoustic characteristics in voice involves the human vagueness nature.
The answer to this question is not apparent but is possible to be approached from different aspects, such as psychology, physiology, or engineering. For the application of expressive speech, such as the automatic emotional category detection or expressive speech synthesis, it is not only necessary to consider this question by understanding how acoustic characteristics of voices affect the judgment of emotional categories, but also by understanding how the vagueness nature of humans affects this judgment. The acquirement of this understanding may the key point to a better application of expressive speech detection and synthesis.
This vagueness nature in the context of expressive speech can be understood better by the following observation. When listening to the voice of a speaker, one hears that a voice “sounds bright and slightly fast”, which in turn one can interpret that “the speaker is happy”. Nevertheless, we do not say, “This voice sounds as if its fundamental
expressing, simply by identifying the absolute pitch of the voice. At the same time, the subtle changes in the descriptors (i.e. adjectives) of the sounds, e.g., “bright-sounding”
or “fast-sounding”, can also lead to different judgments of emotional categories. For example, two voice sounds slightly bright and bright respectively can lead to different judgment of slightly joyful and joyful.
Therefore, to find the answer about what role non-linguistic information plays in perception of expressive speech categories and to apply this finding to the development of expressive speech detection and synthesis, a systematic understanding of the relationship between acoustic characteristics in voice and the vagueness nature of human perception is necessary. Daily observation shows the marvelous ability of humans to decode emotional categories from speech even without the understanding of language; a systematic understanding of this relationship can clarify this “gift” of humans. However, this relationship is not that apparent. There are various types of acoustic characteristics in a voice. On one hand, a subtle change of them can lead to different perceptions of voice description and emotional categories. At the same time, it is also possible that different people may use different descriptors for describing voices.
On the other hand, people from different culture/native-language backgrounds also show a certain degree of similarity in the judgment of expressive speech perception.
Even the type of voice data collection for studying expressive speech may change these results. Besides, the usage of adjectives for voice description that leads to the judgment of emotional categories is fuzzy. All this complexity and the fuzzy relationship suggest the necessity of constructing a model of expressive speech perception for revealing the relations between various types of elements involved in expressive speech perception by a “non-traditional” method for representing the vagueness nature of human perception.
This dissertation introduces the construction and the application of this perceptual model, which exhibits the following three characteristics:
(1) It takes a human’s vagueness nature into consideration
(2) It uses descriptors (i.e. adjectives) of the sounds to represent the vagueness nature of humans. The usage of different descriptors may be the result from the change of acoustic characteristics in the voice.
(3) It considers the judgment of expressive speech categories as resulting from the combination of different voice descriptors.
the question about what role non-linguistic information plays in the perception of expressive speech categories, especially in cases where such information may be common to people from different culture/native-language background.
1.1 Research background
In this research work, the construction of the model for expressive speech perception is based on two assumptions.
The first assumption is deduced from the observation described above, that is, before listeners can decide to which expressive speech category a speech sound belongs, they will qualify a voice according to different descriptors, where each descriptor is an adjective for voice description. Different combinations of such descriptors by which a listener qualifies a voice can lead to the decision about to which different expressive speech categories that voice belongs. Such qualifications and decisions are vague rather than crisp.
The second assumption, which is derived from the first and is also based on daily observation, is that people who are from different cultures/native-language backgrounds have common characteristics for perception of expressive speech categories.
The involvement of adjectives is not new to the study of acoustics. However, previous work usually focused on the selection of adjectives for voice description. Even though they showed that some adjectives are regularly used for voice description, they still failed to provide insight into how this usage is related to the changes of acoustic characteristics and how the usage of adjectives can be employed to understand the perception judgments. In a similar way, although previous work has already confirmed the common characteristics between people with different native-language/cultures background, we still need an understanding of how these common acoustic characteristics are interpreted by the human vagueness nature involvement of adjectives in this study may remedy this problem. All in all, different from previous work, descriptors play the central role to study expressive speech perception.
An important implication of these two assumptions is that there are actually two relationships that should be considered in this research. One is that the judgment of expressive speech categories is based on the descriptors qualified for voices. The other is that acoustic cues affect the choice of voice descriptors.
To find support for the two assumptions, the focal point for achieving the research goal becomes the building of the relationships in the model. Since the work is limited to the context of non-linguistic verbal information [25, 62], the elements about discrete symbolic information that are connected to syntax and phonetic information of one language are excluded from the model. Instead, acoustic cues, e.g., pitch, duration, loudness, etc., voice descriptors, e.g., “bright-sounding” or “fast-sounding”, and emotional categories, e.g., joy, sadness, anger, etc. are included. From the fact that these two assumptions are new to this research topic, it is necessary to carefully consider different factors involved in this research, which include data collection, the types of acoustic cues measured, the mathematical tool used to build the relationships between the involved elements, and the supplementary support of using voice descriptors in studying human perception. The novelty of this model also implies that there will be no literature to evaluate the effectiveness of the constructed model. Therefore an additional evaluation of the model is also necessary.
Data collection is essential because data collected by using different methods may exhibit different characteristics. For research involved with perceptual experiments, the different characteristics exhibited in the collected data essentially have an effect on experimental results. Inappropriate choice of data collection type may result in undesired results. In Section 1.1.1, the types of data collection and the characteristics of them are discussed.
An ideal approach for acoustic cue measurements is to measure as many types as possible in order not to overlook any important hint. However, due to time and resource constraints, a more realistic approach is to only consider those that have shown significance in expressive speech perception. Previous work on this topic provides a good source of evaluation of the different choices. Section 1.1.2 reviews literature for this evaluation.
Mathematic tools directly influence the relationship of the resulting model.
One popular tool is statistics. Statistics provide an in depth understanding about how two elements are related. The basic assumption of this tool is that the characteristics of both elements can be exactly described by number values. However, for the vagueness nature of human perception, we need a different mathematical tool for them. This evaluation is described in Section 1.1.3.
our daily speech communication but also from other communication scenes, such as music. In Section 1.1.4, a review of literature in music provides a supplementary support for applying this idea in this research work.
Since the model is about human perception, it should be evaluated by using a human-oriented approach. An important issue in this process is to find a simple form for representing the relations between elements involved in the model. These include the relations between different types of acoustic characteristics and the choice of voice descriptors for the voice that exhibit these characteristics, or the relations between different types of voice descriptors and judgment that results from a voice with these voice descriptors. To this end, a rule system will be developed, which contains the combination of elements and the quantity of the elements to be used in the evaluation process.
As pointed out by Erickson in [19], the method of data collection adopted should be decided by the goal of the research work. There are two major types of data which are mainly different in the methods used for data collection. One is a spontaneous database, and the other is an actor-portrayed database [16]. Previous work that examines expressive speech from the relationship between acoustic cues and expressive speech categories have shown a general agreement that the most influential factors belong to the prosodic cues, including voice quality cues. To correctly express the relationships between the different types of elements within the proposed model, a mathematical tool should be appropriately chosen. This mathematical tool should satisfy the characteristics of elements that are involved in a relationship.
1.1.1 Data collection
Many researchers [15, 27, 58, 64] have found that who acts the utterances and how the utterances are recorded can affect the results of the study. A spontaneous database records naturally speaking utterances from real-life speech. An actor-portrayed database records utterances produced by professional actors/actresses. Some examples of both types are described in this section. A spontaneous database is ideal for research because it is closer to the nature of emotional speech perception. Conversely, an actor-portrayed database usually results in a rather explicit detection of emotional categories. However, due to the emphasis of the stereotypical performance by the actors/actresses, it may suffer the problem that some subtle factors are hidden [64].
human and automatic dialogue system, Batliner, Fischer, Huber, Spilker, and Nöth [6]
use a Wizard-of-Oz (WOZ) technique to acquire natural responses from human subjects.
This technique hides the fact to subjects that their communication with a computer is actually operated by humans. Therefore, it is expected that natural spontaneous responses from subjects can be obtained, rather their opinions about what single emotional category a speech sound belongs to. Devillers, Vidrascu, and Lamel [15] use two real-life databases from call centers. Their intention is to show that the emotion categories detected in real-life communication are a mixture, rather than a single category. To explore the psychological aspect of automatic emotion detection, Grimm, Kroschel, Mower, and Grimm, Mower, Kroschel, and Narayana [27] use two databases, EMA Corpus and VAM Corpus. EMA Corpus contains acted utterances. On the other hand, VAM contains spontaneous utterances recorded from TV-shows. They used the later in their research and compared the results generated from these two sets of data.
They showed a consistent result between these two types of database when applying their approach for emotional detection.
For the actor-portrayed database example, Williams and Stevens [82] used utterances that imitated the crash of “Hindenburg”. To exclude the problems of data-dependent results, Banse and Scherer [4] used data with 1344 voice samples which portrayed 14 emotion categories. Hashizawa, Takeda, Hamzah, and Ohyama [29] used voices recorded by four professional actors, which included two males and two females, to portray utterances (words) with three types of emotional categories, which consists of four different degrees. They studied the intensity levels of three expressive categories, anger, sadness, and joy. They found the relationship between these categories and F0 and speech rate.
Previous work suggests that each method has its distinct characteristics. There is no perfect choice in this. For our research goal that is about non-linguistic verbal information, it is better to have data that clearly reveal the important acoustic characteristics in the voice
1.1.2 Acoustic cues measurements
The review of literature has shown a general agreement that the most influential factors belong prosody which also includes voice quality. Since a sentence can be uttered with different prosody depending on the emotional states of the speaker, the change of prosody of an utterance greatly influences the perception of expressive speech.
needed to be investigated. Those acoustic cues considered significant for prosody largely are extracted from fundamental frequency, intensity, and duration. In addition, voice quality is another major focus that researchers have paid much attention to. One definition of voice quality (which also can be referred to as “timbre”) is “the quality of a sound by which a listener can tell that two sounds of the same loudness and pitch are dissimilar” (ANSI, 1973. Psychoacoustical terminology. Technical Report, S.3.30, American National Standard Report.) Although there is still a lack of a consistent definition of voice quality, most voice quality measurements are extracted from the acoustic spectrum.
Prosody
Prosody mainly conveys the perception of pitch, loudness, and rate of speaking. The variations of intonation, pause, stress pattern, speed, belong to what we call the prosody of a sentence. Since a sentence can be uttered with different prosodic characteristics depending on the emotional states of speaker, the prosodic change in an utterance greatly influences the perception of expressive speech. Therefore, for studying expressive speech perception, prosody is an important factor needed to be investigated.
Fundamental frequency (F0)
From the aspect of its physical meaning, F0 reflects the pitch that is perceived by a listener. The F0 contour represents the change of F0 in the time domain that provides information about the accent and intonation of a sentence. Since such information deeply affects the perception of expressive speech, F0 is the acoustic cue which has been studied from the earliest time and most frequently in the field of expressive speech perception. In [19], Erickson summarized a list of previous research on the types of acoustic cues that are related to the perception of expressive speech categories. No matter which method is used for data collection (acted speech vs. spontaneous) and languages used, most work has found that F0 is important to the perception of expressive speech categories. It is known that voice pitch is strongly determined by F0 [64]. For instance, Paeschke [58], who measured global F0 trend of over 500 German utterances, found that the final F0 movement is different between boredom, sadness, anxiety, and disgust, but almost meaningless for the emotions of happiness and anger.
Ishii and Campbell [33] have found that in Japanese the phrase final section of duration and F0 are related to phonation types of expressive speech, e.g., modal, creaky, whispery.
From the aspect of its physical meaning, power primarily reflects the loudness that is perceived by a listener. It is primarily determined by the volume of air flow of breath sent out by the lungs. When a speaker is in different emotional states, the variation of power could be very wide. Power has also been reported with regard to its relationship to expressive speech (e.g. [32, 44, 65, and 73]. It is also suggested to be influential on voice quality, as suggest by Ishii and Campbell [34]. In their study, power is measured by RMS.
Duration
From the aspect of its physical meaning, duration primarily reflects how long the listener perceives the sound to be. The same word or same sentence produced with different lengths can be produced differently. Generally, people in a good mood such as happy or cheerful speak faster. In the study of expressive speech perception, for example, [29, 30, 32, 45, 60, 65, 73] have show an effect of duration or speech rates on expressive speech perception in different languages, i.e., German, Japanese, American English, Korean, and Canadian English.
Voice quality
Spectrum
Voice quality is largely extracted from the spectrum. The spectrum is the speech signal represented in the time-frequency domain, resulting from mathematic transforms of the speech signal over a series of time, such as the Fourier transform,. It is a fact that the spectrum conveys meaningful information for speech perception. For example, the first three formants (F1, F2 and F3) predict the perception of the vowel. In addition to these, the high formants in the spectrum are related to the vocal tract length, and acoustic cues extracted from the spectrum are considered an important indication of voice quality [33, 34]. Although the spectrum is a not-as-well investigated feature compared to F0 movement, it has been found to have a relationship with expressive speech perception (e.g. [18, 44, 45, 65]). Scherer, Banse, Wallbott, and Goldbeck [65] measured low-frequency energy (below 635Hz) and spectral slope of spectral energy distribution and found a relationship to Fear, Joy, Sadness, and Anger. Ehrette, Chateau, d’Alessandro, and Maffiolo [18], who used 100 French utterances recorded by 20 professional actresses, found a relationship between 20 perceptual attributes, (adjectives for voice description freely chosen by subjects), and voice quality attributes (spectral centroide). In other languages, such as Japanese, Maekawa [45], measured six types of
and the vowel spectrum.
From the above review, it is clear that fundamental frequency, power, duration, and spectrum are related to expressive speech perception. Although it is not clear how these acoustic cues are related to non-linguistic verbal information, e.g. voice descriptors, they are the candidates for examining for comparison with previous studies.
1.1.3 Mathematical tool
To correctly express the relationships between different types of elements within the proposed model, a mathematical tool should be appropriately chosen because it directly influences the resulting relationship. This mathematical tool should satisfy the characteristics of elements that are involved in the relationship. The characteristics include:
Linearity or nonlinearity of relationship. A linear relationship means that the cause and effect is proportionate. Conversely, a nonlinear relationship means that the cause and effect is disproportionate. The assumption of the role voice descriptors play in expressive speech perception implies that a human’s judgment of expressive speech categories is a quality-issue rather than a quantity-issue.
Therefore, the perceptual relationship between voice descriptors and expressive speech categories is possibly non-linear rather than linear.
Precision and vagueness of relationship. A precise relationship which includes an understanding of the cause and effect and can be modeled by precise number values and expressed by exact equations is necessary. Conversely, a vague relationship is one that the cause and effect can only be understood by imprecise information, and can only be modeled by a rather ambiguous way. A precise relationship can be frequently seen in our natural world; nevertheless, a vagueness relationship is abundant in our human interactions—such as the assumption that we made in this research that voice descriptors are important in human perception.
Therefore, it is necessary to take such vagueness into account when choosing a mathematical tool to deal with human perception.
Black box and white box of relationship [71]. A black-box relationship means that there is no previous knowledge but only measured or observed data are known about the relationship. Conversely, a white-box relationship means that there is
structural knowledge of using voice descriptors in expressive speech perception can be obtained in advance.
For one part of the first assumption made in this research--that the judgment of expressive speech categories is based on voice descriptors--it is necessary to develop a suitable mathematical tool to account for this fuzzy relationship. At the same time, for the other part of this assumption--how acoustic cues affect the choice of voice descriptors—it is necessary to have a mathematical tool that is linear and precise.
The choices of tool we have are statistics, neural network, or fuzzy logic.
Statistics is a general tool for describing the characteristics of a relationship. By statistical methodology, the most significant features can be selected for the classification or identification of emotions (e.g., [5, 9, 42, 52, 53, 65, 66, 67, 74, 79, 81, and 82]). However, statistical methodology mainly manages linear and precise relationships but not fuzzy relationships.
Neural network (NN) can be used to model the relationship between two types of elements, which are regarded as input and output, respectively, where structural knowledge is not known. Recently-emerging in the field of the perception of expressive speech categories is the hybrid Hidden Markov Model – Neural Network (HMM/NN).
This approach overcomes the problem of classical Continuous Density Hidden Markov Models (CDHMM) [13]. For example, Athanaselis, Bakamidis, Dologlou, Cowie, Douglas-Cowie, and Cox [2] use this approach to detect emotion from speech. One unique characteristic of this is that the relationship which maps to expressive speech categories includes both language content and prosodic information. Besides HMM/NN, there are many other types of neural networks. In the context of this research topic, another popular type is Support Vector Machine (SVM) and Neural Network (NN).
They have been used for studying the perception of expressive speech categories in different languages, such as Japanese [56], Swedish [57], Dutch [51], and German [46].
Neural Network can deal with various relationships probably including nonlinear and vague relationships; however, it makes a black box type of relationship since it cannot provide structural knowledge of a relationship.
Fuzzy logic is another emerging tool, which requires known structural knowledge.
For example, Lee and Narayanan [11] built the relationship between vocal cues of input utterances and outputs of emotions described by a set of rules. These rules are used in fuzzy inference systems (FIS) for recognizing two groups of emotion labels, negative
fuzzy inference system for estimating continuous-values of the mapping from emotion primitives of valence, activation, and dominance to emotional categories. The FIS is used as the estimator for emotion detection. In [3], there is an interesting implementation of a robot for emotion detection from the prosody of natural speech by using fuzzy logic. Fuzzy logic provides the capability to deal with the characteristics of nonlinearity, vagueness and white box of a relationship.
From the above review; it is clear that two different methods are necessary for the two different parts of the first assumption. First, the fuzzy relationship between voice descriptors and expressive speech categories requires fuzzy logic because it is non-linear, vague, and white-box. Second, the crisp relationship between voice descriptors and acoustic cues requires statistics because it is linear and precise.
1.1.4 Voice descriptors for music perception
Using qualitative descriptors to describe expressive utterances is also found with other types of communication. In music, the use of adjectives for describing sound has been conducted by many researchers. For example, qualitative descriptions of loud, fast, and staccato music performance give listeners a perception of anger [36]. The perception of these three qualitative descriptions is actually related to the acoustic features of tempo, sound level, and articulation. In music the word “timbre” is also used to describe the difference between two instruments, such as a violin and trumpet, playing the same sound (e.g., having the same F0, loudness and duration). Ueda [77] discussed the possibility of a hierarchical structure of qualitative adjectives for timbre, and suggested that the psychological perception of sound can be characterized by acoustic features.
Ueda and Akagi [78] examined how the perception of sharpness and brightness is affected by amplitude envelope shapes, sound-pressure level, and duration of broadband noise. It is also widely used for music assessment. Darke [14] asked musicians to use 12 verbal adjectives for assessing a number of music sounds, and found there was agreement among the adjectives listeners used to describe their perception of timbre.
Traube, Depalle, and Wanderley [75] studied the relationship between acoustic features, gesture parameters of guitar playing, and adjective descriptions of guitar timbre. They confirmed the relationship between perceived brightness and gesture parameters of playing a guitar. Coincidently, the use of fuzzy logic to build a perception model can also be seen in music. Friberg [23] used fuzzy logic to map measured parameters, such as sound level or tempo, to emotional perception of sound receivers. They also developed a rule system for modeling the music performance [24]. They used the
and complex parameters of rules, they simplified the rules selection by relating rules to semantic descriptions, such as lento, andante, vivace, etc., which are qualitative terms for describing music performance. They applied the rule system to synthesize music for different emotional expressions.
1.2 Research approach
To achieve the research goal, that is using a model for finding the answer to the question about what role non-linguistic information plays in perception of expressive speech categories, where such information is common to people who are from different culture/native-language background, two assumptions were made. Since these two assumptions imply two relationships, the building of these two relationships becomes the focal point in the research work. However, since much previous related work mainly focused on the statistical relationship between expressive speech and acoustic cues, there are no previous studies that are useful for evaluating the resulting relationships that are going to be built. Therefore, another accompanying focal point is to evaluate the relationships that will be built.
To clarify this building and evaluation process, a multi-layered approach is proposed. The two relationships form a three-layered model, which exhibit the three characteristics described in the beginning of this chapter by including “acoustic features”, e.g., pitch, duration, loudness, etc., as “semantic primitives”, e.g. voice descriptors of bright, fast, slow, etc., and “expressive speech categories”, e.g. joy, sadness, anger, etc. The construction of this three-layered model becomes a two-step process.
In the first step, in order to find those descriptors (i.e., adjectives) that can be used to describe the perception of expressive vocalizations, a thorough selection of semantic primitives should be conducted. After the semantic primitives are selected, analysis of a large number of acoustic features will be necessary to support the relationship between semantic primitives and acoustic features. Moreover, in order to understand the fuzzy relationship between the linguistic description of acoustic perception and expressive speech, a fuzzy inference system will be built. After the two relationships are built, the effectiveness of relationships should be evaluated.
In the second step, to verify the effectiveness of relationships built in step 1, we take a more basic, human-oriented approach instead of an engineering application, as in
semantic primitive specifications with corresponding acoustic features of the first step to resynthesiz the expressive speech utterances, and ask human subjects to evaluate the effectiveness of the resynthesized utterances. This approach includes three techniques:
(1) a voice-morphed technique for rule verification, (2) expression of the relationships built by step 1 as rules, and (3) examination of various types of human perception of emotion as well as the intensity of the perceptions.
Voice morphing, which is also referred to as voice transformation and voice conversion, is a technique to modify the identification of a source speaker to a different target speaker [88, 89, 90, 91]. The conversion mapping from source to target is learned and aligned by different methods, such as vector quantized codebooks [92], hidden Markov models (HMM), or Gaussian mixture models (GMM) [93, 94]. However, as indicated by Pfitzinger [95], voice morphing and voice conversion are different. In voice morphing, new voices that are learned from the relationship between source and target voices are interpolated. Conversely, in voice conversion, unseen voices of the source speaker are extrapolated toward the target speaker.
Different from the modification technique described above, in this research work rules are created with parameters that change the acoustic characteristics of a neutral utterance from a specific speaker to those that are perceived as having certain semantic primitives or belonging to certain expressive speech categories. These parameters come from the fuzzy inference system and the correlation of these two relationships.
Changing speech in this way is a technique explicated by Scherer [64], and technically developed by Kawahara et al. [37].
This rule-based approach implements and controls the variations of the perceptual model. It helps to verify the model we build in the first step. It takes a neutral voice as input and generates a different voice as output by systematically manipulating the acoustic features of the input voice. The parameters will then be modified to create variations of the rules that should give different intensity-levels of perception. The verification process is simplified by the combination of this type of speech-morphing and base-rule development. The relationships revealed in the building process then can be verified by changing a neutral utterance to other utterances which result in different types and intensities of perception. This approach is also called copy synthesis, resynthesis or a type of voice-morphing [96, 97, 98].
After the construction of this three-layered model, it will be applied to provide
cultures/native-language background have common characteristics for perception of expressive speech categories.
1.3 Dissertation organization This paper is organized as follows:
In Chapter 1, the orientation of this research topic is clarified. The description in this chapter makes it clear what different factors should be considered before processing the research work. The factors considered here include data collection, acoustic cues measurement, and mathematical tools. Previous work related to each factor is reviewed as well. The information summarized provides a clear outline for the approach.
Moreover, a brief introduction to the proposal of the multi-layer approach for expressive speech perception is described.
In Chapter 2, a more detail explanation about the three-layer model proposed in this research work is given. The hypothesis we attempt to prove is that people perceive expressive speech not directly from a change of acoustic features, but rather from a composite of different types of “smaller” perceptions that are expressed by semantic primitives. A conceptual diagram is used to describe the constituents of the model, which consist of three layers, expressive speech, semantic primitives and acoustic features, and the relationships between the layers.
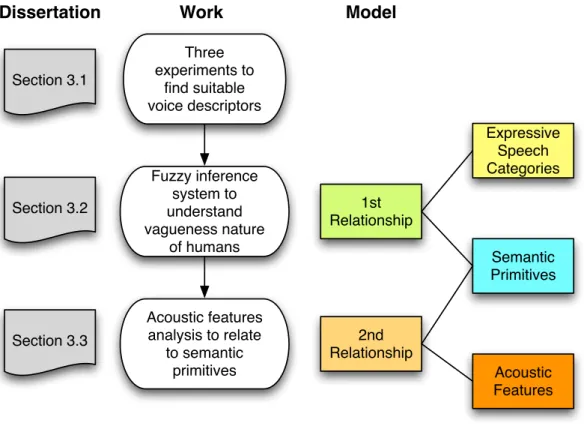
Chapter 3 starts with the detailed description of how the model is built, specifically, the construction of the two types of relationships-- the relationship between expressive speech and semantic primitives and the relationship between semantic primitives and acoustic features. The first relationship, between categories of emotion and semantic primitives, was built by conducting three experiments and applying fuzzy inference systems. The second relationship, between semantic primitives and acoustic features, was built by analyzing acoustic features in speech signals. Finally, the resulting model is presented.
The essence of how to verify the resulting model is explained in Chapter 4t. It is followed by the description of the manner and results of verification for the model. The resulting model was verified by a rule-based speech-morphing approach. The rules are created from the analytic results. These rules are used to morph the acoustic characteristics of a neutral utterance to the perception of certain semantic primitives or expressive speech categories. Different from other research studies, the various types of
resulting models are also verified.
The actual application of the resulting models is reported in Chapter 5. The main objective of the application is to pursue the fundamental nature of the role that non-linguistic information plays in speech communication. That is, do we humans have something in common especially concerning the perception of expressive speech? The manner in which this application works is also discussed. Moreover, one feature of the application which is highlighted is that common perceptual features are linked to semantic features. By comparing the perception model built from Japanese and Taiwanese subjects, we see that certain common as well as different features of expressive speech perception exist among subjects from different linguistic backgrounds.
Chapter 6 provides an overall conclusion of the thesis. It includes a brief summary, as well as a discussion of the possible significance and applications of this research. A number of possible directions extending from this work are pointed out and put forth.
Chapter 2. Overview of the Model
2.1 Conceptual diagram of the model
A diagram shown in Figure 2-1 conceptually illustrates the proposed multi-layered approach of this research work. This diagram visualizes the two assumptions we made in expressive speech perception as a layered-structure model. This model illustrates that people perceive expressive speech categories (i.e. the topmost layer) not directly from a change of acoustic features (i.e. the bottommost layer), but rather from a composite of different types of “smaller” perceptions that are expressed by semantic primitives (i.e.
the middle layer). It also shows that the significance of this research work is that the model approximates a human’s behavior. Humans’ perceptions always have a quality of vagueness; for example, humans use vague linguistic forms which have not precise values, such as “slow” or “slightly slow”. Moreover, this model does not only apply to people who are acquainted with the language of the voice they heard, but also to those who are not acquainted with that language.
A close look at the model shows that it consists of three layers: expressive speech, semantic primitives, and acoustic features. Five categories of expressive speech are studied, Neutral, Joy, Cold Anger, Sadness, and Hot Anger. Anger, sadness, and Joy are the most basic and well-investigated emotional categories. In addition to these three categories of emotion, Neutral and different types of anger, Hot Anger and Cold Anger are investigated in order to provide a comparison. The semantic primitives are considered to be a set of adjectives often used by listeners to describe utterance characteristics, for example, high, low, bright, quiet, etc. The acoustic features are the measurable acoustic characteristics in the speech signal, such as fundamental frequency, power envelope, spectrum, etc.
These three layers form two relationships that help to understand expressive speech perception better. The first relationship is that between semantic primitives and expressive speech categories. From this relationship, one can know how the perception of voice affects the judgment of expressive speech categories. The second relationship is that between acoustic features and semantic primitives. From this relationship, one can know how the acoustic characteristics in voice affect the perception of voice. These two relationships also apply to the communication scene when people are not acquainted with the language of the voice they heard.
Figure 2-1. Conceptual diagram of the perceptual model.
2.2 Construction process
Figure 2-1 not only shows the static structure of expressive speech perception, but also implies the necessary process to construct it. As described in Chapter 1, the focal point of this research work becomes the building of the two relationships shown in Figure 2-1.
Another accompanying focal point is the evaluation of the model. After finishing the building and evaluation of the model, the model is applied to find common features of people who are or are not acquainted with the language of the voice they heard to see if they can still perceive expressive speech. Figure 2-2 illustrates the overall process.
Figures 2-3 to 2-5 illustrate the building, evaluation, and application processes along with the corresponding sections in this dissertation.
The following chapters describe the building of the model by perceptual experiments, the evaluation of the model by speech morphing, and the application of the model to the analysis of non-linguistic verbal information.
Dissertation Work Building model Chapter 3
Evaluating model Chapter 4
Chapter 5 Applying model
Figure 2-2. Overall process of model building, evaluation, and application
Dissertation Work
Three experiments to
find suitable voice descriptors Section 3.1
Model
1st Relationship
Expressive Speech Categories
Semantic Primitives Fuzzy inference
system to understand vagueness nature
of humans Section 3.2
Section 3.3
Acoustic features analysis to relate
to semantic primitives
2nd Relationship
Acoustic Features
Figure 2-3. Building process, and the corresponding sections in the dissertation and in the model.
Dissertation Work
Rule development from the built relationships Section 4.1
Model
Rule implementation
for morphing neutral utterances Section 4.2
Section 4.3
Perceptual experiments evaluate the
model
1st Relationship
Expressive Speech Categories
Semantic Primitives 2nd
Relationship
Acoustic Features
1st Relationship
Expressive Speech Categories
Semantic Primitives 2nd
Relationship
Acoustic Features
Figure 2-4. Evaluation process and the corresponding sections in the dissertation and in the model.
Dissertation Work
Three experiments to
find common voice descriptors Section 5.2
Model
1st Relationship
Expressive Speech Categories
Semantic Primitives Fuzzy inference
system to find commonly vagueness nature
of humans Section 5.3
Section 5.4
Acoustic features analysis to find
commonly relations to voice
descriptors
2nd Relationship
Acoustic Features
Figure 2-5. Application process and the corresponding sections in the dissertation and in the model.
Chapter 3. The Building of the Three Layered Model
This chapter describes the first-step of the model construction. In this step, the suitable semantic primitives for voice description will be chosen. From here, the relationship between semantic primitives and acoustic features, and the relationship between semantic primitives and expressive speech categories will be clarified.
This research firstly uses a top-down method to build the model and then uses a button-up method to verify the model. The process is designed by this way because it is necessary to discovery related adjectives as semantic primitive for the perceptual model.
And, as the definition of semantic primitive in this study, it should be suitable for describing expressive speech that is related to the perception of expressive speech.
Therefore, it is reasonable to investigate the relationship between expressive speech and semantic primitive first and then the relationship between semantic primitive and acoustic features. When verifying the built model, because the method is rule-based speech morphing that controls acoustic features and resynthesized voice, conversely, the relationship between semantic primitive and acoustic features is verified first and then the relationship between expressive speech and semantic primitive.
The work consists of the following three sub tasks.
In order to find those descriptors (e.g., adjectives) that can be used to describe the perception of expressive vocalizations, a thorough selection of semantic primitives will be necessary. Three experiments are carried out in order to determine which adjectives are suitable for describing expressive speech.
To understand the fuzzy relationship between linguistic description of acoustic perception and expressive speech, a fuzzy inference system will be built. In order to build FIS with highly reliable probability, another experiment, Experiment 4, is conducted for collecting more utterances as input data.
In order to support the relationship between semantic primitives and acoustic features, analysis of a large number of acoustic features will be necessary.
This order is important because without the finding of suitable semantic primitives for
to semantic primitives.
However, another possibility is firstly a bottom-up approach to relate every possible semantic primitive to acoustic features, and then the selection of semantic primitives that are suitable for expressive speech categories description. This approach may sound objective at first because we consider every semantic primitive that many be used in voice description. However, some concerns listed below are considered:
1. Top-down approach corresponds to effective humans processing [86]. Our brain tries to process information effectively. Therefore, it is not likely that we humans enumerate different semantic primitives for every occurrence of expressive speech judgment and then select semantic primitives that are suitable for this judgment.
2. Top-down approach corresponds to humans’ behavior. Humans’ brains process information following a certain path [87]. Therefore, we humans use certain types of semantic primitives to describe expressive speech categories.
For the first task, detailed descriptions and discussions of those three experiments conducted for selecting appropriate semantic primitives are provided in Section 3.1.
Those three experiments are (1) examination of listeners’ perception of expressive speech, (2) construction of a psychological distance model, and (3) selection of semantic primitives.
For the second task, Section 3.2 starts with an explanation of the reasons of fuzzy logic application for building the relationship between expressive speech categories and semantic primitives. It is followed by an introduction to an experiment which is conducted to collect more data in order to build the fuzzy inference system. After the explanation of the fuzzy inference system (FIS) construction, those semantic primitives that are most related to the five categories (Neutral, Joy, Cold Anger, Sadness, and Hot Anger) of expressive speech will be clarified.
For the third task, Section 3.3 first provides a discussion with a brief literature review regarding acoustic cues related to expressive speech. The acoustic cues involved with prosody or pitch related parameters are mainly extracted from F0 contour, power envelop and duration. Conversely, voice quality related parameters are mainly extracted from the spectrum. Consequently, acoustic feature analysis done in this study were in terms of F0 contour, power envelop and duration, and spectrum. Detail introduction to
coefficients between semantic primitives and acoustic features were then calculated for depicting the relationship.
After the completion of these three tasks, for each category, the two relationships are combined and are visualized by a layered structure conceptual diagram. From these five diagrams, the non-linguistic verbal information can be characterized by acoustic features of utterances and adjectives of voice description. Finally, the five diagrams are discussed.
3.1 Three experiments for semantic-primitive selection
To find semantic primitives that can be used to describe the perception of expressive vocalizations, three experiments are conducted. The goal of Experiment 1 is to examine subjects’ perception of expressive speech utterances. The goal of Experiment 2 is to show the reliability of the voice database used by the subjects. The results of this experiment should show that subjects can clearly distinguish the expressive speech categories of each utterance they heard. The goal of Experiment 3 is to determine suitable semantic primitives for the perceptual model. To clarify which adjective is more appropriate for describing expressive speech and how each adjective was related to each category of expressive speech, the selected semantic primitives are superimposed into the perceptual space built in Experiment 2 by applying a multiple regression analysis.
To achieve each of these goals, in Experiment 1, subjects are asked to evaluate the perceived categories of utterances in terms of each of the five categories of expressive speech looked at in this study, e.g., Neutral, Joy, Cold Anger, Sadness, and Hot Anger. In Experiment 2, subjects are asked to evaluate utterances selected according to the results of Experiment 1. The results are used to construct a perceptual space of categories of expressive speech by using a multidimensional scaling (MDS) technique. (See also Maekawa and Kitagawa [47] for a similar approach.). Examination of the perceptual space assisted in selecting suitable adjectives as semantic primitives, which were then fine-tuned in Experiment 3 to arrive at a set of semantic primitives used in the model. In Experiment 3, subjects are asked to evaluate utterances by the semantic primitives they perceive. Finally, from the experimental results, fuzzy inference systems are built for representing the relationship between expressive speech and semantic primitives.
3.1.1 Experiment 1: Examination of Listeners’ Perception of Expressive Speech Utterances
To examine subjects’ perception of expressive speech utterances, Experiment 1 was conducted. This experiment looks at how listeners perceive all utterances in the voice corpus in terms of the five categories of expressive speech. According to subjects’
ratings, the results show that most utterances can be easily perceived as belonging to their intended categories. The rating results were utilized in choosing appropriate utterances from a voice corpus concerning expressive speech categories in the subsequent experiments.
Stimuli
The stimuli are Japanese utterances produced by a professional actress. Stimuli were selected from the database produced and recorded by Fujitsu Laboratory. A professional actress was asked to produce utterances using five expressive speech categories, i.e., Neutral, Joy, Cold Anger, Sadness, and Hot Anger. In the database, there are 19 different Japanese sentences. Each sentence has one utterance in Neutral and two utterances in each of the other categories. Thus, for each sentence, there are 9 utterances and for all 19 sentences, there are 171 utterances. The detailed information of the corpus is shown in Table 3-1, Table 3-2, and Table 3-3.