1. Introduction
With the recent development of the utilization of hydrogen as a nextgeneration fuel, hazard evaluation of the explosive gas is an important industrial issue
1). Since detonative explosion especially causes the most severe damages in comparison with other explosion phenomena, the critical conditions for detonation propagation in tubes are the most important concern. The lower detonability limit is usually defined as the critical fuel concentration below which selfsustained detonation wave cannot be established.
There are two ways for determining the detonability limits in tubes. One way is observing the transition from deflagration to detonation. The transition through turbulent flame acceleration is usually enhanced installing obstacles, e.g. coiled wires. The other way is injecting a detonation wave of strong gas mixture in driver section into a test section of weaker gas mixture. In this experimental study, the latter method is used.
In general, when strong driver gas is used, galloping
detonation mode appears near the detonability limit between the stable CJ detonation and the flame propagation. The galloping mode shows an oscillatory behavior of the distance between the lead shock wave and the rear reaction zone. The shock wave and the reaction zone repeat a pair of amplification and decay phases. The status quo of our understanding does not provide an estimate of adequate observation tube length to determine whether the galloping detonation continues in a self
sustained mode or eventually decays. Observation of 2or3 cycles of the galloping oscillations is at least reasonable requirement for determining the detonability limits properly.
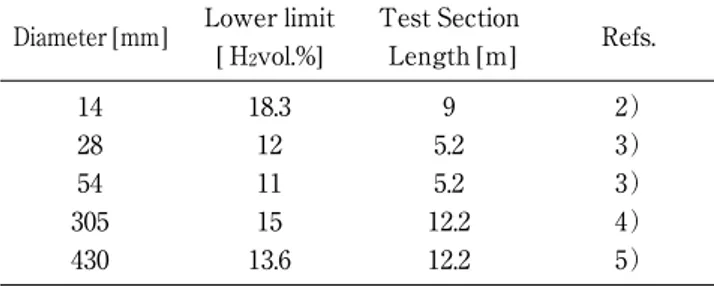
Table 1 shows the lean detonability limits of hydrogen
air mixtures obtained using strong driver gas. These experiments are different in tube diameter, driver gas, and criteria for determining the detonability limit. Besides these differences, the more crucial concern is that the galloping detonation mode is not recognized. This strongly suggests that the tube length is not sufficient in these
Hydrogen-air detonability limits in long tubes obtained using detonative driver gases
Teruhito Otsuka
*†, Satoshi Tsuge
**, and Norihiko Yoshikawa
***
National Institute of Occupational Safety and Health (JNIOSH), 146, Umezono, Kiyoseshi, Tokyo 2040024, JAPAN TEL : +81424914512
†
Corresponding address : ohtsuka@s.jniosh.go.jp
**
Department of Aerospace Engineering, Nagoya University Furocho, Chikusaku, Nagoya 4648601, JAPAN Received : January 8, 2011 Accepted : January 24, 2012
Abstract
The unstable phenomena near the lean detonability limits in atmospheric hydrogenair mixtures are shown using 20
25mlong test sections of 28, 53, and 105 mm innerdiameter gassupply tubes. The driver section of the apparatus is charged with stoichiometric hydrogenoxygen mixture to inject a detonation wave into the test section. Stronger equimolar acetyleneoxygen mixture and weaker 20 vol.% hydrogenair mixture are also used as driver gases. Three propagation modes of deflagration, galloping detonation, and stable detonation are identified in quasi steadystate regimes. The detonability limits are 18 vol.% for the 28 mm ID tube, 15 vol.% for the 53 mm ID tube and 16 vol.% for the 105 mm ID tube. The results show that the pitch length of galloping detonations is about 1015 m. This suggests that a longer test section is required to examine the selfsustainability of galloping detonation.
Keywords : hydrogen, detonability limit, selfsustainability
Research paper
3
8
4
experiments.
More precise recent experiments using long tubes
6),7)have revealed the detailed mechanism of the phenomena near detonability limits and the onset of detonations. The experimental study of lowpressure propaneoxygen stoichiometric mixtures near detonability limits
6)using 24.5mlong test section has shown that the local propagation velocity of galloping detonation varies 0.3―1.4 times of the CJ velocity around the mean value of 0.6 times of the CJ velocity with the pitch length of about 10m.
The aim of the present experimental study is to pursue the nearlimit phenomena of atmospheric hydrogenair mixtures using 20―25m test sections of a few different tube diameters. The test sections were connected to a driver section with a ball valve. The driver gas mainly used was stoichiometric hydrogen―oxygen mixture.
Stoichiometric hydrogen―oxygen detonation transmits a shock wave with a velocity of 1500m s
−1into the test section, which corresponds to the typical hydrogen―air mixture detonation velocity.
2. Experimental Setup
We used an experimental apparatus similar to that used in the experiments by Matsui
3). Figure 1 is a schematic diagram of the present detonation tube.
The effect of tube innerdiameters of 28, 53, and 105 mm on the detonability limit is examined in the test section of 20―25m long, in which selfsustainability of detonations is carefully examined. The test sections consist of several seamless tubes and a 1―2m tube with M18 holes for installing ion probes and pressure transducers. The ratio of the length "to diameter ! , " ! !, ranges from 190 to 850 under different conditions of the experiments. An oscilloscope (Yokogawa DL750) records the outputs of pressure transducers and ion probes. The oscilloscope can simultaneously record 16 analog inputs
and 16 logical inputs. An analog input is digital data with 16 bits for 1 M samples per second or 12 bits for 10M samples per second. For pressure records, analog signals from PCB 113A24 pressure transducers are used. Near the ball valve in the driver section, the pressure signals are recorded to ensure that fully developed CJ detonations are established. The length of the driver section is 1 or 2 m. At the end of the driver sections of 53 and 105 mm diameter tubes, a 28mmdiameter tube is added to easily establish driver detonation wave. Ion probes are charged at 1―3V and each connected to a detection resistance of 100k" . Analog operational amplifiers (TA75358P) amplify the ion probe signals 1000 times, and the amplified signals are stored in logical record. All gas mixtures were prepared at least 6 hours prior to the experimental run in bottles employing the partial pressure method.
The experimental procedure is as follows.
1. Open the ball valve connecting the driver and test sections. Then draw air, residue gases and water vapor until the pressure is attained below 1 kPa in the whole tube.
2. Fill the test gas of the hydrogenair mixture to the whole tube.
3. Close the ball valve and draw the test gas mixture from the driver section again.
4. Charge the stoichiometric hydrogenoxygen mixture to the driver section.
5. Immediately after opening the ball valve, ignite the driver gas mixture with an electric spark from a 5000 pF capacitor charged at8kV.
3. Results and Discussion
Table 2 summarizes the experimental results. Haloua et al.
6)classified propagation behaviors into four categories ; i.e., stable, stuttering (spin), galloping detonations and a fast flame, based on the continuous detailed records of microwave Doppler velocimetry of local wave velocity.
Since stable and stuttering detonation modes have almost CJ velocity on average, they are not distinguishable in this experiment. Certain quantitative criteria are set for classifying the observed phenomena. ʻAttenuateʼ in the table corresponds to the cases in which the shock wave overpressure is less than 1/10 of the CJ overpressure and the average propagation velocity is less than 600m s
−1in the rear 5m length of the test section. This is a failure of detonation initiation and corresponds to fast flame. ʻGallopʼ Table1 Lower detonability limits in the literature.
Diameter [mm] Lower limit [ H
2vol.%]
Test Section
Length [m] Refs.
14 18.3 9 2)
28 12 5.2 3)
54 11 5.2 3)
305 15 12.2 4)
430 13.6 12.2 5)
Figure1 Schematic diagram of the detonation tube.
corresponds to the cases in which transition occurs in the middle part of the test section or a shock wave remarkably detached from the flame. In these cases, the average velocity is less than the CJ velocity by tens of percentage. However, there is an overdriven state at the transition where the propagation velocity exceeds the CJ velocity over a short range. The oscillatory time
behaviors of wave velocity is not obtained in some experimental runs, since the galloping pitch length is larger than 1015m. In the present study, the lower detonability limit is determined as the lowest fuel concentration above which stable detonations appear. We classify the galloping detonation into subcritical initiation phenomena in the present study, since there remains a possibility that the galloping wave decays gradually to deflagration in several oscillatory propagation cycles.
3.1 28 mm tube
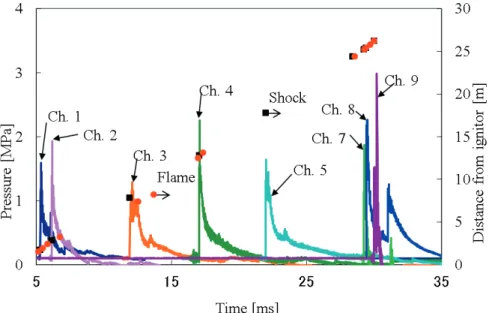
The stable detonation limit was 18 vol.% and the galloping detonation limit was 13 vol.% in the present 28 mm tube experiments. These limits are clearly determined irrespective of the driver gases without any scattering, e.g., mixed go and nogo results at the same fuel concentration. Figure 2 includes the pressure records of 12 vol.% hydrogen―air mixture into which an equimolar acetyleneoxygen detonation is injected and show an overdriven detonation in the early stage. The figure also shows the temporal positions of a flame (reaction front) and an attenuating shock wave.
Channels 2 to 5 are at intervals of 5m in the test section.
The results show typical attenuation, but the propagation velocity exceeds 1000m s
−1in the early stage. Since we used a relatively long tube, we could observe the pressure Table2 Experimental results of detonation initiation by another detonation as a driver.
Each mark shows one experimental result. The stoichiometric mixture of hydrogen and oxygen was used as driver gas except the thick mark with an equimolar mixture of acetyleneoxygen and the thin mark with a 20 vol.%
hydrogen―air mixture.
Figure2 Pressure records and timeposition diagram of the experiment in a 28 mm tube with a 12 vol.% hydrogenair mixture in the test section and an equimolar acetyleneoxygen mixture in the driver section. The ball valve is located between the pressure transducer Ch. 1 and Ch. 2.
3
8
4
decay of the 12 vol.% mixture. This decaying stage is not observed in Matsuiʼs experiments using shorter tubes (see Table 1). The pressure records of channels 3 and 4 show an insufficient catchup of the reaction front (second pressure peak) to the lead shock wave which results in a failure of detonation reinitiation. The average shock velocity between channels 8 and 9 is 383m s
−1. The shock wave and the flame separately propagate at their characteristic velocities to provide a typical deflagration pressure distribution.
Figure 3 shows the records of a typical galloping mode in hydrogen 13vol.% mixture. Around Ch. 3, an insufficient catchup of the reaction front to the shock also can be seen. However, they reunite around Ch. 4. Two cycles of the oscillatory behaviors are observed, and the galloping pitch length is about 1015m.
3.2 53 mm tube
In the 53 mm tube experiments, the results scatter in hydrogen 13vol.% mixture experiments. We could not find the reasons for the sequential change of gallopflame
gallop in 12, 13, and 14 vol.% mixtures. We determine the detonation limit as 15 vol.% and the galloping detonation limit as 12 vol.%. The dependence of the limit on the tube diameter strongly suggests the wall effects. There are two effects of the tube wall. The first is the boundary layer effect, which is suppressive to detonation propagation.
This effect increases for smaller tube diameter. The second is the reflection of transverse waves in the lead shock surface, which strengthens the shock triple points to enhance rapid heat release. This second effect enhances the detonation propagation and increases for smaller tube diameter. These two effects are opposite and compete with each other, and the net of the two effects varies with Figure3 Pressure records and timeposition diagram of the experiment in a 28 mm
tube with a 13 vol.% hydrogenair mixture in the test section and a 20 vol.
% hydrogenair mixture in the driver section. The ball valve positioned between the pressure transducer Ch.1 and Ch.2.
Figure4 # " and # ! diagrams for 17 vol.% hydrogenair mixture in the 105 mm tube. The calculated velocity of CJ detonation with 17 vol.%
hydrogenair mixture is 1594 m/s.
tube diameter. Therefore, the optimal tube diameter exists for providing the lowest fuel concentration of detonability limit. In the present experiments, 53 mm tube provides the lowest limits of both the gallop and stable modes in comparison with the results of 28 mm and 105 mm tube experiments. The detonability limit of 11 vol.%
obtained in Matsuiʼs experiments in Table 1 is close to the galloping limit 12 vol.% in the present experiments.
Together with the results of 28 mm tube experiments, the present experiments conclusively show that short test sections cannot provide the galloping mode.
3.3 105 mm tube
The stable detonation limit is 16 vol.% and the galloping detonation limit is 12 vol.% in the 105 mm tube experiments. The results of 17 vol.% hydrogen mixture in Figure 4 show an exceptional initiation mode in which the lead shock wave and the reaction front closely interact with each other and propagate as a detonation wave. The local velocity of the wave at the location about 67m slows down to 800m s
−1, and the estimated shockflame induction distance is about 15 cm corresponding to the induction time of 0.183 ms at the maximum. The wave accelerates in the distance of 713m of the test section to propagate at CJ velocity in the distance of 1320m.
To see the detail of the phenomena of 16 and 17 vol.%, we calculated transmitted shock wave velocities as shown in Figure 5. The CJ detonation properties can be calculated using CEA code
8). The cell size of the stoichiometric hydrogenoxygen detonation is sufficiently small to consider that the detonation wave is planar in the driver section. Therefore, the shock wave relation can be applied to the contact surface between the driver and test gases. The transmitted shock wave in mixtures with concentrations of 16 vol.% and lower is in an overdriven state relative to the CJ condition. Therefore in 16 vol.%, transition is not necessary. In contrast, in the case of mixtures with concentrations of 17 vol.% and higher, the shock wave is in an underdriven state. The transition
occurred from the underdriven state in 17 vol.%, but it took relatively long distance and time. Then the velocity in the rear 5m length of the test section is almost the same as the CJ velocity of 17 vol.%. The longer test section is necessary to confirm that the another oscillation will appear or not in 17 vol.%.
4. Summary
Through the experiments using long tubes and stoichiometric hydrogenoxygen driver gas, we conclude that the minimum concentrations required for initiating selfsustained detonation waves are 18 vol.% for the 28 mm tube, 15 vol.% for the 53 mm tube and 16 vol.% for the 105 mm tube. To judge the selfsustainability near the limit conditions with 105 mm tube, more experiments with different compositions of the driver gases and longer test sections are necessary.
Acknowledgments
The authors would like to thank Ms. Sae Imai for conducting the experiments of the 28 mm tube and the data analysis.
References
1) H. D. Ng and J. H. S. Lee, “Comments on explosion problems for hydrogen safety”, J. Loss Prev. Process Ind., 21, 136, (2008).
2) R.Wendlant, and Z Physik Chem,110, p.637 (1924).
3) H. Matsui, “On the detonation limits”. SaigainoKenkyu, 12, 183 (1981) (in Japanese).
4) S. M. Kogarko and Y. B. Zeldovich, Doklady Akad Nauk SSSR 1948, 63, p.553 (1948).
5) S. R. Tieszen, M. P. Sherman, W. B. Benedick, R. Knystautas and J. H. Lee, “Detonation cell size measurements in H
2 AirH
2O mixtures”, presented at 10th International Colloquim on Dynamics of Explosions and Reactive Systems (1985).
6) F. Haloua, F. Brouillette, V. Lienhart, and G. Dupre,
“Characteristics of Unstable Detonations Near Extinction Figure5 Velocity of CJ detonation and the transmitted shock wave from
hydrogenoxygen detonation to hydrogenair in SATP at each concentration.
3
8
4
Limits”, Comb. Flame, 122, 422 (2000).
7) J. Chao, T. Otsuka, and J. H. S. Lee, “An experimental investigation of the onset of detonation”, Proc. Comb. Inst., 30th, pp.12691280, (2005).
8) S. Gordon and B. J. McBride, “Computer program for calculation of complex chemical equilibrium compositions and applications”, NASA RP1311 (1996).
爆ごうドライバーガスを用いて得た長い管内の 水素−空気爆ごう限界
大塚輝人*†,柘植 覚**,吉川典彦**
大気圧下での水素−空気混合気の爆ごうの下限界について,直径28,53,105mm,長さ20〜25mのテスト部分を持つ 管における実験を行った.定常爆ごうをテスト部分に送りこむため,ドライバ部分に量論比の水素−酸素混合気を導入 して用いた.また,より強いドライバとして等量のアセチレン−酸素混合気や,より弱いドライバとして20 vol.%の水 素−空気混合気も用いた.爆燃,ギャロッピング爆ごう,定常爆ごうが観測された.爆ごう限界は,28mm管で18vol.%,
53mm管で15vol.%,105mm管で16vol.%である.結果からギャロッピング爆ごうでは10〜15mの間隔で再転移が起こる ため,より長いテスト部分が必要であることがわかった.
*
(独)労働安全衛生総合研究所化学安全研究グループ
〒2040024 東京都清瀬市梅園146 Corresponding address : ohtsuka@s.jniosh.go.jp
**