Appendix I
Participating Laboratories
Table A1. List of participants.
Lab # Name Affiliation Country
1 Nurit Kress National Institute of Oceanography, Israel
Oceanographic and Limnological Research Israel 2 Atsushi
Hirayama Oceanographical Division, Maizuru Marine
Observatory Japan
3 Susan Becker Scripps Institution of Oceanography, University
of California USA
4 Jia-Zhong
Zhang Ocean Chemistry Division, Atlantic Oceanographic and Meteorological Laboratory (AOML), National Oceanic and Atmospheric Administration (NOAA)
USA
5 Minhan Dai State Key Laboratory of Marine Environmental
Science, Xiamen University China
6 David J. Hydes National Oceanography Centre United Kingdom 7 Roger Kerouel Department of DYNECO/Pelagos, Institut
Français de Recherché pour l’Exploitation de la Mer (IFREMER)
France
8
䋭㩷 䋭㩷 䋭㩷
9 Cristopher
Schmidt Geochemical and Environmental Research Group, Texas A&M University USA 10 Hiromi Kasai Hokkaido National Fisheries Research Institute,
Fisheries Research Agency Japan
11 Hiroyuki Inoue Oceanographic Division, Nagasaki Marine
Observatory Japan
12
䋭㩷 䋭㩷 䋭㩷
13 Masamitsu
Kumagai Marine Division, Hakodate Marine Observatory Japan 14 E. Malcolm S.
Woodward Plymouth Marine Laboratory United
Kingdom
15
䋭㩷 䋭㩷 䋭㩷
16
䋭㩷 䋭㩷 䋭㩷
17 Monika Schütt Institute of Biogeochemistry and Marine
Chemistry, University of Hamburg Germany 18 Agnès Youénou Department of Dyneco/Pelagos, Institut
Français de Recherché pour l’Exploitation de la Mer (IFREMER)
France 19 Olivier
Pierre-Duplessix Laboratoire Environnement Ressources de Normandie (LERN), Institut Français de Recherché pour l’Exploitation de la Mer (IFREMER)
France
20 Theresa M.
Shammon Department of Local Government and the Environment, Isle of Man Government Laboratory
British Isles
Table A1. List of participants (continued)
Lab # Name Affiliation Country
21
䋭㩷 䋭㩷 䋭㩷
22
䋭㩷 䋭㩷 䋭㩷
23 Thierry Moutin
Olivier Grosso Laboratoire d’Océanographie Physique et
Biogéochimique France
24 Gwo-Ching
Gong Institute of Marine Environmental Chemistry
and Ecology, National Taiwan Ocean University Taiwan 25 Jan van Ooijen Royal Netherlands Institute for Sea Research
(NIOZ) the
Netherlands 26 Hitoshi Mitsuda Laboratory for Instrumentation and Analysis,
The General Environmental Technos Co., Ltd.
(KANSO TECHNOS)
Japan 27 Paul Worsfold School of Earth, Ocean & Environmental
Sciences, University of Plymouth United Kingdom 28-1 Clemens
Engelke Scottish Environment Protection Agency,
Marine Chemistry United
Kingdom 28-2 Judy Dobson Scottish Environment Protection Agency,
Marine Chemistry United
Kingdom 29 Yuzo Ishida Global Environment and Marine Department,
Japan Meteorological Agency Japan
30
䋭㩷 䋭㩷 䋭㩷
31
䋭㩷 䋭㩷 䋭㩷
32
䋭㩷 䋭㩷 䋭㩷
33 Jeff Anning Department of Fisheries and Oceans, Bedford
Institute of Oceanography Canada
34 Marguerite
Blum Monterey Bay Aquarium Research Institute USA
35
䋭㩷 䋭㩷 䋭㩷
36 Katherine A.
Krogslund School of Oceanography, University of
Washington USA
37 Toste Tanhua Leibniz Institute of Marine Sciences,
IFM-GEOMAR Germany
38 Akihiko Murata Research Institute for Global Change, Japan Agency for Marine-Earth Science and Technology (JAMSTEC)
Japan Kenichiro Sato Marine Works Japan (MWJ) Japan
39
䋭㩷 䋭㩷 䋭㩷
40 Takeshi
Yoshimura Environmental Science Research Laboratory, Central Research Institute of Electric Power Industry
Japan
41
䋭㩷 䋭㩷 䋭㩷
42 Ingela Dahllöf Department of Marine Ecology, National Environmental Research Institute, Aarhus University
Denmark 43 Chris Payne Earth and Ocean Sciences Department,
University of British Columbia Canada
Table A1. List of participants (continued)
Lab # Name Affiliation Country
44
䋭㩷 䋭㩷 䋭㩷
45 Marc Knockaert Department of MARCHEM, Management of Unit of the North Sea Mathematical Models, Royal Belgian Institute of Natural Sciences (MUMM)
Belgium
46 Edward Czobik NSW Department of Environment and Climate
Change, New South Wales Government Australia
47
䋭㩷 䋭㩷 䋭㩷
48 Janet
Barwell-Clarke Department of Fisheries and Oceans Canada,
Institute of Ocean Sciences Canada
49
䋭㩷 䋭㩷 䋭㩷
50 Jun Sun Key Laboratory of Marine Ecology &
Environmental Sciences, Institute of Oceanology, Chinese Academy of Sciences
China 51 Jianming Pan The Second Institute of Oceanography, State
Oceanic Administration China
52 Hiroshi Ogawa Ocean Research Institute, University of Tokyo Japan 53 Günther Nausch Department of Marine Chemistry, Leibniz
Institute for Baltic Sea Research Germany
54
䋭㩷 䋭㩷 䋭㩷
55 Kazuhiro Saito Oceanographical Division, Kobe Marine
Observatory Japan
56 Linda White Ocean Science Division, Institute of Ocean
Sciences Canada
57
䋭㩷 䋭㩷 䋭㩷
58
䋭㩷 䋭㩷 䋭㩷
59
䋭㩷 䋭㩷 䋭㩷
60
䋭㩷 䋭㩷 䋭㩷
61 Solveig
Olafsdottir Marine Research Institute Iceland 62 Malcolm Rose Marine Laboratory, Fisheries Research Services United
Kingdom 63 Georges Paradis Marine Science Institute, University of
California Santa Barbara USA
64 Sophie C.
Leterme School of Biology, Flinders University Australia 65 Hiroaki Saito Biological Oceanography, Tohoku National
Fisheries Research Institute, Fisheries Research Agency
Japan 66 Sieglinde
Weigelt-Krenz BSH Bundesamt für Seeschifffahrt und Hydrographie (Federal Maritime and Hydrographic Agency)
Germany
67-1
䋭㩷 䋭㩷 䋭㩷
67-2
䋭㩷 䋭㩷 䋭㩷
Table A1. List of participants (continued)
Lab # Name Affiliation Country
68 François
Baurand Institut de Recherché pour le Développement,
Campis Ifremer Technopole de Brest-Iroise France 69 Magali Duval Laboratoire Environnement Ressources
d'Aquitaine (LER-AR), Institut Français de Recherché Pour l’Exploitation de la Mer (IFREMER)
France
Florence
d’Amico Station d’Arcachon, Institut Français de Recherché pour l’Exploitation de la Mer (IFREMER)
France
70 Dominique
Munaron Laboratoire Environnement Ressources, Institut Français de Recherché pour l’Exploitation de la Mer (IFREMER)
France 71 Patrick
Raimbault Centre d’Océanologie de Marseille - Service
d’Observation France
72 Gary Prove Environmental Waters Laboratory, Queensland
Health Forensic and Scientific Services Australia 73 Pascal Morin Marine Chemistry Laboratory, French National
Center for Scientific Research (CNRS) and University Pierre et Marie Curie Paris VI and University Bretagne Occidentale
France
74 Stephen C.
Coverly SEAL Analytical GmbH Germany
75 Claire Mahaffey Department of Earth and Ocean Science,
University of Liverpool United
Kingdom
Table A2. Cross reference for Lab numbers in 2008, 2006, and 2003 I/C studies.
Lab # (2008; this study)
2006 RMNS Inter-comparison Study
2003 RMNS Inter-comparison Study
1 1 2
2 2 10
3 3 3
4 4
5 5 1
6 6
7 7 6
9 9
10 10 17
11 11 15
䋭 12
13 13 5
14 14
䋭 15 18
䋭 16
17 17
18 18 11
19 19
20 20
23 23
24 24
25 25
26 26 16
27 27
28-1 28
28-2
29 29 9
䋭 30
䋭 31
Table A2. Cross reference table of lab # between 2008, 2006, and 2003 I/C (continued) .
Lab #
(2008; this study)
2006 RMNS Inter-comparison Study
2003 RMNS Inter-comparison Study
䋭 32
33 33
34 34
䋭 35
36 36
37 37
38 38 13
䋭 39
40 40
42 42
43 43
䋭 44
45 45
46 46
䋭 47
48 48
䋭 49
50 50
51 51
52 52 7
53 53
䋭 54
55 55 14
56 56
57 㩷 㩷
58 㩷 㩷
59 㩷 㩷
60 㩷 㩷
61 㩷 㩷
Table A2. Cross reference table of lab # between 2008, 2006, and 2003 I/C (continued) .
Lab #
(2008; this study)
2006 RMNS Inter-comparison Study
2003 RMNS Inter-comparison Study
62 㩷 㩷
63 㩷 㩷
64 㩷 㩷
65 㩷
866 㩷 㩷
68 㩷 㩷
69 㩷 㩷
70 㩷 㩷
71-1 㩷 㩷
71-2 㩷 㩷
72 㩷 㩷
73 㩷 㩷
74 㩷 㩷
75 㩷 㩷
Table A2. Cross reference table of lab # between 2008, 2006, and 2003 I/C (continued) .
Lab #
(2008; this study)
2006 RMNS Inter-comparison Study
2003 RMNS Inter-comparison Study
䋭 32
33 33
34 34
䋭 35
36 36
37 37
38 38 13
䋭 39
40 40
42 42
43 43
䋭 44
45 45
46 46
䋭 47
48 48
䋭 49
50 50
51 51
52 52 7
53 53
䋭 54
55 55 14
56 56
57 㩷 㩷
58 㩷 㩷
59 㩷 㩷
60 㩷 㩷
61 㩷 㩷
Table A2. Cross reference table of lab # between 2008, 2006, and 2003 I/C (continued) .
Lab #
(2008; this study)
2006 RMNS Inter-comparison Study
2003 RMNS Inter-comparison Study
62 㩷 㩷
63 㩷 㩷
64 㩷 㩷
65 㩷
866 㩷 㩷
68 㩷 㩷
69 㩷 㩷
70 㩷 㩷
71-1 㩷 㩷
71-2 㩷 㩷
72 㩷 㩷
73 㩷 㩷
74 㩷 㩷
75 㩷 㩷
Appendix II
Results reported by participants
Table A3 Nutrient results reported by the participants
Table A4 Ammonia results reported by the participants
Table A5 DOP results reported by the participants
Table A6 DON results reported by the participants
Table A7 DOC results reported by the participants
(Concentrations in Tables A3–A6 are in units of µmol kg
–1)
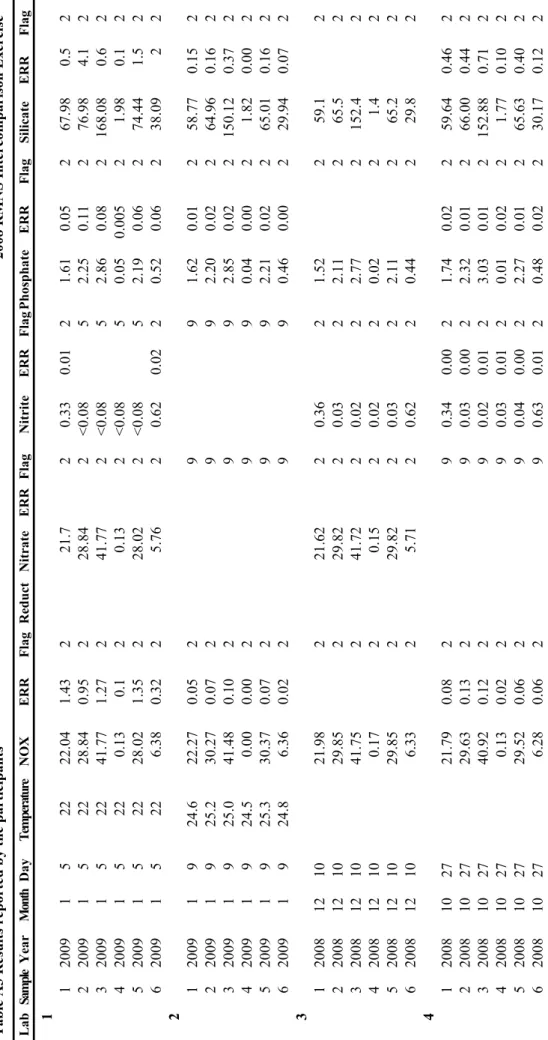
Table A3. Nutrient results reported by the participants.
Table A3 Results reported by the participants 2008 RMNS Intercomparison Exercise 㩷Lab㩷㩷Sample㩷Year㩷Month㩷Day㩷Temperature㩷NOX㩷ERR㩷Flag㩷Reduct㩷Nitrate㩷ERR㩷Flag㩷Nitrite㩷ERR㩷Flag㩷Phosphate㩷ERR㩷Flag㩷Silicate㩷ERR㩷Flag 㩷1 㩷1㩷2009㩷1㩷5㩷22㩷22.04㩷1.43㩷2㩷21.7㩷2㩷0.33㩷0.01㩷2㩷1.61㩷0.05㩷2㩷67.98㩷0.5㩷2 㩷2㩷2009㩷1㩷5㩷22㩷28.84㩷0.95㩷2㩷28.84㩷2㩷<0.08㩷5㩷2.25㩷0.11㩷2㩷76.98㩷4.1㩷2 㩷3㩷2009㩷1㩷5㩷22㩷41.77㩷1.27㩷2㩷41.77㩷2㩷<0.08㩷5㩷2.86㩷0.08㩷2㩷168.08㩷0.6㩷2 㩷4㩷2009㩷1㩷5㩷22㩷0.13㩷0.1㩷2㩷0.13㩷2㩷<0.08㩷5㩷0.05㩷0.005㩷2㩷1.98㩷0.1㩷2 㩷5㩷2009㩷1㩷5㩷22㩷28.02㩷1.35㩷2㩷28.02㩷2㩷<0.08㩷5㩷2.19㩷0.06㩷2㩷74.44㩷1.5㩷2 㩷6㩷2009㩷1㩷5㩷22㩷6.38㩷0.32㩷2㩷5.76㩷2㩷0.62㩷0.02㩷2㩷0.52㩷0.06㩷2㩷38.09㩷2㩷2 㩷2 㩷1㩷2009㩷1㩷9㩷24.6㩷22.27㩷0.05㩷2㩷9㩷9㩷1.62㩷0.01㩷2㩷58.77㩷0.15㩷2 㩷2㩷2009㩷1㩷9㩷25.2㩷30.27㩷0.07㩷2㩷9㩷9㩷2.20㩷0.02㩷2㩷64.96㩷0.16㩷2 㩷3㩷2009㩷1㩷9㩷25.0㩷41.48㩷0.10㩷2㩷9㩷9㩷2.85㩷0.02㩷2㩷150.12㩷0.37㩷2 㩷4㩷2009㩷1㩷9㩷24.5㩷0.00㩷0.00㩷2㩷9㩷9㩷0.04㩷0.00㩷2㩷1.82㩷0.00㩷2 㩷5㩷2009㩷1㩷9㩷25.3㩷30.37㩷0.07㩷2㩷9㩷9㩷2.21㩷0.02㩷2㩷65.01㩷0.16㩷2 㩷6㩷2009㩷1㩷9㩷24.8㩷6.36㩷0.02㩷2㩷9㩷9㩷0.46㩷0.00㩷2㩷29.94㩷0.07㩷2 㩷3 㩷1㩷2008㩷12㩷10㩷21.98㩷2㩷21.62㩷2㩷0.36㩷2㩷1.52㩷2㩷59.1㩷2 㩷2㩷2008㩷12㩷10㩷29.85㩷2㩷29.82㩷2㩷0.03㩷2㩷2.11㩷2㩷65.5㩷2 㩷3㩷2008㩷12㩷10㩷41.75㩷2㩷41.72㩷2㩷0.02㩷2㩷2.77㩷2㩷152.4㩷2 㩷4㩷2008㩷12㩷10㩷0.17㩷2㩷0.15㩷2㩷0.02㩷2㩷0.02㩷2㩷1.4㩷2 㩷5㩷2008㩷12㩷10㩷29.85㩷2㩷29.82㩷2㩷0.03㩷2㩷2.11㩷2㩷65.2㩷2 㩷6㩷2008㩷12㩷10㩷6.33㩷2㩷5.71㩷2㩷0.62㩷2㩷0.44㩷2㩷29.8㩷2 㩷4 㩷1㩷2008㩷10㩷27㩷21.79㩷0.08㩷2㩷9㩷0.34㩷0.00㩷2㩷1.74㩷0.02㩷2㩷59.64㩷0.46㩷2 㩷2㩷2008㩷10㩷27㩷29.63㩷0.13㩷2㩷9㩷0.03㩷0.00㩷2㩷2.32㩷0.01㩷2㩷66.00㩷0.44㩷2 㩷3㩷2008㩷10㩷27㩷40.92㩷0.12㩷2㩷9㩷0.02㩷0.01㩷2㩷3.03㩷0.01㩷2㩷152.88㩷0.71㩷2 㩷4㩷2008㩷10㩷27㩷0.13㩷0.02㩷2㩷9㩷0.03㩷0.01㩷2㩷0.01㩷0.02㩷2㩷1.77㩷0.10㩷2 㩷5㩷2008㩷10㩷27㩷29.52㩷0.06㩷2㩷9㩷0.04㩷0.00㩷2㩷2.27㩷0.01㩷2㩷65.63㩷0.40㩷2 㩷6㩷2008㩷10㩷27㩷6.28㩷0.06㩷2㩷9㩷0.63㩷0.01㩷2㩷0.48㩷0.02㩷2㩷30.17㩷0.12㩷2