A Hearing Impairment Simulation Method Using Audiogram-based Approximation of Auditory Charatecteristics
Nozomi Jinbo, Shinnosuke Takamichi, Tomoki Toda, Graham Neubig, Sakriani Sakti, Satoshi Nakamura
Graduate School of Information Science, Nara Institute of Science and Technology, 8916-5 Takayama-cho, Ikoma, Nara 630-0192, Japan
{shinnosuke-t, tomoki, neubig, ssakti, s-nakamura}@is.naist.jp
Abstract
Hearing impairment simulation is an effective technique to ed- ucate normal-hearing people about auditory perception of the hearing-impaired. Because auditory characteristics of the hear- ing impaired vary greatly from person-to-person, personaliza- tion of the hearing impairment simulation systems is essen- tial to accurately simulate these individual differences. How- ever, measurement of auditory characteristics of individuals is time-consuming work. In this paper, we propose a hearing im- pairment simulation method that is easily applied to individ- ual hearing-impaired persons. Auditory filter characteristics and gain characteristics are estimated from easily measurable audiograms of each individual. We also implement a method for manually adjusting the hearing impairment level to improve accuracy of the proposed hearing impairment simulation. An experimental evaluation is conducted to compare intelligibil- ity between hearing-impaired and normal-hearing persons with the proposed hearing impairment simulation. The experimen- tal results show that the proposed method effectively makes the word correct rate and phoneme confusion tendency of the nor- mal hearing persons similar to those of the hearing impaired persons.
Index Terms: hearing-impairment simulation, personalization, auditory filter characteristics, gain characteristics, audiogram,
1. Introduction
Hearing impairment, one of the most common diseases causing speech communication disorders, is classified into three types:
conductive hearing impairment, sensorineural hearing impair- ment, and mixed conductive-sensorineural hearing impairment.
Conductive hearing impairment is caused by diseases of the ex- ternal or middle ear and usually causes gain reduction. Sen- sorineural hearing impairment is caused by diseases of the in- ner ear. This impairment often causes not only gain reduction but also frequency selectivity reduction. Mixed hearing impair- ment is a symptom of the development of both conductive and sensorineural hearing impairments. It is well known that audi- tory characteristics of the hearing impaired vary greatly from person-to-person even if they suffer from the same type of the hearing impairment.
One of the most popular approaches to assist hearing- impaired people in speech communication is hearing aid sys- tems. The gain reduction is alleviated by using digital signal processing. Because auditory characteristics are highly non- linear to an input sound pressure level, also depending on fre- quency bands, time-varying filtering process is needed accord- ing to the input sound. Moreover, personalization of this pro- cess is essential due to large variations in the auditory char- acteristics among individuals. Although this system is effec-
tive for conductive hearing impairment, it is fundamentally dif- ficult to alleviate the frequency selectivity reduction caused by sensorineural hearing impairment and mixed conductive- sensorineural hearing impairment.
Another approach to assist hearing-impaired people in speech communication is to educate normal-hearing people about auditory perception of the hearing-impaired and way of producing speech easily understand by the hearing-impaired people. Hearing impairment simulation is an effective tech- nique for this purpose [1], making it possible for normal- hearing people to experience the auditory perception of the hearing-impaired. HearLoss1is one of the hearing impairment simulation systems. A time-invariant gain reduction process and a simple smearing process to reduce the frequency se- lectivity are implemented in this system, but the accuracy of hearing-impairment simulation is limited to that achievable by these simple processes. To achieve highly accurate hearing- impairment simulation, more sophisticated methods based on auditory filters have been proposed [2, 3, 4, 5]. In these meth- ods, measurement of individual auditory characteristics is es- sential to develop accurate auditory filters replicating the char- acteristics of each individual. However, this measurement is very time-consuming work [6]. For the educational purpose mentioned above, it is worthwhile to develop a new hearing im- pairment simulation system that can be easily personalized to individuals while preserving acceptable simulation accuracy.
In this paper, we propose a new hearing impairment simula- tion method that is easily personalized to the individual hearing- impaired persons. The proposed method allows normal-hearing people to experience the auditory perception of a target hearing- impaired person under his/her daily conditions in speech com- munication,i.e., if the target usually wears a hearing-aid system, the proposed method simulates auditory perception of the tar- get wearing it. To approximate auditory characteristics of each individual without the time-consuming measurement of audi- tory characteristics, we use only easily measurable audiograms, which represent the individual’s hearing levels at several fre- quencies. The gain characteristics and parameters of the audi- tory filter are roughly predicted from the audiograms. These are used to perform frequency-dependent gain reduction with a time-variant digital filter and smearing based on the auditory filter to simulate frequency selectivity reduction. To improve the simulation accuracy, we further implement manual adjust- ment of the hearing impairment level for the proposed method.
Experimental results show that the proposed method effectively makes the word correct rate and phoneme confusion tendency of normal hearing persons similar to those of the hearing im- paired persons.
1http://www.phon.ucl.ac.uk/resource/hearloss/
INTERSPEECH 2014
2. Basic process of hearing impairment simulation
In this paper, we focus on two basic processes for the hearing impairment simulation: a gain reduction process and a smear- ing process. The gain reduction process reduces power of the input sound waveform, which is regarded as the inverse pro- cess that in a hearing-aid system. It is essential to dynamically control the gain reduction level according to the input sound pressure level due to nonlinearity of the auditory characteris- tics. Moreover, as the gain reduction characteristics vary from frequency-to-frequency, a frequency-dependent reduction pro- cess is necessary. Several gain reduction methods have been proposed based on threshold control of the hearing level [1] and modeling of the nonlinear characteristics using an auditory fil- terbank [5, 7, 8].
The smearing process reduces the frequency selectivity by smoothing spectral components over the frequency axis. One effective smearing method is the use of the auditory filters [9], such as a roex filter [2], to model the auditory characteristics of the hearing-impaired person and those of the normal-hearing person. The roex filter on the power spectral domain is given by Ac(f) =
⎧⎨
⎩
1 +pu,cf−fc fc
exp
−pu,cf−fc fc
f≥fc
1−pl,cf−fc fc
exp pl,cf−fc
fc
f < fc
(1) wheref is a frequency, fc is a center frequency of the roex filter, andpu,candpl,care parameters to determine the band- width in upper and lower frequency sides of the center fre- quencyfc, respectively. The filter coefficient vector of the cen- ter frequencyfcis given byA(fc) = [Ac(1),· · ·, Ac(K)], where K is the number of points over the frequency axis, i.e., K corresponds to the Nyquist frequency. Let X = [X(1),· · ·, X(K)] andAW = [AW(1),· · ·,AW(K)]
be a power spectrum of an input waveform and a matrix con- sisting of the filter coefficient vectors for a hearing-impaired person, respectively. This input waveform is assumed to be perceived as AWX by the hearing-impaired person. In the smearing, the following smeared power spectrum Y = [Y(1),· · ·, Y(K)]is generated:
Y =A−1N AWX (2) whereAN = [AN(1),· · ·,AN(K)]is a matrix consisting of the filter coefficient vectors for a normal-hearing person. A smeared waveform is generated from the smeared power spec- trum and an original phase spectrum that is extracted from the input waveform assuming that it is perceived as ANY (i.e., AWX) by the normal-hearing person.
3. Proposed hearing impairment simulation using approximation with audiograms
Although the use of the auditory filters is effective for simulat- ing auditory perception of the hearing-impaired relatively well, it requires time-consuming measurement of auditory character- istics of each individual to determine filter parameterspu,cand pl,cat each center frequencyfc. To address this issue, we pro- pose a hearing-impairment simulation method using only an au- diogram of each individual to approximately determine these parameters in addition to the gain reduction characteristics.
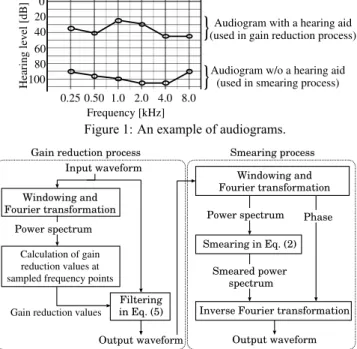
Audiograms show the hearing level of a particular person at several frequencies, e.g., 0.25, 0.5, 1, 2, 4, and 8 kHz, as shown inFigure 1, where the hearing level corresponds to the threshold at which a sound of that frequency is audible com-
0.25 0.50 1.0 2.0 4.0 8.0
0 20 40 60 80 Hearing level [dB]100
Frequency [kHz]
Audiogram with a hearing aid (used in gain reduction process)
Audiogram w/o a hearing aid (used in smearing process)
} }
Figure 1: An example of audiograms.
Windowing and Fourier transformation
Input waveform
Power spectrum Gain reduction process
Filtering in Eq. (5) Output waveform Calculation of gain
reduction values at sampled frequency points
Inverse Fourier transformation Output waveform
Windowing and Fourier transformation Power spectrum
Smeared power spectrum
Smearing process
Smearing in Eq. (2) Phase
Gain reduction values
Figure 2: Proposed hearing impairment simulation process.
pared with 0 dB of the normal-hearing people. Note that if the hearing-impaired person wears a hearing aid, we use two au- diograms: an audiogram measured with a hearing aid is used to determine the gain reduction characteristics and the audiogram measured without a hearing aid is used to determine the audi- tory filter parameters for the smearing process. The proposed hearing impairment simulation process is shown inFigure 2.
3.1. Proposed gain reduction process
LetXkbe the power spectrum at frequencykof an input sig- nal. The gain characteristics of the hearing-impaired person are approximated with a piece-wise linear function given by
Gk(Xk) =
⎧⎪
⎪⎪
⎨
⎪⎪
⎪⎩ Tk
TkXk Xk< Tk 120−Tk
120−Tk
Xk−Tk +Tk Tk Xk<120
120 120Xk
(3)
whereTkis the absolute power value corresponding to the hear- ing level at frequencykof a normal-hearing person andTk is that of the hearing-impaired person whose hearing level at fre- quencykis indicated byok,i.e.,Tk =ok+Tk. The uncom- fortable hearing level is set to 120 dB. The gain reduction value Hkat frequencykis calculated as
Hk=Xk−Gk(Xk). (4) The frequency sampling filter applied to a hearing aid system [10] is employed in the gain reduction process, which is given by
H(z) = 1−rNz−N
N ·
⎡
⎢⎢
⎣
N2−1 k=1
(−1)k|Hk|2 cos πk
N
1−rz−1 1−2rz−1cos
2πk N
+r2z−2
+ H0
1−rz−1
⎤
⎥⎥
⎦(5)
whereHkis a filter parameter showing frequency response at a sampled frequency pointk, which is determined with the gain reduction value. The parameterr is used to make the filter
Frequency [kHz]
Power [dB]
...
120
0 Fourier transformation
Averaged powerXk=0.25
Averaged power
Output power [dB]
Hk
Input power [dB]
...
Xk=0.5
y=Gk (Xk)
k=0.25 [kHz]
Tk+Ok
Xk
Tk
Xk
120
Averaged powerXk=8
Gk (Xk)
y=Xk
k=0.5 [kHz]
k=8 [kHz]
in Eq. (3)
in Eq. (4)
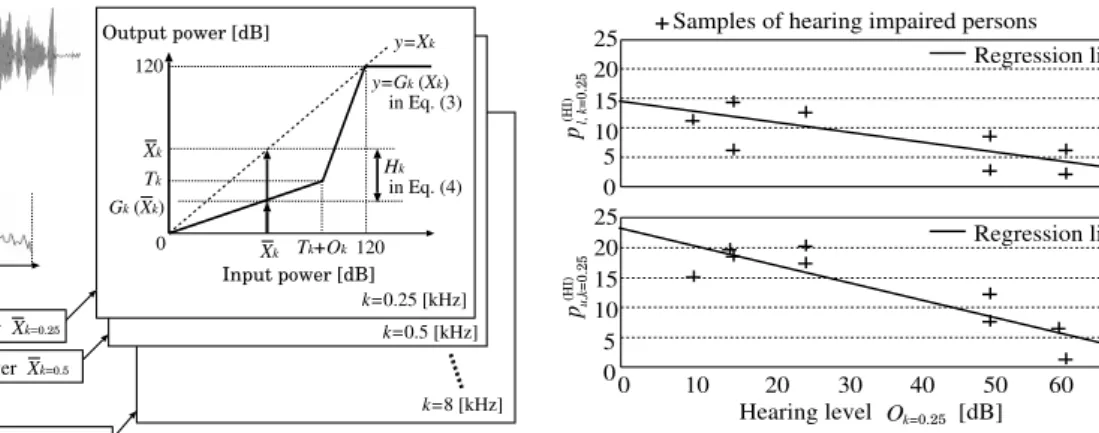
Figure 3: Gain reduction process in the proposed method.
stable, and N is the tap length. This process allows us the frequency-specific gain reduction.
Several processes are implemented to alleviate discontinu- ities caused by rapidly changing the filter parameters. At each analysis frame, the power spectrum averaged in several fre- quency bands is calculated asXk in the gain reduction value estimation as shown inFigure 3, and then spline interpolation is performed to determine the filter parameterHkat each sam- pled frequency point. These parameters are further smoothed between neighboring analysis frames and interpolated sample by sample during filtering.
3.2. Proposed smearing process
It has been reported in [11] that there is a correlation between the hearing level and the roex filter parameters pu,candpl,c. Therefore, we predict these parameters from the hearing level shown in the audiogram. In this paper, linear regression is per- formed to predict them as follows:
p(HI)u,k =au,kok+bu,k, p(HI)l,k =al,kok+bl,k, (6) whereau,k,bu,k,al,k, andbl,k are regression parameters and p(HI)u,k andp(HI)l,k are the roex filter parameters at the center fre- quencykfor a hearing-impaired person whose hearing level at frequencykis shown asok. The regression parameters are es- timated using sample pairs of the hearing level and roex filter parameters among several hearing-impaired persons shown in [12]. Figure 4shows an example of the data samples and the estimated linear regression line. The prediction accuracy with the linear regression is shown inTable 1. The parameters at the other center frequencies are determined with linear interpola- tion between the predicted parameters.
On the other hand, the roex filter parameters for the normal- hearing personp(NH)u,k andp(NH)l,k are relatively stable. Therefore, they are set to constant values so that the filter bandwidth is equal to equivalent rectangular bandwidth (ERB) assuming that p(NH)u,k and p(NH)l,k are equal to each other. In such a case, the following equations hold:
e = 2 fc
p(NH)u,k + 2 fc
p(NH)l,k (7) e = 24.7 (0.00437fc+ 1). (8) 3.3. Manual adjustment of hearing level
The proposed hearing impairment simulation method is easily personalized to individual hearing-impaired persons but simu-
0 5 10 15 20 25
0 10 20 30 40 50 60 70
0 5 10 15 20 25
Hearing level [dB]
Samples of hearing impaired persons
pu,k=0.25(HI)pl, k=0.25(HI)
Ok=0.25
Regression line Regression line
Figure 4: An example of hearing levels and corresponding fil- ter parameters at the center frequencyfc = 0.25kHz among several hearing-impaired persons shown in [12].
lation accuracy tends to be degraded by several approximations particularly for the roex filter parameter prediction. To address this issue, we further propose a manually control method to the hearing level. The roex filter parameters in the smearing process are interpolated between those for the hearing-impaired person and those for the normal-hearing person as follows:
p(HI)u,k = αp(NH)u,k + (1−α)p(HI)u,k (9) p(HI)l,k = αp(NH)l,k + (1−α)p(HI)l,k (10) whereαis an interpolation weight to be controlled manually.
4. Experimental evaluation
4.1. Experimental conditions
We estimated the parameters of the proposed hearing impair- ment system for a severe hearing-impaired (severe HI) person, who is in her twenties, wearing a hearing aid system in a daily life and a moderate hearing-impaired (moderate HI) person, who is in his fifties, not wearing a hearing aid system. Both per- sons suffered from the sensorineural hearing impairment. Their hearing levels were measured at 0.25, 0.5, 1, 2, 4, 8 kHz. Note that the hearing level of the severe HI person was measured with/without the hearing aid system.
In frame analysis, we used a Hanning window was used with length of 8 ms and a frame shift of 4 ms. The FFT size was set to 128 in the gain reduction process and 256 in the smearing process. For the frequency sampling filter in Eq. (5), the tap length was set to 32 and the parameterrwas set to 0.95. The system was developed with C language.
To evaluate the simulation accuracy of the proposed sys- tems, we conducted word intelligibility tests by manual dicta- tion. We used a speech database of familiarity-controlled word- lists FW07 [13] including 1600 Japanese word utterances clas- sified to four categories in terms of word familiarity. Sampling frequency was set to 16 kHz. Using both 20 familiar words from the familiarity 4 category and 20 unfamiliar words from the familiarity 2 category, the following four types of speech samples were evaluated by listeners: normal speech (N), simu- lated speech with gain reduction process (G), simulated speech with smearing process (S), and simulated speech with gain re- duction and smearing processes (GS). The interpolation weight αwas set to 0. The listeners were asked to write down a word by listening to each speech sample. We also conducted another in- telligibility test using the simulated speech samples with “GS”
by settingαto 0.2, 0.4, 0.6, and 0.8. In each setting, 20 famil-
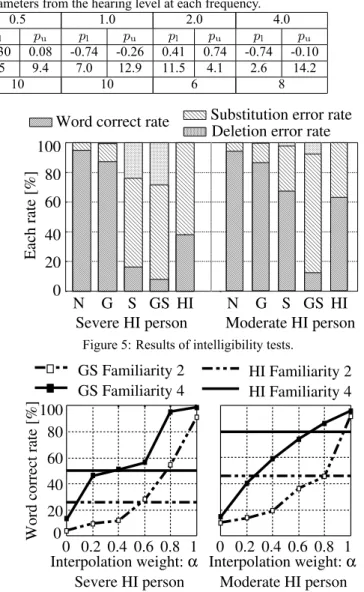
Table 1: Prediction accuracy of the roex filter parameters from the hearing level at each frequency.
Frequency [kHz] 0.25 0.5 1.0 2.0 4.0
Filter parameters pl pu pl pu pl pu pl pu pl pu
Correlation coefficient -0.75 -0.88 -0.30 0.08 -0.74 -0.26 0.41 0.74 -0.74 -0.10
Root mean square error 3.5 4.4 8.5 9.4 7.0 12.9 11.5 4.1 2.6 14.2
Number of hearing impaired persons 9 10 10 6 8
iar words (familiarity 4) and 20 unfamiliar words (familiarity 2) were evaluated. In each intelligibility test, the number of listeners was 8 and each listener evaluated 160 different words in total. All listeners are male and female graduate students in their twenties. Each word was presented to each listener only once. As a target reference, the severe and moderate HI persons evaluated 60 familiar words (familiarity 4) and 60 unfamiliar words (familiarity 2) of normal speech.
4.2. Experimental results
Figure 5shows the results of the hearing impairment simula- tion for the severe HI person and the moderate HI person. The smearing process “S” causes larger degradation in the word cor- rect rate than the gain reduction process “G.” Moreover, the combination of both processes “GS” causes further degradation.
We can see a tendency that the word correct rate of the simu- lated speech “GS” is significantly lower than the target “HI.”
This difference is caused by the approximated processes in the proposed method.
Figure 6shows the result when varying the interpolation weightα. The word correct rate gradually recovers as the in- terpolation weight increases. We can see that the word correct rate of the simulated speech is close to that of the target “HI” in both the familiarity 4 words and the familiarity 2 words by set- tingαto 0.4 or 0.6 for the severe HI person and to 0.6 or 0.8 for the moderate HI person. This result suggests that the simulation accuracy is effectively improved by adjusting the interpolation weight in the proposed method according to individual hearing- impaired persons.
We also investigated phoneme confusion tendency of the target HI persons and the normal-hearing persons using the pro- posed system. As a result, mora confusion rates for the severe HI person are shown inTable 2, where a mora is one linguistic unit in Japanese. We can see that the confusion rates of the sim- ulated speech “GS” (α= 0.6) are somewhat similar to those of the target HI. We also found a similar tendency for the moderate HI person.
5. Conclusions
In this paper, we have proposed a hearing impairment simula- tion method based on a gain reduction process and a smearing process using audiogram-based approximation of auditory char- acteristics, enabling easily application to individual hearing- impaired persons. We have used the proposed system to sim- ulate a severe hearing-impaired person and a moderate hearing- impaired person and evaluated their performance. The experi- mental results have demonstrated that intelligibility of the sim- ulated speech tends to be lower than that of the target hearing- impaired persons but this difference can be effectively mini- mized by manually adjusting a single parameter to control the hearing level.
Acknowledgements: Part of this work was supported by JSPS KAKENHI Grant Number 23240023.
0 20 40 60 80 100
Word correct rate
N G S GS HI Severe HI person
Deletion error rate Substitution error rate
N G S GS HI Moderate HI person
Each rate [%]
Figure 5: Results of intelligibility tests.
GS Familiarity 2 GS Familiarity 4
HI Familiarity 2 HI Familiarity 4
Word correct rate [%]
100 80 60 40 20
00 0.2 0.4 0.6 0.8 1
Interpolation weight: α 0 0.2 0.4 0.6 0.8 1 Interpolation weight: α Severe HI person Moderate HI person Figure 6: Word correct rate as a function of the interpolation weightα.
Table 2: Mora confusion rates averaged over morae consist- ing of the same vowel for the severe HI person (upper table) and normal-hearing persons with the proposed system (lower table). Each row shows presented mora and each column shows perceived mora.
Severe HI /a/ /i/ /u/ /e/ /o/ /N/
/a/ 96.3 0.0 3.7 0.0 0.0 0.0
/i/ 3.8 57.7 34.6 0.0 0.0 3.8
/u/ 3.1 68.8 15.6 9.4 0.0 3.1
/e/ 0.0 4.8 4.8 47.6 42.9 0.0
/o/ 16.7 0.0 0.0 8.3 50.0 25.0
/N/ 0.0 87.5 12.5 0.0 0.0 0.0
GS,α= 0.6 /a/ /i/ /u/ /e/ /o/ /N/
/a/ 67.4 0.0 1.1 2.1 29.3 0.0
/i/ 0.0 71.1 23.6 0.0 1.1 4.2
/u/ 0.0 74.0 14.7 6.7 0.9 3.7
/e/ 13.6 2.8 10.2 30.6 42.8 0.0
/o/ 20.5 5.0 5.0 13.6 55.9 0.0
/N/ 0.0 87.0 13.0 0.0 0.0 0.0
6. References
[1] N. P. Erber, “Applications of hearing-loss simulation in education of student clinicians,”Journal of Academy of Rehabilitative Audiology, Vol. 28, pp. 37–50, 1995.
[2] R. D. Patterson, I. N. Smith, D. L. Weber, and R. Milroy,
“The deterioration of hearing with age: frequency selec- tivity, the critical ratio, the audiogram, and speech thresh- old,”The Journal of the Acoustical Society of America, Vol. 72, No. 6, pp. 1788–1803, Dec. 1982.
[3] B. C.J. Moore, B. R. Glasberg, and A. Simpson, “Evalu- ation of a method of simulating reduced frequency selec- tivity,”The Journal of the Acoustical Society of America, Vol. 91, No. 6, pp. 3402–3423, June 1992.
[4] R. S. Tyler, J. W. Hall, B. R. Glasberg, B. C. J. Moore, and R. D. Patterson, “Auditory filter asymmetry in the hearing impaired,”The Journal of the Acoustical Society of Amer- ica, Vol. 76, No. 5, pp. 1363–1368, Nov. 1984.
[5] H. Hu, J. Sang, M. E. Lutman, and S. Bleech, “Simulation of hearing loss using compressive gammachirp auditory filters,”Proc. ICASSP, pp. 5428–5431, Prague, Czech Re- public, May 2011.
[6] B. R. Glasberg and B. C. J. Moore, “Derivation of auditory filter shapes from notched-noise data,”Hearing research, Vol. 47, No. 1, pp. 103–138, Feb. 1990.
[7] T. Irino and R. D. Patterson. “A time-domain, level- dependent auditory filter: the gammachirp,”The Journal of the Acoustical Society of America, Vol. 101, No. 1, pp.
412–419, Jan. 1997.
[8] T. Irino and R. D. Patterson. “A compressive gammachirp auditory filter for both physiological and psychophysical data,”The Journal of the Acoustical Society of America, Vol. 109, No. 5, pp. 2008–2022, May 2001.
[9] T. Baer and B. C. J. Moore, “Effects of spectral smearing on the intelligibility of sentences in noise,”The Journal of the Acoustical Society of America, Vol. 94, No. 3, pp.
1229–1241, Sep. 1993.
[10] F. Asano, Y. Suzuki, T. Sone, T. Hayashi, M. Satake, K.
Ohyama, T. Kobayashi, and T. Takasaka, “A method of designing and realizing a digital hearing aid that compen- sates loudness for impaired listeners,”The Journal of the Acoustical Society of Japan (in Japanese), Vol. 47, No. 6, pp. 373–379, June, 1991.
[11] B. R. Glasberg and B. C. J. Moore, “Auditory filter shapes in subjects with unilateral and bilateral cochlear impair- ments,”The Journal of the Acoustical Society of America, Vol. 79, No. 4, pp. 1020–1033, Apr. 1986.
[12] J. G. Desloge, C. M. Read, L. D. Braida, Z. D. Pere, and L.
A. Delhorne, “Auditory-filter characteristics for listeners with real and simulated hearing impairment,” Trends in Amplification, Vol. 16, No. 1, pp. 19–39, Mar. 2012.
[13] T. Kondo, S. Amano, S. Sakamoto, Y. Suzuki, “Develop- ment of familiarity-controlled word-lists (FW07),”IEICE Technical Report (in Japanese), Vol. 107, No. 432, pp.
43–48, Jan., 2008.