New Parameter to Predict Recurrence of Paroxysmal Atrial Fibrillation after Pulmonary Vein Isolation by the P-Wave Signal- Averaged Electrocardiogram
Yumi Munetsugu1), Mitsuharu Kawamura1), Kaoru Tanno2) and Youichi Kobayashi1)
1) Division of Cardiology, Department of Medicine, Showa University School of Medicine. 1-5-8 Hatanaodai, Shinagawa-ku, Tokyo, 142- 8666 Japan.
Telephone; +81 3 3784 8000, Fax; +81 3 3784 8822,
2) Cardiovascular Center, Showa University Koto Toyosu Hospital. 5- 1-38 Toyosu, Koto-ku, Tokyo, 135-8577 Japan.
Telephone; +81 3 6204 6000
Corresponding author; Mitsuharu Kawamura
Running title: Prediction of AF Recurrence after PVI by P-SAECG Disclosure: None
Abstract
Noninvasive methods for predicting the recurrence of atrial fibrillation (AF) after initial pulmonary vein isolation (PVI) have not been well described. The aim of the present study was to evaluate the usefulness of the P-wave signal-averaged electrocardiogram (P- SAECG) in predicting the recurrence of AF after initial PVI. The P- SAECG was recorded before and after (within 1 week) the initial PVI session. The filtered P-wave duration (FPD) and root mean square voltage of the last 20 ms of the filtered P-wave (LP20) were measured in 87 consecutive idiopathic AF patients (ejection fraction ≥50%, B- type natriuretic peptide ≤200 pg/mL). During the follow-up period (12
± 7 months), 22 of 87 (25%) patients had recurrence of AF (11 with paroxysmal AF and 11 with persistent AF). In the group with recurrence of paroxysmal AF, the post-PVI FPD was significantly shorter and the post-PVI LP20 was significantly larger than in the non-recurrence group. Furthermore, the post-PVI LP20/FPD ratio was significantly higher in the group with paroxysmal AF recurrence
that in the non-recurrence group (0.024 ± 0.009 vs 0.015 ± 0.007 μV/ms, respectively; P < 0.05). Recurrence of paroxysmal AF was more frequently observed in patients with a post-PVI LP20/FPD
>0.015 μV/ms than in those with a post-PVI LP20/FPD ≤0.015 μV/ms.
The optimal post-PVI LP20/FPD cut-off value of 0.015 μV/ms had a sensitivity of 90% and a specificity of 60%. The data also suggest that the post-PVI LP20/FPD may be a new parameter for predicting successful PVI in patients with idiopathic paroxysmal AF after PVI.
Keywords: P-wave signal-averaged electrocardiogram; Late potential;
Atrial fibrillation; Pulmonary vein isolation; Recurrence
Introduction
Atrial fibrillation (AF) is the most frequently encountered arrhythmia in clinical practice, occurring in 1%–2% of the general population.1 The pulmonary veins (PVs) play an important role in both the initiation and maintenance of AF.2, 3 Recently, PV isolation
(PVI) has been shown to be effective for curing paroxysmal and persistent AF.4, 5 Furthermore, PVI for paroxysmal AF results in the maintenance of sinus rhythm (SR) without any antiarrhythmic drugs in 70%–90% of patients.6 However, AF recurs in 10%–30% of patients after successful PVI. The recurrence rate is higher in patients with structural heart disease7 or prolonged AF duration, such as persistent AF.8 Persistent AF has been shown to lead to atrial interstitial fibrosis, resulting in an increased atrial conduction time.9 This structural remodeling, in addition to electrophysiological remodeling such as a shortening or loss of the rate adaptation of the atrial refractory period10 or prolonged atrial conduction times,11, 12 may increase the recurrence of AF after PVI. The signal-averaged electrocardiogram (SAECG) is a simple non-invasive method that has been used for years, initially to evaluate ventricular late potentials, but now extended to the P-wave to provide a more accurate evaluation of atrial conduction. Many studies have used this method to evaluate reductions in P-wave duration to predict the recurrence of
AF after PVI.13, 14 In a previous report,14 patients with recurrence of AF after PVI, short filtered P-wave duration (FPD) and elevation of root mean square voltage of the last 20 ms of the filtered P-wave (LP20) are sometimes recorded. In these cases, the P-wave SAECG (P-SAECG) was recorded within 1 week after PVI; however, in a previous report13 the day of recording P-SAECG was not clear. Based on these observations, we thought that the FDP and LP20 within 1 week after PVI may be different from those reported in previous studies.13, 14 Thus, the aim of the present study was to evaluate the usefulness of P-SAECG within 1 week after the initial PVI to establish a new parameter of the recurrence of AF after the initial PVI.
Materials and Methods Study population
The present study was a retrospective analysis of consecutive patients with AF. From April 2008 to November 2012, 87 consecutive
patients (67 males, 20 females; mean [± SD] age 60 ± 12 years) who underwent an initial PVI session for paroxysmal (n = 65) or persistent (n = 22) AF in the Division of Cardiology, Department of Medicine, Showa University School of Medicine were evaluated. In the present study, paroxysmal AF was defined as AF terminating within 7 days, and persistent AF was defined as non-self-terminating AF lasting more than 7 days and requiring pharmacologic or electrical conversion to restore SR. Patients were excluded from the study if the P-SAECG was not appropriately recorded. Other exclusion criteria were as follows: structural heart disease, prior PVI, implanted pacemaker, mitral or aortic valve disease, left ventricular dysfunction (left ventricular ejection fraction (LVEF) <50%), and congestive heart failure (plasma B-type natriuretic peptide (BNP) concentrations >200 pg/mL). P-SAECG was recorded before and after (within 1 week) the initial PVI in all patients.
Signal-Averaged P-Wave Electrocardiography
Figure 1 shows an example of a P-SAECG. This P-SAECG was recorded in the P-wave-triggered mode (FDX-6500; Fukuda Denshi Co., Tokyo, Japan). The P-wave signals (>200 beats) were recorded from a standard 12-lead electrocardiogram (ECG) until the noise amplitude was reduced to <0.4 μV. The signal from Lead II was filtered bidirectionally (with forward and backward filters) through a filter setting of 60 Hz, and a backward filter was used for the analysis in the present study. The filtered signals from Leads I, aVF, and V1 were combined into a vector magnitude of the P-wave. The FPD and LP20 were measured and the ratio LP20/FPD was calculated.
Measurements of FPD and LP20 were made automatically and, if necessary, corrected manually by two physicians blinded to the clinical information of the patient.
Ablation procedure
A straight decapolar catheter was positioned in the high right atrium and coronary sinus. After trans-septal puncture at the fossa ovalis,
the venous anatomy and location of the left atrial (LA)– PV junction were determined using a three-dimensional (3D) mapping system (CARTO, Biosence Webster Inc., Diamond Bar, CA, USA or NaVX, St.
Jude Medical, St. Paul, MN, USA). Then, a circular catheter was placed first at the superior LA–PV junction and then at the contralateral LA–PV junction. The PVI was performed guided by the 3D mapping system. An irrigated ablation catheter was used for the mapping and ablation. Radiofrequency energy was applied for 15–30 s at each site using a maximum temperature of 40°C, maximum power of 35 W, and flow rate of 30 mL/min. An atrial circumferential ablation was performed to encircle the left- and right-sided PVs. The procedural endpoint was the electrical isolation of all PVs from the LA.
Follow-up
After the PVI session, patients were follow-up for a period up to 2 years. The mean (± SD) follow-up period was 12 ± 7 months. Oral
anticoagulant drugs were continued in all patients and antiarrhythmic drugs were continued in 69 patients (79.3%). During the follow-up period, a surface 12-lead ECG was performed once a month and a 24-h ECG recording was performed at intervals of several months, as well as at any time that the patient had any symptoms suggestive of AF, such as palpitations, dizziness, or syncope.
The recurrence of AF was evaluated by 12-lead ECG recordings and a 24-h ECG recording. The blanking period was defined as the 3 months after PVI.
Statistical analysis
Patients were divided into three groups: a non-recurrence group (Non-Re), a group with recurrence of paroxysmal AF (Paroxy-Re) and a group with recurrence of persistent AF (Persis-Re). Comparisons were made between two groups, namely Non-Re vs. Paroxy-Re and Non-Re vs. Persis-Re, and the significance of differences in continuous variables was determined using Student’s unpaired t-test,
whereas the χ2 or Fischer’s exact test was used in comparisons of categorical data. To obtain an index of the overall FPD and RMS20 in the patients with and without recurrence of paroxysmal AF, a receiver operating characteristic (ROC) curve was generated and the area under the curve was calculated. The AF-free rates in the patients with an LP20/FPD ≦ 0.015 μV/ms and > 0.015 μV/ms were calculated using the Kaplan-Meier method, and the difference between them was detected using the log-rank test. The duration of AF, left atrial dimension, LVEF, (of which the P values were less than 0.05 using the Student’s t-test and χ 2 test) were evaluated by the Cox’s multivariate regression analysis. Statistical significance was accepted at a P < 0.05. Where appropriate, data are given as the mean ± SD.
Results
Clinical Characteristics
The clinical characteristics of patients in the Non-Re, Paroxy-Re,
and Persis-Re groups are given in Table 1. There were no significant differences in the age, gender, duration of AF, LVEF, BNP, CHADS2 score, or CHA2DS2-VASc score between the Non-Re and recurrence groups (Paroxy-Re or Persis-Re). The long axis of the left atrial diameter (LAD) was significantly longer in patients in the Persis-Re group compared with the Non-Re and Paroxy-RE groups (63.5 ± 10.7 vs. 53.4 ± 8.5 and 53.1 ± 10.3 mm, respectively; P < 0.05).
Signal-Averaged P-Wave Electrocardiography
There were no significant differences in FPD and LP20 before PVI between the Non-Re and Paroxy-Re or Persis-Re groups (pre-PVI FPD 134 ± 11.6 vs. 125 ± 11.5 and 149 ± 9.0 ms, respectively; Fig. 2A).
Conversely, the post-PVI FPD in the Paroxy-Re group was significantly shorter than in the Non-Re group (123 ± 9.1 vs. 131 ± 11.7 ms, respectively; P < 0.05; Fig. 2B). The post-PVI LP20 in the Paroxy-Re group was significantly larger than in the Non-Re group (2.9 ± 1.1 vs. 2.0 ± 0.9 μV, respectively; P < 0.05; Fig. 2B). There was
no significant difference in the pre-PVI LP20/FPD between the Non- Re and Paroxy-Re groups (0.018 ± 0.011 vs. 0.02 ± 0.007 μV/ms, respectively; Fig. 3A), but there was a significant difference in the LP20/FPD ratio between these two groups after the initial PVI (0.015
± 0.007 vs. 0.024 ± 0.009 μV/ms, respectively; P < 0.05; Fig. 3B).
Predictors of AF Recurrence
To evaluate the total predictive performance of the post-PVI LP20, post-PVI FPD, and post-PVI LP20/FPD for predicting Paroxy-Re, receiver operating characteristic (ROC) analyses were performed, revealing that the post-PVI LP20/FPD was a more useful predictor of Paroxy-Re than either the post-PVI FPD or post-PVI LP20 (Fig. 4A).
The optimal post-PVI LP20/FPD cut-off value of 0.015 μV/ms had a sensitivity of 90% and a specificity of 60%. Figure 4B shows the AF- free rate curve for patients with Non-Re (n = 65) or Paroxy-Re (n = 11) with a post-PVI Lp20/FPD of ≤0.015 or > 0.015 μV/ms. Paroxy-Re was more frequently observed in patients with a post-PVI LP20/FPD
>0.015 μV/ms than in those with a post-PVI LP20/FPD ≤0.015 μV/ms (P = 0.0027, log-rank test).
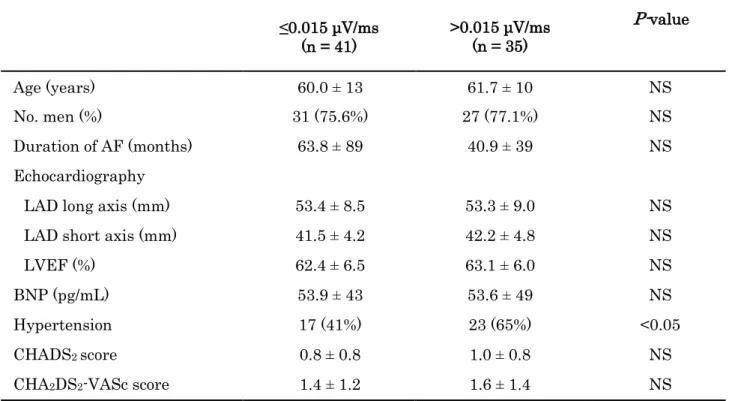
Clinical Characteristics of Patients with Post-PVI LP20/FPD ≤0.015 or >0.015 μV/ms
The clinical characteristics of patients with a post-PVI LP20/FPD
≤0.015 μV/ms (n = 41) or >0.015 μV/ms (n = 35) are given in Table 2.
There were no significant differences in the age, gender, duration of AF, LVEF, BNP, CHADS2 score, and CHA2DS2-VASc score between patients with a post-PVI LP20/FPD of ≤0.015 and >0.015 μV/ms.
However, hypertension was significantly more frequent in the group with post-PVI LP20/FPD >0.015 μV/ms (n = 23) than in the group with post-PVI LP20/FPD ≤0.015 μV/ms (n = 16; P < 0.05; Table 2).
Discussion
The present is the first to describe the usefulness of the post-PVI LP20/FPD for predicting Paroxy-Re after initial PVI. The main
findings of the present study are that: (i) the post-PVI FPD was significantly shorter and the post-PVI LP20 was significantly larger in the Paroxy-Re compared with Non-Re group; and (ii) the post-PVI LP20/FPD was useful for predicting Paroxy-Re after PVI, with a cut- off value of 0.015 μV/ms.
The findings in the present study of a significantly shorter post-PVI FPD and a significantly larger post-PVI LP20 in the Paroxy-Re versus Non-Re group are the opposite of those reported previously.
Previous studies14, 15 reported that FPD was significantly reduced in patients without AF recurrence during the follow-up period.
Okumura et al.15 measured SAECG before and after both ostial and circumferential PVI (CPVI; n = 51) in patients with paroxysmal and persistent AF. Patients with a successful outcome after CPVI had significant shortening of the FPD (from 146 ± 13 to 136 ± 12 ms; P <
0.01) compared with those in whom recurrence occurred (from 167 ± 15 to 157 ± 15 ms; P = 0.2). Furthermore, Ogawa et al.14 measured SAECG before and after segmental ostial catheter ablation (n = 27) in
patients with paroxysmal and persistent AF. Patients without AF recurrence during the follow-up period had a significant reduction in FPD (from 161 ± 7 to 151 ± 8 ms; ΔFPD 10 ± 7 ms; P < 0.0001), whereas there was no significant shortening in FPD in patients with AF recurrence (ΔFPD 2 ± 9 ms; P = NS). A cut-off value of ≥5 ms for the reduction in the P-wave had a sensitivity of 92% and a specificity of 71% to predict a good clinical outcome. For that reason, shortening of the FPD after PVI was reported to be a predictor of successful AF ablation.16, 17 In the present study, the results were opposite to those reported in these previous studies. We suppose that shorting of the FPD after PVI in the present study may be due to the complete electrical isolation of all four PVs at the time of the PVI session.
However, during the follow-up period, there was a reconnection of the electrical conduction between the PV and LA in some patients. We suppose that other factors are needed to predict the electrical reconnection of PVs.
The P-SAECG is useful for identifying individuals at risk of
developing AF and those likely to change from paroxysmal to chronic AF.18 Previous studies have shown that patients with chronic AF have a lower LP20 than those with paroxysmal AF.19 However, the usefulness of the LP20 for the prediction of AF recurrence after PVI was not proved. Ogawa et al.14 performed computer simulation studies using a realistic 3D atrial activation model, and the results confirmed a reduction in P-wave duration and changes in the terminal portion of the P-wave morphology after simulated PVI.
These findings suggest that the PV muscle sleeves are responsible for the terminal portion of the P-wave, and contribute to the late potentials on the P-SAECG. Furthermore, Ogawa et al.14 documented that the LP20 increased significantly after the PVI procedure, both in patients with either successful or failed ablation. Therefore, the LP20 was not proven as a useful parameter for prognostication after AF ablation. However, in the present study, in the case of only those patients with paroxysmal AF recurrence (the study population was limited to idiopathic AF patients with LVEF ≥50% and BNP ≤200
pg/mL), the post-PVI LP20 was significantly larger than in patients without recurrence, and these results proved that the LP20 was a useful parameter for the prediction of recurrence of paroxysmal AF after PVI.
The notable finding of the present study is that the shorter FPD and larger LP20 after initial PVI were significantly associated with a recurrence of paroxysmal AF, as indicated by univariate analysis, with multivariate analysis revealing that a post-PVI LP20/FPD
>0.015 μV/ms was a predictor of the recurrence of paroxysmal AF.
However, post-PVI LP20/FPD is not a useful predictor of the recurrence of persistent AF. We believe that the likely explanation for this finding is down to the different mechanisms of initiation and maintenance of AF. Activity triggered from the LA–PV junction initiate AF, and cause paroxysmal AF. Atrial structural remodeling in addition to electrophysiological remodeling is responsible for the maintenance of AF, and causes paroxysmal AF. Modifications in FPD and LP20 after PVI reflect the electrical isolation of the LA–PV
junction. For this reason, the post-PVI FDP and LP20 are not associated with the recurrence of persistent AF.
Study Limitations
The present study has several limitations. First, measurement of the P-SAECG is sometimes difficult because of noise, inappropriate cardiac rhythms, or overlap between the end of the P-wave and the beginning of the QRS complex. Our definition of atrial late potentials was arbitrary because there are no established criteria for atrial late potentials. In addition, pre-ablation antiarrhythmic drug therapy was not discontinued and the treatment was maintained after the procedure; some drugs may have affected FPD. Furthermore, asymptomatic recurrence may have occurred during the follow-up period and the rate of recurrence may have been underestimated.
Such limitations are also applicable to all studies of PVI for AF.
Further prospective studies are needed to ascertain the relationship between AF recurrence and LP20/FPD.
Conclusions
The post-PVI LP20/FPD may be useful for predicting paroxysmal AF recurrence in patients with idiopathic AF after PVI.
Acknowledgements
We thank the Division of Cardiology, Department of Medicine, Showa University School of Medicine for allowing to perform this study.
References
1. Tzou WS, Marchlinski FE, Zado ES, et al. Long-term outcome after successful catheter ablation of atrial fibrillation. Circ Arrhythm Electrophysiol. 2010;3(3):237-242.
2. Haïssaguerre M, Jaïs P, Shah DC, et al. Spontaneous initiation of atrial fibrillation by ectopic beats originating in the pulmonary veins. N Engl J Med. 1998;339(10):659-666.
3. Kumagai K, Yasuda T, Tojo H, et al. Role of rapid focal activation in the maintenance of atrial fibrillation originating from the pulmonary veins. Pacing Clin Electrophysiol. 2000;23(11 Pt 2):1823-1827.
4. Haïssaguerre M, Jaïs P, Shah DC, et al. Electrophysiological end point for catheter ablation of atrial fibrillation initiated from multiple pulmonary venous foci. Circulation. 2000;101(12):1409- 1417.
5. Oral H, Knight BP, Tada H, et al. Pulmonary vein isolation for paroxysmal and persistent atrial fibrillation. Circulation.
2002;105(9):1077-1081.
6. Pappone C, Rosanio S, Oreto G, et al. Circumferential radiofrequency ablation of pulmonary vein ostia: A new anatomic approach for curing atrial fibrillation. Circulation.
2000;102(21):2619-2628.
7. Yasuda T, Kumagai K, Ogawa M, et al. Predictors of successful catheter ablation for atrial fibrillation using the pulmonary vein isolation technique. J Cardiol. 2004;44(2):53-58.
8. Thomas SP, Aggarwal G, Boyd AC, et al. A comparison of open irrigated and non-irrigated tip catheter ablation for pulmonary vein isolation. Europace. 2004;6(4):330-335.
9. Allessie M, Ausma J, Schotten U. Electrical, contractile and structural remodeling during atrial fibrillation. Cardiovasc Res.
2002;54(2):230-246.
10. Wijffels MC, Kirchhof CJ, Dorland R, et al. Atrial fibrillation begets atrial fibrillation. A study in awake chronically instrumented goats. Circulation. 1995;92(7):1954-1968.
11. Fukunami M, Yamada T, Ohmori M, et al. Detection of patients at risk for paroxysmal atrial fibrillation during sinus rhythm by P wave-triggered signal-averaged electrocardiogram. Circulation.
1991;83(1):162-169.
12. Manios EG, Kanoupakis EM, Chlouverakis GI, et al. Changes in atrial electrical properties following cardioversion of chronic atrial fibrillation: relation with recurrence. Cardiovasc Res.
2000;47(2):244-253.
13. Van Beeumen K, Houben R, Tavernier R, et al. Changes in P-wave area and P-wave duration after circumferential pulmonary vein isolation. Europace. 2010;12(6):798-804.
14. Ogawa M, Kumagai K, Vakulenko M, et al. Reduction of P-wave duration and successful pulmonary vein isolation in patients with atrial fibrillation. J Cardiovasc Electrophysiol. 2007;18(9):931-938.
15. Okumura Y, Watanabe I, Ohkubo K, et al. Prediction of the efficacy of pulmonary vein isolation for the treatment of atrial fibrillation by the signal-averaged P-wave duration. Pacing Clin
Electrophysiol. 2007;30(3):304-313.
16. Masuda M, Inoue K, Iwakura K, et al. Impact of pulmonary vein isolation on atrial late potentials: association with the recurrence of atrial fibrillation. Europace. 2013;15(4):501-507.
17. Blanche C, Tran N, Rigamonti F, et al. Value of P-wave signal averaging to predict atrial fibrillation recurrences after pulmonary vein isolation. Europace. 2013;15(2):198-204.
18. Abe Y, Fukunami M, Yamada T, et al. Prediction of transition to chronic atrial fibrillation in patients with paroxysmal atrial fibrillation by signal-averaged electrocardiography: a prospective study. Circulation. 1997;96(8):2612-2616.
19. Budeus M, Felix O, Hennersdorf M, et al. Prediction of conversion from paroxysmal to permanent atrial fibrillation. Pacing Clin Electrophysiol. 2007;30(2):243-252.
Figure legends
Figure 1 Sample P-wave signal-averaged electrocardiogram (P- SAECG) trace. FPD, filtered P-wave duration; LP20, root mean square voltage of the last 20 ms of the filtered P-wave. Recordings were made using the FDX-6500 (Fukuda Denshi Co., Tokyo, Japan).
Figure 2 Comparison of the filtered P-wave duration (FPD) and root mean square voltage of the last 20 ms of the filtered P-wave (LP20) before (A) and after (B) initial pulmonary vein isolation (PVI) in patients without any recurrence (Non-Re) and those with recurrence of paroxysmal or persistent atrial fibrillation (Paroxy-Re or Persis-Re, respectively). (A) There were no significant differences in the pre-PVI FPD and pre-PVI LP20 between the Non-Re and recurrence (Paroxy- Re or Persis-Re) groups. (B) The post-PVI FPD was significantly shorter in the Paroxy-Re than in the Non-Re group, whereas the post- PVI LP20 was significantly larger in the Paroxy-Re than Non-Re group. Green lines indicate the mean, with blue lines indicating the
SD.
Figure 3 Ratio of the root mean square voltage of the last 20 ms of the filtered P-wave (LP20) to filtered P-wave duration (FPD) before (A) and after (B) initial pulmonary vein isolation (PVI) in patients without any recurrence (Non-Re) and those with recurrence of paroxysmal or persistent atrial fibrillation (Paroxy-Re or Persis-Re, respectively). (A) There were no significant differences in pre-PVI LP20/FPD between the Non-Re and Paroxy-Re or Persis-Re groups.
(B) However, there was a significant difference in post-PVI LP20/FPD between the Non-Re and Paroxy-Re groups. Green lines indicate the mean, with blue lines indicating the SD.
Figure 4 (A) Receiver operating characteristic (ROC) curve for the various cut-off levels of the ratio of the root mean square voltage of the last 20 ms of the filtered P-wave (LP20) to filtered P-wave duration (FPD) after initial pulmonary vein isolation (post-PVI) for
predicting recurrence of atrial fibrillation (AF). (B) Kaplan–Meier curves for the survival-free rate from recurrence of paroxysmal AF in patients with a post-PVI LP20/FPD >0.015 and ≤0.015 μV/ms.
Patients with a post-PVI LP20/FPD >0.015 μV/ms had a higher risk of recurrence of paroxysmal AF than those with a post-PVI LP20/FPD
≤0.015 μV/ms (P = 0.027, log-rank test).
Table 1 Clinical characteristics of patients with non-recurrence and recurrence of paroxysmal or persistent atrial fibrillation (Paroxy-Re or Persis-Re, respectively) after initial pulmonary vein isolation
Non-Re
(n = 65) Recurrence P-value
Paroxy-Re
(n = 11) Persis-Re (n = 11)
Age (years) 61 ± 12 57 ± 12 57 ± 16 NS
No. men (%) 49 (75.3%) 9 (81%) 9 (81%) NS
Duration of AF (months) 53.0 ± 74* 54.9 ± 52 84.9 ± 55* <0.05 Echocardiography
LAD long axis (mm) 53.4 ± 8.5* 53.1 ± 10.3† 63.5 ± 10.7*† <0.05 LAD short axis (mm) 41.7 ± 4.4 42.8 ± 4.9 44.9 ± 5.3 NS LVEF (%) 62.9 ± 6.3* 61.9 ± 5.5 57.6 ± 5.6* <0.05
BNP (pg/mL) 51.3 ± 44 68.9 ± 52 68.6 ± 59 NS
Hypertension 33 (50%) 7 (63%) 7 (63%) NS
CHADS2 score 0.8 ± 0.9 1.1 ± 0.7 1.0 ± 1.1 NS
CHA2DS2-VASc score 1.5 ± 1.3 1.7 ± 1.2 1.6 ± 1.5 NS Persistent AF (%) 12 (18.4%)* 3 (27.2%)† 7 (63.6%)*† <0.05
Data are presented as the mean ± SD or as n (%). *P < 0.05 compared with Non-Re group and Persis-Re group; †P < 0.05 compared with Paroxy-Re group and Persis-Re group.
non-recurrence, Non-Re; paroxysmal AF recurrence, Paroxy-Re;
Persistent recurrence AF, Persis-Re; AF, atrial fibrillation; LAD, left atrial diameter; LVEF, left ventricular ejection fraction; BNP, plasma
B- type natriuretic peptide.
Table 2 Clinical characteristics of patients with values of ≤0.015 and
>0.015 μV/ms for the ratio of the root mean square voltage of the last 20 ms of the filtered P-wave (LP20)/filtered P-wave duration (FPD) after initial pulmonary vein isolation (post-PVI)
Post-PVI LP20/FPD
≤0.015 μV/ms
(n = 41) >0.015 μV/ms (n = 35)
P-value
Age (years) 60.0 ± 13 61.7 ± 10 NS
No. men (%) 31 (75.6%) 27 (77.1%) NS
Duration of AF (months) 63.8 ± 89 40.9 ± 39 NS
Echocardiography
LAD long axis (mm) 53.4 ± 8.5 53.3 ± 9.0 NS
LAD short axis (mm) 41.5 ± 4.2 42.2 ± 4.8 NS
LVEF (%) 62.4 ± 6.5 63.1 ± 6.0 NS
BNP (pg/mL) 53.9 ± 43 53.6 ± 49 NS
Hypertension 17 (41%) 23 (65%) <0.05
CHADS2 score 0.8 ± 0.8 1.0 ± 0.8 NS
CHA2DS2-VASc score 1.4 ± 1.2 1.6 ± 1.4 NS
Data are presented as the mean ± SD or as n (%).
AF, atrial fibrillation; LAD, left atrial diameter; LVEF, left ventricular ejection fraction; BNP, plasma B-type natriuretic peptide.
FPD
P wave
LP20
QRS wave
Figure 1
20ms
FPD : 135ms LP20 : 1.8μV
LP20/FPD = 1.8/135 (μV/ms)
Pre-PVI FPD
Pre-PVI LP20
ns ns
Non-recurrence Paroxysmal-AF Persistent-AF Recurrence
(ms) ns
Non-recurrence Paroxysmal-AF Persistent-AF Recurrence
ns
(μV)
Post-PVI FPD
Post-PVI LP20
P<0.05
P<0.001
(ms) P<0.05
ns
(μV)
A
B
Figure 2
FPDFPD LP20LP20
Non-recurrence Paroxysmal-AF Persistent-AF (μV/ms)
ns ns
Pre-PVI LP20/FPD
P<0.05 ns
Non-recurrence Paroxysmal-AF Persistent-AF (μV/ms)
Post-PVI LP20/FPD
A B
Figure 3
LP20/FPD LP20/FPD
0.045 0.040 0.035 0.030 0.025 0.020 0.015 0.010 0.005 0.000
0.045 0.040 0.035 0.030 0.025 0.020 0.015 0.010 0.005 0.000
Figure 4
A B
ROC curve
Post-PVI LP20/FPD ≦ 0.015μV/ms Post-PVI LP20/FPD > 0.015μV/ms
P = 0.0027
follow-up period (months)
Post-PVI LP20/FPD=0.015
1-Specificity
Sensitivity