Impacts of Mongolian FTAs with the Countries in Northeast Asia: CGE Analysis with the GTAP 8 Data Base*
Sh. Enkhbayar† Tomoyoshi Nakajima‡
Abstract
Having joined the WTO in 1997, Mongolia is a country with relatively liberal trade policies; but the country is not yet party to any regional or bilateral free trade agreements (FTAs). At the outset toward further robust economic development, Mongolia is keen to diversify its export markets. Recently, Mongolia began talks on concluding an EPA (Economic Partnership Agreement) with Japan.
An analysis using the CGE model and employing the Global Trade Analysis Project (GTAP) 8 Data Base revealed that the macroeconomic impacts of Mongolia’s bilateral FTAs with the four Northeast Asian countries of Russia, the ROK, Japan and China—Mongolia’s major trading partners—would be almost negligible. This result was consistent with the fact that currently Mongolia’s import tariff rates are already relatively low and the partner countries exercise almost near zero-tariffs for Mongolia’s major export commodities, of mining and livestock origin. Raw materials or low value-added products of mining or livestock origin account for more than 90% of the country’s total exports.
However, some of Mongolia’s manufacturing industries, such as textiles and apparel, leather and meat products can expect positive changes in their value-added along with increases of export sales. Also, these sectors would be the greatest potential sources of employment generation in Mongolia. Yet due to the relatively small shares of these products within Mongolia’s exports, their impacts on the country’s GDP were very small. Therefore, Mongolia needs to promote high value-added, export-oriented industries if the economy aims to benefit from free trade agreements with its trading partners.
Keywords: FTA, foreign trade policy, Mongolian economy, CGE analysis, GTAP Data Base
1. Recent Developments in Mongolia’s Foreign Trade Policy
Mongolia maintains an open and relatively liberal foreign trade policy aimed at supporting the country’s export-led growth strategy. As the World Bank noted: “Mongolia has one of the least restrictive trade regimes in Asia, and a relatively liberal foreign investment regime” (World Bank, 2009, p. 3). As a member Mongolia is maintaining more liberal trade regimes than its commitments made to the World Trade Organization (WTO). The Millennium Development Goals-based Comprehensive National Development Strategy of Mongolia up to 2021 stated the strategic objectives of Mongolia’s foreign trade policy as that “[a] favorable foreign trade environment shall be created for implementing the strategy for economic development prevalent with export-oriented production and services” and identified two strategic objectives: (i) to increase export volume and diversity rationally, and (ii) to expand and improve the variety and quantity of imports in line with long-term economic development trends (Dolgorjav, et al, 2008, p. 170).
Mongolia’s rich mineral resources and geographical proximity to China, the largest resource-hungry and dynamic economy, enabled the country’s mining sector to pursue its export- led growth. Mongolia’s economy has been on a continuous growth path since 1994, with the exception of 2009; the economy recorded a peak growth of 17.5% in 2011, whereas the mining
sector accounted for 24% of GDP and 89% of the exports, while employing less than 5% of the total employed. However, one-third of the country’s population still lives in poverty, and inequality and urban–rural disparities have remained persistent over the past two decades. Thus it was important to direct trade policies toward addressing these issues (Ministry of Foreign Affairs of Mongolia and UNDP, 2008).
Mongolia’s foreign trade prior to 1990 was characterized by a state monopoly on trade, a centrally-planned pricing system, and the export markets were limited to those of the former Council for Mutual Economic Assistance (CMEA [Comecon]) member countries under the dominance of the former Soviet Union (FSU). Since the beginning of the economic reforms in the early 1990s, trade liberalization was one of the immediate priorities for establishing the basis of a market economy and the government abolished the state monopoly and all quantitative restrictions on exports and imports, along with the export/import state-order system. Mongolia moved from a fixed exchange-rate system to a floating one in May 1993. According to the Law of Mongolia on Economic Entities passed in May 1991, all forms of economic entity, including sole proprietorships and individuals, were allowed to engage freely in independent foreign trade activities. Mongolia joined the International Convention on the Harmonized Commodity Description and Coding System (HS), developed by the World Customs Organization (WCO), on 30 September 1991 and introduced it on 1 January 1993. Currently, Mongolia is implementing the most recent version, HS2012, which entered into force on 1 January 2012 (WCO, 2013).
Customs controls, examination of goods, customs clearance procedures and enforcement of customs legislation by business entities, organizations and individuals are regulated by the Customs Law of Mongolia passed in 1996 and revised in 2008, whereas the customs tariff system, the principles for adopting customs duty rates, valuations, assessments and collection of customs duties are regulated by the Customs Tariff Law of Mongolia passed and revised in the same years. In addition to customs tariffs, value-added tax (VAT) and excise taxes are applied on imported goods. VAT of 10% was introduced in July 1998 under the Value-added Tax Law, which was revised in 2007, and imposition of VAT and its payment to and refunding from the state budget are regulated by this law. All merchandise exports are exempted from both customs and VAT duties, except a few items such as unprocessed camel wool, unprocessed goat and young goat skins, timber, wooden planks and blocks.
Mongolia joined the WTO on 29 January 1997 and most of Mongolia’s tariff lines were bounded at 20%, whereas a 15% uniform ad valorem customs duty was exercised at that time.
However, on 1 May 1997, the government unilaterally abolished the uniform customs duty and excise taxes on all imported goods, apart from those levied on a few items, such as alcohol, tobacco, petroleum products and motor vehicles, whereas revenues from customs taxes and duties constitute a substantial share of the state budget. Revenues from customs accounted for 34% of the state budget in 1990 and increased to 43% in 2012 (Mongolian Customs General Administration, 2013b).
Therefore, due to a growing need to increase budget revenues, the government increased VAT from 10% to 13% in September 1998. The following year, starting from 1 July 1999, a 5%
uniform import tariff was reintroduced, and an excise tax on beer followed soon after. From November 2000, the customs tariff underwent a further hike from 5% to 7%, with VAT rising to 15%. However, the customs duty was reduced back to 5% and VAT to 10% in January 2003—
with a few exceptions—and has remained unchanged to date (Enkhbayar Sh., 2010).
Pedigree animals, cattle, horses, pigs, sheep and goats (HS 01), automatic data-processing
machines, computer hardware, etc., and their parts and accessories (HS 8471, HS 8473.30), semiconductor devices, light-emitting diodes and parts (HS 8541), electronic integrated circuits, micro-assemblages and parts (HS 8542), medical, surgical, and veterinary instruments (HS 9018), except syringes (HS 9018.31), X-ray apparatus, tubes, panels, screens, etc., and parts (HS 9022) have zero-rate customs duties, whereas imported wheat flour and some domestically produced vegetables, such as potatoes, onions, cabbages, carrots and turnips, have seasonal tariff increases of 15%.
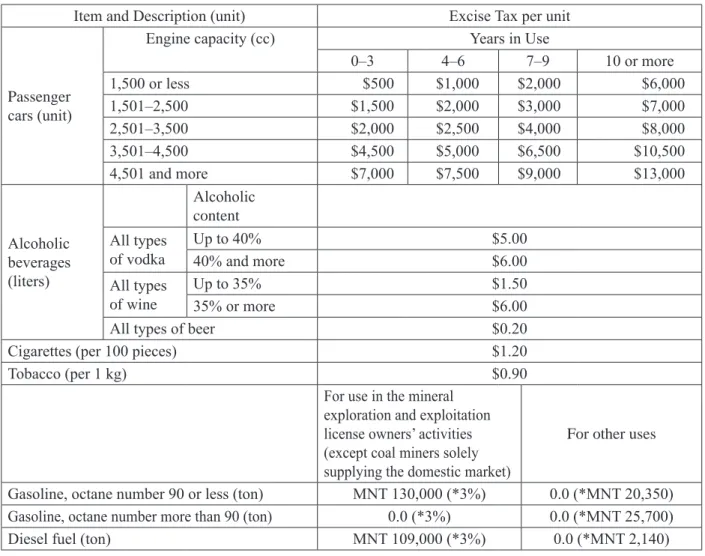
In addition to import duty and VAT, an excise tax is imposed on imported alcoholic beverages, cigarettes and tobacco, petroleum, diesel fuel and petroleum products and passenger cars, whereas hybrid cars are exempt from excise taxes so as to promote eco-friendly vehicles.
In order to support a stable supply of petroleum and diesel fuel, for which Mongolia is wholly dependent on imports, usage-specific tariff rates were imposed and became effective on 24 November 2012, and the excise taxes on petroleum and diesel fuel have been annulled, except where used for the activities of mineral exploration and exploitation license holders. At the same time, the customs tax was reduced to 3% for the petroleum and diesel fuels used in the activities of mineral exploration and exploitation license holders, and set at fixed amounts for other users (Table 1).
In addition Mongolia implements temporary sector-specific trade policies in line with the country’s development strategies. For example, imported and domestically traded new tractors, combines, machinery and equipment designed for use in agriculture, flour milling, irrigation and forestry machinery and equipment, and fertilizers and plant protection substances are exempt from both customs duties and VAT during the period from 29 May 2008 to 31 December 2016 (State Great Khural, 2008a, 2008b).
Mongolia acceded to the Convention on Temporary Admission (or Istanbul Convention) of the World Customs Organization on 5 June 2003 and is implementing six of its attachments: (i) Annex A concerning temporary admission papers (ATA carnets and CPD carnets); (ii) Annex B.1 concerning goods for display or use at exhibitions, fairs, meetings or similar events; (iii) Annex B.2 concerning professional equipment; (iv) Annex B.3 concerning containers, pallets, packing, samples and other goods imported in connection with a commercial operation; (v) Annex B.5 concerning goods imported for educational, scientific or cultural purposes; and (vi) Annex C concerning means of transport. The government of Mongolia has designated the Mongolian National Chamber of Commerce and Industry (MNCCI) to issue and guarantee ATA carnets within the country. The ATA carnet is an international customs and temporary export–import document that is used to clear customs in 83 countries and territories without paying duties and import taxes on merchandise that will be re-exported within 6–12 months (WCO, 2012;
Government of Mongolia, 2003).
Upon joining the WTO, Mongolia incorporated most of the provisions of the WTO agreements into its domestic laws, and where parts of the agreements are not incorporated, the WTO agreement can be applied directly. Therefore, private individuals can invoke the WTO agreement before a national court. So far, there have not been any cases involving Mongolia, either as a complainant or as a respondent under the WTO dispute settlement mechanism. The first Trade Policy Review of Mongolia by the Trade Policy Review Body of the WTO was conducted in March 2005. The report indicated that Mongolia has considerable room to raise its tariffs within the existing bounds under the WTO (WTO, 2005a).
Table 1 : Mongolia’s Excise Taxes on Imported Items
Item and Description (unit) Excise Tax per unit
Passenger cars (unit)
Engine capacity (cc) Years in Use
0–3 4–6 7–9 10 or more
1,500 or less $500 $1,000 $2,000 $6,000
1,501–2,500 $1,500 $2,000 $3,000 $7,000
2,501–3,500 $2,000 $2,500 $4,000 $8,000
3,501–4,500 $4,500 $5,000 $6,500 $10,500
4,501 and more $7,000 $7,500 $9,000 $13,000
Alcoholic beverages (liters)
Alcoholic content All types
of vodka
Up to 40% $5.00
40% and more $6.00
All types of wine
Up to 35% $1.50
35% or more $6.00
All types of beer $0.20
Cigarettes (per 100 pieces) $1.20
Tobacco (per 1 kg) $0.90
For use in the mineral exploration and exploitation license owners’ activities (except coal miners solely supplying the domestic market)
For other uses
Gasoline, octane number 90 or less (ton) MNT 130,000 (*3%) 0.0 (*MNT 20,350) Gasoline, octane number more than 90 (ton) 0.0 (*3%) 0.0 (*MNT 25,700)
Diesel fuel (ton) MNT 109,000 (*3%) 0.0 (*MNT 2,140)
Note: *Customs taxes.
Source: Mongolian Customs General Administration (2013a); Government of Mongolia (2012).
Aiming at increasing trade, attracting FDI and promoting export-oriented industries, the Mongolian government is working on creating free trade and economic zones, and industrial and technological parks. The General Law on Free Zones and the Law on the Legal Status of Altanbulag Free Trade Zone (FTZ), on the northern border, were approved in 2002, and the laws on the legal statuses of Zamyn-Uud Free Economic Zone (FEZ), on the southern border, and Tsagaannuur FTZ, on the western border, were approved in 2003. Also, a concept to develop industrial and technological parks was approved with Parliamentary Resolution No. 54 in 2003 (WTO, 2005b).
Mongolia currently trades with more than 120 countries and has bilateral trade, economic cooperation and investment promotion agreements with more than 30 countries, including Russia,1 China,2 the ROK3 and Japan.4 Mongolia is currently a beneficiary of the Canadian, Japanese, US and EU preferential schemes under the Generalized System of Preferences. In 2005, Mongolia became a beneficiary of the EU’s GSP+ scheme that provides a special incentive arrangement for sustainable development and good governance. Accordingly, about 7,200 HS items became eligible for exemption from customs tariffs until the end of 2008, but this was extended to 2014 (EU, 2005; EU, 2012).
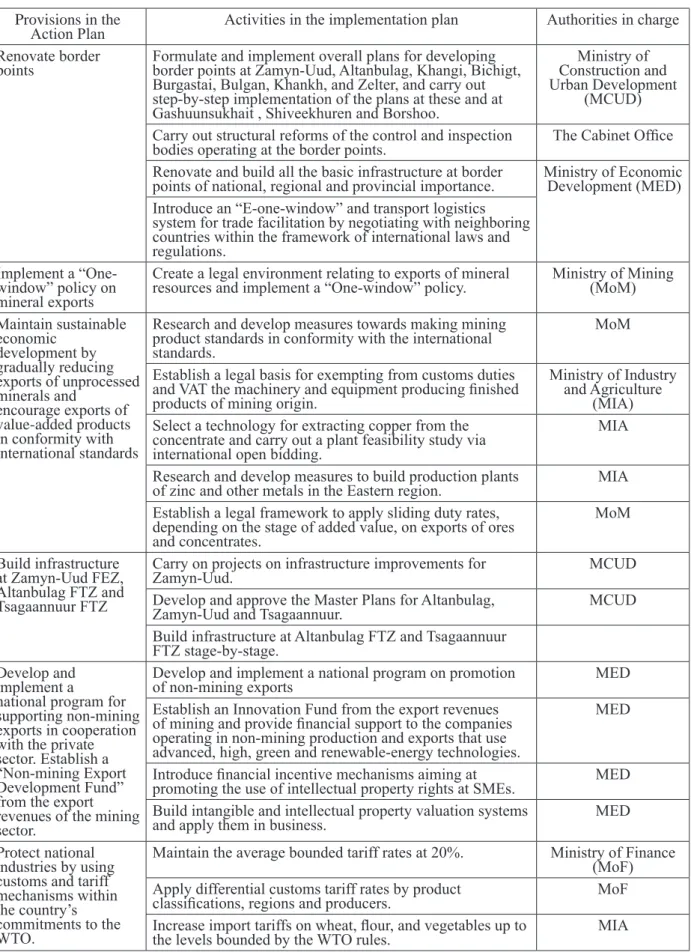
Furthermore, a number of provisions regarding foreign trade policies and regulations have been included in the Government Action Plan for 2012–2016 and measures for its implementation were described in the Plan for Implementation of the Action Plan for 2012–2016 (Table 2).
However, notwithstanding the government’s strategy to have free trade agreements (FTAs) with its major trading partners since the early years of joining the WTO, Mongolia is not yet a party to any regional or bilateral free trade agreement. At the outset toward further robust economic development, the country is keen to further diversify its export markets. In 2007, Mongolia began talks on negotiating an Economic Partnership Agreement (EPA) with Japan and the Joint Study Group report was completed in March 2011. To date, three rounds of negotiations were held alternately in each country, with the latest one being held in April 2013 in Ulaanbaatar.
If successful, this will be the first EPA for Mongolia.
Moreover, the rapidly growing Mongolian economy and the country’s vast mineral resources are continuing to attract foreign investments, including those of Japan. Bilateral economic relations between Mongolia and Japan have been gearing up recently and moved to the form of a “Strategic Partnership” in 2010 from the previous “Comprehensive Partnership”.
During the Japanese Prime Minister Abe’s visit to Mongolia in March 2013, a new initiative called the “ERCH [meaning “vitality” in Mongolian] Initiative: Japan-Mongolia Cooperative Initiative for Vibrant Economy” was launched. It aims to promote development of investment and the business environment between the two countries and cooperate for Mongolia’s sustainable economic development (MOFA, 2013).
Subsequently a Memorandum of Understanding on Cooperation to promote trade and investments between the two countries was signed between Japan’s Ministry of Economy, Trade and Industry (METI) and Mongolia’s Ministry of Economic Development (MED) on 3 May 2013 in Ulaanbaatar. The long-awaited construction of a new airport in Mongolia started in June 2013, with Japan extending a soft loan amounting to JPY 28.8 billion for the financing thereof. Also, a general agreement on extending the first export credit line, equal to JPY 8 billion, was signed between the Japan Bank for International Cooperation (JBIC) and MED on 6 June 2013 aimed at supporting Japanese companies’ exports to Mongolia. This is the first commercial term credit ever extended to Mongolia from Japan (Government of Mongolia, 2013, 10 and 12 June; JBIC, 2013).
Table 2 : Trade Related Measures in Mongolia’s Government Action Plan for 2012–2016
Provisions in the
Action Plan Activities in the implementation plan Authorities in charge Renovate border
points Formulate and implement overall plans for developing border points at Zamyn-Uud, Altanbulag, Khangi, Bichigt, Burgastai, Bulgan, Khankh, and Zelter, and carry out step-by-step implementation of the plans at these and at Gashuunsukhait , Shiveekhuren and Borshoo.
Ministry of Construction and Urban Development
(MCUD) Carry out structural reforms of the control and inspection
bodies operating at the border points. The Cabinet Office Renovate and build all the basic infrastructure at border
points of national, regional and provincial importance. Ministry of Economic Development (MED) Introduce an “E-one-window” and transport logistics
system for trade facilitation by negotiating with neighboring countries within the framework of international laws and regulations.
Implement a “One- window” policy on mineral exports
Create a legal environment relating to exports of mineral
resources and implement a “One-window” policy. Ministry of Mining (MoM) Maintain sustainable
economic development by gradually reducing exports of unprocessed minerals and
encourage exports of value-added products in conformity with international standards
Research and develop measures towards making mining product standards in conformity with the international standards.
MoM
Establish a legal basis for exempting from customs duties and VAT the machinery and equipment producing finished products of mining origin.
Ministry of Industry and Agriculture
(MIA) Select a technology for extracting copper from the
concentrate and carry out a plant feasibility study via international open bidding.
MIA
Research and develop measures to build production plants
of zinc and other metals in the Eastern region. MIA Establish a legal framework to apply sliding duty rates,
depending on the stage of added value, on exports of ores and concentrates.
MoM
Build infrastructure at Zamyn-Uud FEZ, Altanbulag FTZ and Tsagaannuur FTZ
Carry on projects on infrastructure improvements for
Zamyn-Uud. MCUD
Develop and approve the Master Plans for Altanbulag,
Zamyn-Uud and Tsagaannuur. MCUD
Build infrastructure at Altanbulag FTZ and Tsagaannuur FTZ stage-by-stage.
Develop and implement a
national program for supporting non-mining exports in cooperation with the private sector. Establish a
“Non-mining Export Development Fund”
from the export revenues of the mining sector.
Develop and implement a national program on promotion
of non-mining exports MED
Establish an Innovation Fund from the export revenues of mining and provide financial support to the companies operating in non-mining production and exports that use advanced, high, green and renewable-energy technologies.
MED
Introduce financial incentive mechanisms aiming at
promoting the use of intellectual property rights at SMEs. MED Build intangible and intellectual property valuation systems
and apply them in business. MED
Protect national industries by using customs and tariff mechanisms within the country’s commitments to the WTO.
Maintain the average bounded tariff rates at 20%. Ministry of Finance (MoF) Apply differential customs tariff rates by product
classifications, regions and producers. MoF
Increase import tariffs on wheat, flour, and vegetables up to
the levels bounded by the WTO rules. MIA
Source: Compiled from State Great Khural (Parliament) of Mongolia, 2012a, b.
2. Mongolia’s Trade with the Countries of Northeast Asia
2.1. Overall Trade Flow
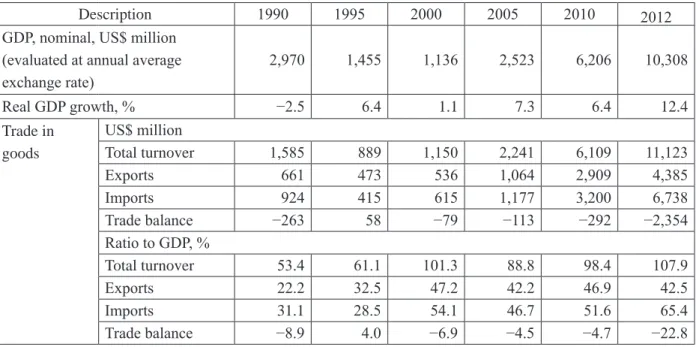
Foreign trade has a large presence in Mongolia’s economy, especially after the country’s transition toward a market economy and opening-up to world markets. The share of Mongolia’s merchandize trade turnover increased to 107.9% of nominal GDP in 2012 from 53.4% in 1990, while those of exports and imports increased to 42.5% and 65.4% in 2012 from 22.2% and 31.1%
in 1990, respectively. At the same time, the country’s foreign trade balance has been suffering from chronic deficits, except for a small number of years. The trade deficit escalated to 22.8% of GDP in 2012 due to the increased imports associated with the massive foreign investments into Mongolia’s mining sector. However, this situation is expected to substantially improve in the coming years with the start of production and export of newly added capacity in the country’s mining sector (Table 3).
Table 3 : Mongolia’s Foreign Trade and GDP (selected years)
Description 1990 1995 2000 2005 2010 2012
GDP, nominal, US$ million (evaluated at annual average exchange rate)
2,970 1,455 1,136 2,523 6,206 10,308
Real GDP growth, % −2.5 6.4 1.1 7.3 6.4 12.4
Trade in goods
US$ million
Total turnover 1,585 889 1,150 2,241 6,109 11,123
Exports 661 473 536 1,064 2,909 4,385
Imports 924 415 615 1,177 3,200 6,738
Trade balance −263 58 −79 −113 −292 −2,354
Ratio to GDP, %
Total turnover 53.4 61.1 101.3 88.8 98.4 107.9
Exports 22.2 32.5 47.2 42.2 46.9 42.5
Imports 31.1 28.5 54.1 46.7 51.6 65.4
Trade balance −8.9 4.0 −6.9 −4.5 −4.7 −22.8
Note: Estimated from Mongolian Statistical Yearbook, various issues.
Figure 1 : Map of Northeast Asia
Source: ERINA
Mongolia currently exports to approximately 60 countries and imports from more than 130 countries; however, trade turnover with the countries in Northeast Asia5 accounts for almost 80%
of the total. In 2011, exports to four Northeast Asian countries (excluding the DPRK) accounted for 95% of the total, while imports from these countries accounted for 68% of the total. However, Mongolia’s share of its trading partners’ foreign trade volume remains very limited—far less than 1%. Therefore, Mongolia’s ambition to have FTAs with its trading partners would be of “non-trade content” for the trading partners (Batnasan N., et al, 2012, p. 4; Table 4).
Mongolia is a landlocked country and has a limited international transportation network.
Therefore, the country’s two sole neighbors—China and Russia—have the largest presence in Mongolia’s foreign trade activities. In 2011, China was the only destination for 92% of Mongolia’s total exports and the origin of 30% of total imports, while the figures for Russia were 2% and 25%, respectively (Table 4, Figures 1, 2 and 3).
Table 4 : Mongolia’s Trade with Its Trading Partners, 2011
Trading partner
Partners’ share of Mongolia’s Foreign trade, % Mongolia’s share of Partners’
Foreign Trade, %
Trade Turnover Exports Imports Exports Imports
China 56.6 92.2 30.7 0.14 0.21
Russia 15.1 2.0 24.6 0.31 0.03
Japan 4.4 0.2 7.4 0.04 0.002
ROK 3.5 0.8 5.4 0.06 0.01
Total 79.6 95.2 68.1
Source: Adapted from Batnasan N., et al, 2012, p. 4.
Figure 2 : Destination of Mongolia’s Exports (Percentage of Total)
Source: Mongolian Statistical Yearbook, various issues
Figure 3 : Origin of Mongolia’s Imports (Percentage of Total)
Source: Mongolian Statistical Yearbook, various issues
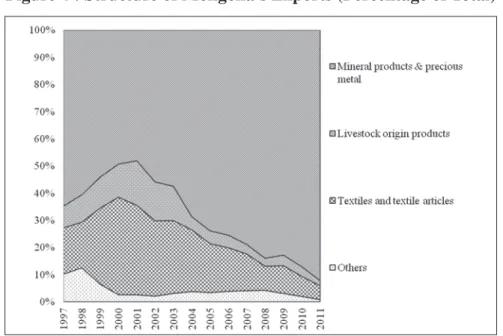
Although the Mongolian government has been persistently promoting an export-led growth policy for more than two decades, exports remain dominated by raw and low-value added products of mining and livestock origin, whereas imports consist of various manufactured goods, food, machinery and equipment and other industrial products. The share of mining-origin exports increased to 92% of the total in 2011 from 48% in 2001, whereas those of textiles and textile articles decreased to 5% in 2011 from 33% in 2001. Mongolia’s exports of textile and textile articles had been on the rise after the country’s accession to the WTO owing to Mongolia’s excess quota; but it was reversed when all the restrictions under the WTO Agreement on Textiles and Clothing (ATC) terminated in 2005.6 At the same time, the structure of Mongolia’s imports did not change much over the entire period (Figures 4 and 5).
Figure 4 : Structure of Mongolia’s Exports (Percentage of Total)
Source: Mongolian Statistical Yearbook, various issues
Figure 5 : Structure of Mongolia’s Imports (Percentage of Total)
Source: Mongolian Statistical Yearbook, various issues
2.2. Mongolia–China Trade
China is the largest trading partner of Mongolia. The first trade-related agreements between the two countries date back to 1951. Currently, there are more than 100 agreements in place relating to bilateral relations and cooperation in various fields. The main mechanism that regulates bilateral trade and economic relations is the “Committee on Trade, Economy, Science and Technical Cooperation between the Government of Mongolia and the Government of the People’s Republic of China”, which meets biennially. However, Mongolia is among the few developing countries in Asia that is not entitled to any tariff discount or preferential treatment in
the Chinese market (Ministry of Foreign Affairs of Mongolia and UNDP, 2008).
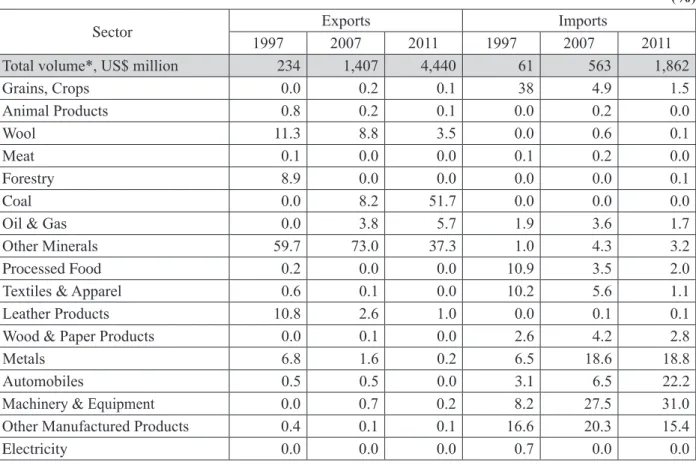
In terms of structure, Mongolia’s trade with China is basically connected to the country’s overall trade structure as described earlier. Coal has emerged as the top export commodity to China since the mid-2000s, accounting for 51.7% of the total in 2011, while the shares of other minerals and crude oil accounted for 37.3% and 5.7%, respectively. Imports of machinery and equipment from China had the largest share of the total, accounting for 22.2% in 2011, followed by those for metals and other manufactured products (Table 5).
Table 5 : Mongolia’s Trade with China: Volume and Structure, selected years
(%)
Sector Exports Imports
1997 2007 2011 1997 2007 2011
Total volume*, US$ million 234 1,407 4,440 61 563 1,862
Grains, Crops 0.0 0.2 0.1 38 4.9 1.5
Animal Products 0.8 0.2 0.1 0.0 0.2 0.0
Wool 11.3 8.8 3.5 0.0 0.6 0.1
Meat 0.1 0.0 0.0 0.1 0.2 0.0
Forestry 8.9 0.0 0.0 0.0 0.0 0.1
Coal 0.0 8.2 51.7 0.0 0.0 0.0
Oil & Gas 0.0 3.8 5.7 1.9 3.6 1.7
Other Minerals 59.7 73.0 37.3 1.0 4.3 3.2
Processed Food 0.2 0.0 0.0 10.9 3.5 2.0
Textiles & Apparel 0.6 0.1 0.0 10.2 5.6 1.1
Leather Products 10.8 2.6 1.0 0.0 0.1 0.1
Wood & Paper Products 0.0 0.1 0.0 2.6 4.2 2.8
Metals 6.8 1.6 0.2 6.5 18.6 18.8
Automobiles 0.5 0.5 0.0 3.1 6.5 22.2
Machinery & Equipment 0.0 0.7 0.2 8.2 27.5 31.0
Other Manufactured Products 0.4 0.1 0.1 16.6 20.3 15.4
Electricity 0.0 0.0 0.0 0.7 0.0 0.0
Notes: 1. * Data source: Mongolian Statistical Yearbook, various issues;
2. Percentage shares were estimated from Batnasan, N., et al, 2008 (personal communication).
2.3. Mongolia–Russia Trade
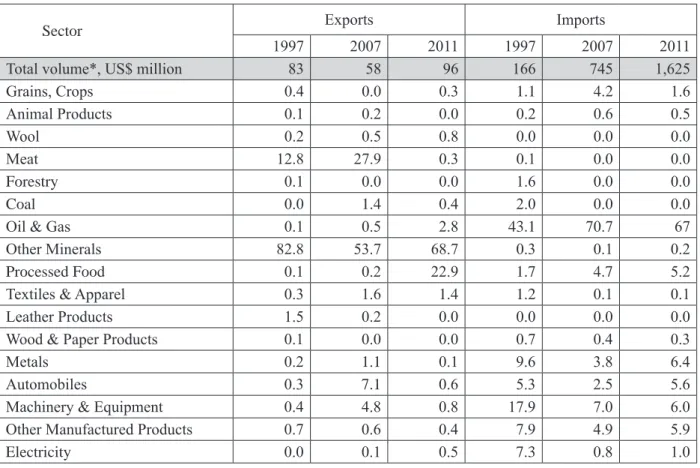
Mongolia’s trade with Russia dates back to 1923, when the first agreement on trade between the two countries was concluded in December of that year (Galsandorj, D. and Bud, Kh., 2001) and currently Russia is the second largest trading partner of Mongolia. Exports of other minerals (mainly fluorspar and copper concentrates) are dominant in Mongolia’s exports to Russia, followed by those of processed food (mainly mixed juice, alcoholic beverages and meat). Exports of these items accounted, respectively, for 68.7%, 22.9%, and 0.3% of the total in 2011.
Mongolia imports from Russia almost all of its petroleum and petroleum products and these items account for up to two thirds of the country’s imports from Russia. Other main import commodities from Russia are metals, machinery and equipment, automobiles, processed food and other manufactured products (Table 6).
Table 6 : Mongolia’s Trade with Russia: Volume and Structure, selected years
(%)
Sector Exports Imports
1997 2007 2011 1997 2007 2011
Total volume*, US$ million 83 58 96 166 745 1,625
Grains, Crops 0.4 0.0 0.3 1.1 4.2 1.6
Animal Products 0.1 0.2 0.0 0.2 0.6 0.5
Wool 0.2 0.5 0.8 0.0 0.0 0.0
Meat 12.8 27.9 0.3 0.1 0.0 0.0
Forestry 0.1 0.0 0.0 1.6 0.0 0.0
Coal 0.0 1.4 0.4 2.0 0.0 0.0
Oil & Gas 0.1 0.5 2.8 43.1 70.7 67
Other Minerals 82.8 53.7 68.7 0.3 0.1 0.2
Processed Food 0.1 0.2 22.9 1.7 4.7 5.2
Textiles & Apparel 0.3 1.6 1.4 1.2 0.1 0.1
Leather Products 1.5 0.2 0.0 0.0 0.0 0.0
Wood & Paper Products 0.1 0.0 0.0 0.7 0.4 0.3
Metals 0.2 1.1 0.1 9.6 3.8 6.4
Automobiles 0.3 7.1 0.6 5.3 2.5 5.6
Machinery & Equipment 0.4 4.8 0.8 17.9 7.0 6.0
Other Manufactured Products 0.7 0.6 0.4 7.9 4.9 5.9
Electricity 0.0 0.1 0.5 7.3 0.8 1.0
Notes: 1. * Data source: Mongolian Statistical Yearbook, various issues;
2. Percentage shares were estimated from Batnasan, N., et al, 2008 (personal communication).
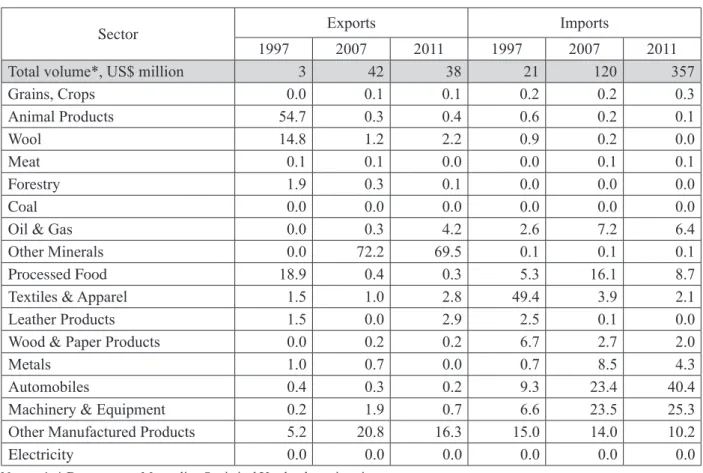
2.4. Mongolia–Japan Trade
Mongolia’s trade with Japan began in 1960 after a protocol on development of trade was signed between the Chamber of Commerce of Mongolia and Japan’s Association on Trade Promotion in 1959. From 1 April 1974, the Government of Japan began to provide preferential treatment on goods exported from Mongolia, and trade turnover between the two countries increased to US$32 million for the period 1981–1985 from US$4 million for the period 1966–
1970 (Galsandorj, D. and Bud, Kh., 2001).
Since the early 1990s, Japan has emerged as Mongolia’s fourth largest trading partner owing to growing imports of automobiles, machinery and equipment and other manufactured products from Japan. The value of automobile imports increased from US$6.4 million in 1997 to US$346 million in 2011, accounting for 70% of total imports from Japan. In addition, imports of machinery and equipment and other manufactured products increased to US$89.5 million and US$29 million in 2011 from US$23 million and US$3 million, respectively. However, Mongolia’s exports to Japan still remain limited in terms of volume and variety. Mongolia’s exports to Japan accounted for only US$11 million in 2011. Although, cashmere and textile apparel predominate within exports, other occasional items, such as coal, and other minerals and metals, could also be predominant in exports (Table 7).
Table 7 : Mongolia’s Trade with Japan: Volume and Structure, selected years
(%)
Sector Exports Imports
1997 2007 2011 1997 2007 2011
Total volume*, US$ million 26 42 11 35 120 493
Grains, Crops 0.0 0.0 0.1 0.3 0.0 0.0
Animal Products 0.0 0.0 0.0 0.0 0.0 0.0
Wool 20.9 24.9 4.6 0.0 0.2 0.0
Meat 0.0 0.7 0.6 0.0 0.0 0.0
Forestry 0.0 0.0 0.0 0.0 0.0 0.0
Coal 0.0 0.0 62.7 0.0 0.0 0.0
Oil & Gas 0.0 0.0 0.0 1.3 0.5 0.1
Other Minerals 42.9 47.7 1.0 0.0 0.0 0.0
Processed Food 0.0 1.2 0.2 0.9 0.5 2.0
Textiles & Apparel 6.1 8.4 19.3 1.3 0.7 0.3
Leather Products 0.2 0.2 0.0 0.0 0.0 0.0
Wood & Paper Products 0.0 0.0 0.2 0.6 0.4 0.3
Metals 21.2 16.0 0.9 3.1 1.1 3.1
Automobiles 0.9 0.0 1.4 18.6 66.6 70.0
Machinery & Equipment 7.3 0.6 7.9 65.9 23.3 18.1
Other Manufactured Products 0.3 0.2 1.1 8.0 6.8 5.9
Electricity 0.0 0.0 0.0 0.0 0.0 0.0
Notes: 1.* Data source: Mongolian Statistical Yearbook, various issues;
2. Percentage shares were estimated from Batnasan, N., et al, 2008 (personal communication).
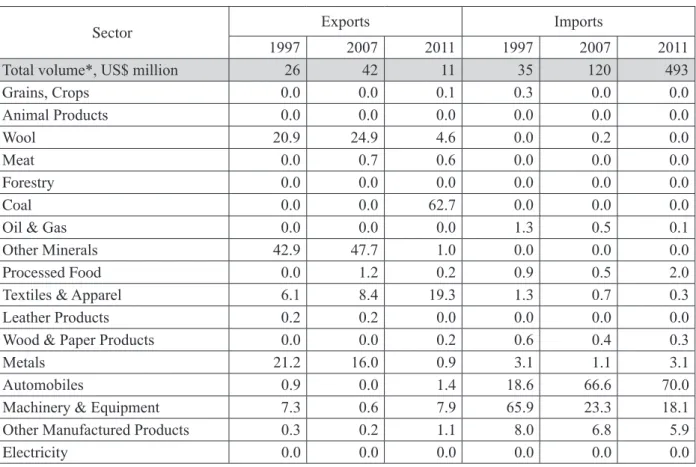
2.5. Mongolia– ROK Trade
An agreement on trade was signed between the two governments on 28 March 1991 and the ROK has emerged as the other largest trading partner of Mongolia since the early 1990s.
Mongolia’s trade turnover with the ROK amounted to US$480 million in 2011, being the fifth largest.
Similar to Japan, Mongolia’s exports to the ROK were characterized by exports of a few irregular items of mining and livestock origin. Exports of molybdenum ore and concentrates accounted for 70% of the total, while those of non-monetary gold were 16% of the total in 2011.
However, Mongolia’s imports from the ROK consist of automobiles, machinery and equipment and a variety of other manufactured goods. In 2011, automobiles accounted for 40% of total imports from the ROK, while the shares of machinery and equipment and other manufactured products were 25.3% and 10.2% of the total, respectively (Table 8).
As pointed out in Nakajima, (2012), “… from the end of the 1990s, the ROK turned around its policy to actively take the initiative, designating FTAs as an important part of trade policy”.
However, talks on an FTA with Mongolia have not been initiated yet.
Table 8 : Mongolia’s Trade with the ROK: Volume and Structure, selected years
(%)
Sector Exports Imports
1997 2007 2011 1997 2007 2011
Total volume*, US$ million 3 42 38 21 120 357
Grains, Crops 0.0 0.1 0.1 0.2 0.2 0.3
Animal Products 54.7 0.3 0.4 0.6 0.2 0.1
Wool 14.8 1.2 2.2 0.9 0.2 0.0
Meat 0.1 0.1 0.0 0.0 0.1 0.1
Forestry 1.9 0.3 0.1 0.0 0.0 0.0
Coal 0.0 0.0 0.0 0.0 0.0 0.0
Oil & Gas 0.0 0.3 4.2 2.6 7.2 6.4
Other Minerals 0.0 72.2 69.5 0.1 0.1 0.1
Processed Food 18.9 0.4 0.3 5.3 16.1 8.7
Textiles & Apparel 1.5 1.0 2.8 49.4 3.9 2.1
Leather Products 1.5 0.0 2.9 2.5 0.1 0.0
Wood & Paper Products 0.0 0.2 0.2 6.7 2.7 2.0
Metals 1.0 0.7 0.0 0.7 8.5 4.3
Automobiles 0.4 0.3 0.2 9.3 23.4 40.4
Machinery & Equipment 0.2 1.9 0.7 6.6 23.5 25.3
Other Manufactured Products 5.2 20.8 16.3 15.0 14.0 10.2
Electricity 0.0 0.0 0.0 0.0 0.0 0.0
Notes: 1. * Data source: Mongolian Statistical Yearbook, various issues;
2. Percentage shares were estimated from Batnasan, N., et al, 2008 (personal communication).
3.Analysis of the Economic Effects of Mongolia’s FTAs
3.1. The Model
In analyzing the expected economic effects of Mongolia’s FTAs with the countries in Northeast Asia we employed the Global Trade Analysis Project (GTAP) Data Base (Version 8) and the standard GTAP Model. Inclusion of Mongolian data in this global database for the first time enabled us to use this model in the analysis.
The GTAP Model is a multi-region and multi-sector Computable General Equilibrium (CGE) model7 with perfect competition and constant returns to scale. Bilateral trade is handled via the Armington assumption. It combines detailed bilateral trade, transport and protection data characterizing economic linkages among regions, together with individual country input–output databases, which account for inter-sectoral linkages.
The GTAP Data Base 8 has dual reference years (2004 and 2007), but we used 2007 as the reference year. The data has 129 regions and 57 commodities, where Mongolia was one of the newly added regions in the Data Base. The GTAP Input–Output Table (IOT) for Mongolia is based on the Mongolian IOT for 2005 which includes 55 sectors (Narayanan, et al, eds., 2012;
Begg, et al, 2012). In consideration of the target countries and Mongolia’s industrial and trade structures, the regions were aggregated into 14 from the 129, and the sectors into 18 from the 57 in the model (Appendix Table I and Appendix Table II).
The composition of the GDP of the countries in question is provided in Table 9. GDP shares of foreign trade activities are the highest for Mongolia among the selected countries, with exports and imports each exceeding 60% of GDP. At the same time, Mongolia’s uniform import tax rate is relatively low at 5%, while those of other countries range between zero for raw materials in all partner countries to 27% for processed food in the ROK (Tables 10 and 11).
Table 9 : Composition of GDP
(%)
Item Trading Partner
Mongolia China Japan ROK Russia
Private Consumption 50.5 37.5 57.1 53.8 51.4
Government Consumption 13.2 40.7 23.1 28.2 22.1
Investment 37.5 14.1 18.0 14.5 18.2
Exports 60.9 36.0 18.1 42.3 29.6
Imports -62.1 -28.3 -16.2 -38.9 -21.4
Total 100 100 100 100 100
Source: GTAP 8 Data Base.
Table 10 : Import Tariff Rates of Mongolia in the Model
(%)
Sector Trading partner
China Japan ROK Russia
Grains, Crops 6.8 4.5 5.4 5.0
Animal Products - - 5.0 -
Wool - - - 5.0
Meat 4.9 - 5.0 4.9
Forestry 5.0 - 5.0 5.0
Coal 5.0 - 5.0 -
Oil & Gas 5.0 5.0 5.0 5.0
Other Minerals 5.0 5.0 5.0 5.0
Processed Food 5.3 6.3 9.8 6.9
Textiles & Apparel 5.0 5.0 5.0 5.0
Leather Products 5.0 5.0 5.0 5.0
Wood & Paper Products 5.0 5.0 5.0 5.0
Metals 5.0 5.0 5.0 5.0
Automobiles 5.0 5.0 5.0 5.0
Machinery & Equipment 4.8 4.9 4.5 4.9
Other Manufactured Products 5.0 5.0 5.0 5.0
Electricity 5.0 - - 5.0
Source: GTAP 8 Data Base.
Table 11 : Import Tariff Rates of Other Regions vis-à-vis Mongolia in the Model
(%)
Sector Trading Partner
China Japan ROK Russia
Grains, Crops 12.4 6.0 1.7 0.0
Animal Products 6.7 0.0 0.0 0.0
Wool 9.1 0.0 0.0 10.3
Meat 7.7 1.6 20.6 14.0
Forestry 0.0 0.0 0.0 4.0
Coal 4.5 0.0 0.0 5.0
Oil & Gas 0.0 0.0 0.0 0.0
Other Minerals 0.0 0.0 0.1 13.4
Processed Food 11.1 12.6 26.5 7.0
Textiles & Apparel 10.7 7.0 9.2 16.0
Leather Products 8.8 7.2 8.3 6.7
Wood & Paper Products 0.6 0.1 4.6 9.7
Metals 1.2 1.5 5.2 9.2
Automobiles 0.0 0.0 8.0 10.2
Machinery & Equipment 7.9 0.0 4.7 7.8
Other Manufactured Products 8.0 0.0 2.9 5.9
Electricity 0.0 0.0 0.0 0.0
Source: GTAP 8 Data Base.
3.2. The Macroeconomic Effects of the FTAs
The simulation results demonstrated that Mongolia’s FTAs with the countries in Northeast Asia—the country’s major trading partners—would have very limited macroeconomic effects on Mongolia. The country’s real GDP increases by just 0.02% when Mongolia has an FTA with Russia, while it decreases by 0.02% in both cases when FTAs are in place with Japan and the ROK. In addition, Mongolia’s FTA with China has almost no effect on Mongolia’s real GDP (Table 12).
In terms of the equivalent variation (EV), which is an indicator for measuring the effect on public welfare, Mongolia’s FTAs with China and Russia bring positive changes to EV, while those with Japan and the ROK saw negative changes similar to the changes in real GDP. That means Mongolia’s consumers would be better off from price decreases resulting from Mongolia’s FTAs with China and Russia. However, the consumers may be worse-off, although at a much lower scale, from the combined consumption realized after FTAs with Japan and the ROK, due to such things as higher prices than before (Table 13).
Improvements in the terms of trade were the major contributor to EV in the FTAs with all the countries, although they were of smaller scale via the FTAs with Japan and the ROK.
Imported tradable commodities demanded by private households was the other most relatively large contributor to EV in the FTAs with Russia, China and the ROK (Table 14).
Table 12 : Mongolia’s Real GDP Changes via the FTAs
Mongolia’s Bilateral FTA Counterpart Real GDP Change, %
China 0.0003
Japan -0.0236
ROK -0.0215
Russia 0.0198
Table 13 : Equivalent Variations (EVs) via the FTAs
(US$ Million) Beneficiary Mongolia’s Bilateral FTA Counterpart
China Japan ROK Russia
Mongolia 16.6 -0.3 -0.2 14.5
China 10.5
Japan 7.3
ROK 13.2
Russia 4.4
Table 14 : Contributions to Mongolia’s EV
( US$ Million)
Item Mongolia’s Bilateral FTA Counterpart
China Japan ROK Russia
Terms of Trade 16.679 0.784 0.695 13.530
Exports of tradable commodities 0.403 0.000 0.062 0.122
Aggregate imports of tradable commodities at
market prices -2.539 -0.924 -1.018 -1.689
Domestic tradable commodity demanded by
government household 0.002 -0.008 -0.008 0.007
Imported tradable commodity demanded by
government household 0.021 0.001 0.002 0.010
Domestic tradable commodity demanded by private
household -0.533 -0.086 -0.269 -0.782
Imported tradable commodity demanded by private
household 1.812 -0.025 0.298 2.619
Non-saving commodity output 0.339 0.009 -0.005 -0.302
Total 16.186 -0.249 -0.243 13.514
These results can be explained by a number of factors that characterize Mongolia’s current economy. First, the amount of Mongolia’s trade with China and Russia is large and greater effects can naturally be expected from FTAs with these countries. Hence the economic effects of Mongolia’s FTAs with China and Russia were much greater than those with Japan and the ROK.
The other factor is the tariff rates of partner countries: where the existing tariffs are high, the economic effects upon their elimination become large. Although the tariff rates of the partner countries range up to 27%, the current tariffs are already zero or very low for most of Mongolia’s
major export commodities. Even though China and Russia have relatively higher tariff rates on imports of livestock-origin products, such as wool, meat, and leather products, etc., the effects of their elimination were insignificant due to the small shares of such items within Mongolia’s exports. On the other hand, the current uniform tariff rate of Mongolia is already relatively low. Therefore its elimination would not result in any significant change in Mongolia’s current imports. Accordingly, at the aggregate level, the economic effects of the FTAs were very small or negligible. These results were similar to the findings of a study by Batnasan, N., et al (2012) on the opportunities and risks for Mongolia of establishing FTAs with its major trading partners.
They stated that the FTAs would not have any solid effect on the country’s GDP growth and the growth rate resulting from the FTAs would not exceed 1%; thus the proposed FTAs will be mostly of “non-trade” content.
3.3. The FTAs’ Effects by Sector
For assessing the FTA effects on the Mongolian economy in more detail, we have looked into some of the simulation results by industrial sector.
The percentage changes of the value-added by sector upon executing the FTAs are provided in Table 15. Despite the small or negligible aggregate effects, as described earlier, there were several positive changes observed for some sectors, such as leather products, textile and apparel, and meat and animal products, especially in the cases of Mongolia–China and Mongolia–Russia FTAs.
The largest growth of value-added was for leather products with a Mongolia–China FTA.
It increased 21.6%, while textiles and apparel went up 9.4%. In addition, the value-added of animal products, and grains and crops increased by 3.5% and 2.2%, respectively. At the same time, export sales of leather products and textile and apparel would grow 24.5% and 13.1%, respectively. The meat sector value-added would expect to see a 3.9% rise with a Mongolia–
Russia FTA, with export sales growing 50.2%. These results were consistent with the fact that China and Russia have relatively higher import tariffs for these products (Tables 15 and 16).
Although the value-added of the processed food dropped in all of the FTAs, except in the case of a Mongolia–Japan FTA, export sales for this sector increased for all of the FTAs, ranging from 1.4% (in the Mongolia–Russia FTA) to 13.6% (in the Mongolia–ROK FTA). Therefore this sector could be one of the most promising non-mining export-oriented sectors for Mongolia upon introduction of the FTAs. Declines in the value-added and labor for this sector can be explained by the fact that Mongolia still imports the greater part of its processed food (Tables 15 and 16).
Another interesting result was observed for the coal sector. The value-added of coal increased by 1.4% in the case of a Mongolia–China FTA, while its export sales went up 4.3%.
This would generate significant export earnings for Mongolia as coal is Mongolia’s top export commodity to China, and it makes up almost half of Mongolia’s total exports (Table 16).
Moreover, these sectors would be potential sources of employment generation in Mongolia.
For example, in the case of a Mongolia–China FTA, the numbers of both skilled and unskilled workers in the leather products sector increased by 21.9% and 21.5%, respectively, while those for the coal sector went up 2.5% for both skilled and unskilled. In addition, the other key manufacturing industries of Mongolia, such as, textiles and apparel, and meat, had positive changes for both skilled and unskilled workers in most of the FTAs, while those for animal products, and grains and crops went up from 2.4% to 3.9% in the case of a Mongolia–China FTA (Tables 17 and 18).
Table 15 : Changes in Mongolia’s Value-Added by Sector
(%)
Sector Mongolia’s Bilateral FTA Counterpart
China Japan ROK Russia
Grains, Crops 2.2 -0.1 -0.2 -1.8
Animal Products 3.5 -0.1 -0.2 -2.1
Wool -0.5 -0.1 -0.3 -5.0
Meat 0.1 0.1 0.2 3.9
Forestry -1.4 0.0 -0.1 -1.6
Coal 1.4 0.0 0.0 -0.4
Oil & Gas -1.2 0.0 0.0 -1.1
Other Minerals -0.6 0.0 0.0 -0.2
Processed Food -2.0 0.3 -0.5 -3.5
Textiles & Apparel 9.4 0.2 0.2 -3.0
Leather Products 21.6 -0.9 -1.4 -10.6
Wood & Paper Products -5.5 -0.2 -0.7 -1.8
Metals -2.0 0.0 0.1 -1.7
Automobiles -4.0 -4.8 -1.9 2.1
Machinery & Equipment -8.5 -1.7 -0.4 5.3
Other Manufactured Products -5.6 -0.3 -0.8 -1.9
Electricity -0.4 -0.1 -0.1 -0.1
Services 0.1 0.0 0.0 0.0
Table 16 : Changes in Mongolia’s Export Sales by Sector
(%)
Sector Mongolia’s Bilateral FTA Counterpart
China Japan ROK Russia
Grains, Crops 49.6 0.0 -0.3 -2.6
Animal Products -1.1 -0.4 -0.4 -4.6
Wool -5.0 -0.4 -0.8 -10.0
Meat -6.0 -1.0 1.4 50.2
Forestry -3.9 -0.2 -0.2 0.2
Coal 4.3 0.1 0.1 -0.7
Oil & Gas 0.3 0.0 0.3 6.5
Other Minerals -0.6 0.0 0.0 -0.2
Processed Food 3.3 7.1 13.6 1.4
Textiles & Apparel 13.1 0.3 0.4 -3.1
Leather Products 24.5 -1.0 -0.8 -11.0
Wood & Paper Products -2.6 -0.2 1.1 -1.4
Metals 0.1 0.0 0.3 -1.2
Automobiles -4.1 -0.1 1.4 24.3
Machinery & Equipment -5.5 -0.2 1.3 16.0
Other Manufactured Products 0.8 -0.1 0.3 0.5
Electricity -6.2 -0.2 -0.3 -4.1
Services -1.9 -0.2 -0.1 -1.5
Table 17 : Changes in Mongolia’s Skilled Labor by Sector
(%)
Sector Mongolia’s Bilateral FTA Counterpart
China Japan ROK Russia
Grains, Crops 2.5 -0.1 -0.2 -1.7
Animal Products 3.9 -0.1 -0.2 -2.0
Wool -0.4 -0.1 -0.3 -5.0
Meat 0.3 0.1 0.2 5.0
Forestry -1.7 0.0 -0.2 -1.9
Coal 2.5 0.0 0.0 -0.7
Oil & Gas -1.9 0.0 0.0 -1.7
Other Minerals -0.6 0.0 0.0 -0.2
Processed Food -2.0 0.3 -0.5 -3.5
Textiles & Apparel 9.4 0.2 0.2 -3.0
Leather Products 21.9 -0.9 -1.3 -10.1
Wood & Paper Products -5.5 -0.2 -0.7 -1.8
Metals -2.1 0.0 0.1 -1.7
Automobiles -4.0 -4.8 -1.9 2.1
Machinery & Equipment -8.2 -1.7 -0.4 6.0
Other Manufactured Products -5.6 -0.3 -0.8 -1.9
Electricity -0.4 -0.1 -0.1 0.0
Services 0.1 0.0 0.0 0.0
Table 18 : Changes in Mongolia’s Unskilled Labor by Sector
(%)
Sector Mongolia’s Bilateral FTA Counterpart
China Japan ROK Russia
Grains, Crops 2.4 -0.1 -0.2 -1.8
Animal Products 3.8 -0.1 -0.2 -2.1
Wool -0.5 -0.1 -0.3 -5.1
Meat 0.2 0.1 0.2 4.6
Forestry -1.7 0.0 -0.2 -2.0
Coal 2.5 0.0 0.0 -0.8
Oil & Gas -2.0 0.0 0.0 -1.8
Other Minerals -0.7 0.0 0.0 -0.3
Processed Food -2.3 0.3 -0.5 -4.1
Textiles & Apparel 9.0 0.2 0.2 -3.6
Leather Products 21.5 -0.9 -1.4 -10.8
Wood & Paper Products -5.8 -0.2 -0.7 -2.4
Metals -2.4 0.0 0.1 -2.4
Automobiles -4.3 -4.8 -1.9 1.4
Machinery & Equipment -8.6 -1.7 -0.4 5.2
Other Manufactured Products -6.0 -0.3 -0.8 -2.6
Electricity -0.7 -0.1 -0.1 -0.7
Services -0.3 0.0 0.0 -0.7