Studies on Pharmacokinetic and Pharmacodynamic Parameters of
Orbifloxacin in Canine Urinary Tract Infections
(
)
Takae SHIMIZU
Contents
Pages
General Introduction 1
Chapter 1 Assessment of urinary pharmacokinetics and pharmacodynamics of orbifloxacin in healthy dogs with ex vivo modeling 1. Introduction 7
2. Materials and Methods 7
3. Results 12
4. Discussion 14
Chapter 2 Determination of minimum biofilm eradication concentrations of orbifloxacin for canine bacterial uropathogens over different treatment periods 1. Introduction 23
2. Materials and Methods 24
3. Results 26
4. Discussion 28
Chapter 3 Mutant prevention concentration of orbifloxacin: Comparison between Escherichia coli, Pseudomonas aeruginosa, and Staphylococcus pseudintermedius of canine origin. 1. Introduction 38
2. Materials and Methods 39
4. Discussion 44
General Conclusion 53
References 57
General Introduction
Urinary tract infections (UTIs) are the infections of kidney, urinary tracts, bladder and urethra, and can cause various urological symptoms, including inappropriate
urination, dysuria, hematuria, stranguria, pollakiuria, and malodorous urine (Smee et al., 2013b). In dogs, as well as humans, UTIs are caused mainly by bacteria, although the other pathogens including fungi, viruses and parasites can also cause the infections (Smee et al., 2013a). Although UTIs may arise from ascending or descending, the most UTIs proceed in an ascending manner by invasion of bacterial flora from
gastrointestinal tract and surrounding skin via the urethra (Smee et al., 2013a).
Escherichia coli is the most common bacterial pathogen associated with UTIs in dogs, followed by Staphylococcus, Proteus, Klebsiella, and Pseudomonas species (Ling et al., 2001; Kroemer et al., 2014; Sycamore et al., 2014; Windahl et al., 2014). The UTIs occur in approximately 14% of dogs in their lifetimes, with variable age of onset (Thompson et al., 2011). Canine UTIs often become refractory because of persistent infection, relapse and reinfection (Seguin et al., 2003). Therefore, the UTIs are one of the most commonly encountered bacterial infections in dogs.
Antimicrobial treatment is required for companion animals with bacterial UTIs (Weese et al., 2011). Amoxicillin and trimethoprim-sulfadiazine are good first-line options for canine UTIs (Weese et al., 2011). On the other hand, fluoroquinolones, as well as third-generation cephalosporins, are representative second-line drugs
(Thompson et al., 2011). The fluoroquinolone drugs exhibit an excellent bactericidal activity against numerous Gram-negative and Gram-positive bacteria by preventing the DNA replication through inhibition of DNA gyrase (topoisomerase II) and
topoisomerase IV (Walker, 2000; Davis et al., 2006). Thus, the usage of
fluoroquinolones is usually considered in antimicrobial treatments for cases with refractory UTIs (Weese et al., 2011). However, a recent study revealed that the rate of fluoroquinolone susceptibility in canine and feline UTI pathogens was lower than that in the pathogens from human (Tsuyuki et al., 2017), because of the spread of
fluoroquinolone-resistant bacteria in companion animals. Such the emergence and increase of fluoroquinolone-resistant bacteria in companion animals are a matter of great concern to not only veterinary medicine but also public health (Guardabassi et al., 2004). Furthermore, biofilm formation, defined as communities of bacteria encased in an extracellular matrix (Richards et al., 2009), contributes to shield bacteria from both antimicrobials and the host immune response (Anderson et al., 2004).
Biofilm-producing pathogens, in addition to antimicrobial-resistant bacteria, are
recognized as one factor of refractory UTIs in dogs, as well as humans (Thompson et al., 2011; Oliveira et al., 2014). Therefore, evidence-based and reasonable use of
antimicrobials, including fluoroquinolones, is required to combat refractory cases of canine UTI.
In clinical practices, the efficacy of antimicrobial drugs, including fluoroquinolones, is predicted based on in vitro results of the antimicrobial susceptibility test using
isolated bacteria (Turnidge et al., 2007). In recent years, however, emphasis has been placed on the importance of combining pharmacokinetic (PK) and pharmacodynamic (PD) data as a basis for predicting potential antimicrobial efficacy in a patient (Boothe et al., 2006). The representative PK parameters of antimicrobial drugs are the maximum plasma drug concentration (Cmax) and the area under the plasma drug concentration
parameter is the minimum inhibitory concentration (MIC) (Mckellar et al., 2003). The PK/PD indices obtained by integrating PK and PD parameters are useful to connect dosage regimens to clinical effects and vice versa (Ahmad et al., 2016). Among PK/PD indices, most commonly associated with fluoroquinolone efficacy are the ratio of Cmax
to MIC (Cmax/MIC) and the ratio of area under the plasma drug concentration versus
time curve to the MIC (AUC/MIC) (Boothe et al., 2006; Ahmad et al., 2016). To predict the antimicrobial efficacy for UTIs, further PK and PD parameters are required to be taken into account. One reason why is that the drug concentration in urine is not necessarily correlated with that in serum (Turnidge et al., 2007). Another reason is that components in urine are greatly different from those in serum and interstitial fluid (Drobot et al., 1996). These reasons evoke the need to investigate urinary PK and PD for optimization of antimicrobial treatment for UTIs. In human medicine, urinary bactericidal titer (UBT) is developed to evaluate urinary PK/PD of antimicrobial drugs. The UBTs are an indicator of bactericidal activity in urine obtained after administration of antimicrobial drugs, and are believed to predict antimicrobial efficacy for UTIs (Hofbauer et al., 1997; Well et al., 1998; Wagenlehner et al., 2009). However, the UBT model has not yet been applied to animals including dogs.
In the fluoroquinolone treatment for UTIs, the following PD parameters are also emphasized: minimum biofilm eradication concentration (MBEC) and mutant
prevention concentration (MPC). The MBEC is the parameter indicating antimicrobial efficacy against biofilm-producing pathogens (Richards et al., 2009). The MBECs are particularly significant for the second-line drugs, such as fluoroquinolones, that used for refractory UTI, including biofilm-related UTIs (Thompson et al., 2011; Weese et al., 2011). On the other hand, the MPC is the minimum antimicrobial agent concentration
that prevents selection of resistant mutants (Blondeau, 2009). Fluoroquinolone resistance is mainly due to the acquisition of point mutations in the quinolone
resistance-determining region (QRDR) of DNA gyrase and topoisomerase IV (Piddock, 1999). Such QRDR mutations are facilitated within the mutant selection window (MSW), defined between MICs and MPCs (Awji et al., 2012; Gebru et al., 2012). The MSW theory is emphasized in fluoroquinolone treatment for several infections
including UTIs (Hansen et al., 2005; Intorre et al., 2007). However, little is known about MPCs and MBECs of veterinary fluoroquinolones for canine UTI pathogens.
Orbifloxacin (OBFX) is a fluoroquinolone that was developed for use in
veterinary medicine, and has achieved a relatively large sales volume (approximately 137 kg in 2011) among fluoroquinolones for companion animals in Japan (National Veterinary Assay Laboratory, 2015). Compared with the other fluoroquinolones, OBFX has high tissue transferability and insusceptibility to metabolism by introducing a cis-3, 5-dimethylpiperazinyl at the 7 position of the quinolone structure (Yamaguchi et al., 1991). Thus, this drugs transfers to high concentrations in the major organs including liver, kidney, lung, muscle, and small intestine, and then is excreted from the kidney without largely metabolized in the body (Hooper et al., 1985; Matsumoto et al., 1997). In Japan, OBFX is indicated for the treatment of various bacterial infections including UTIs, skin infection, and otitis external in companion animals.
The present study was conducted to investigate the new PK/PD parameters (i.e. UBTs, MBECs, and MPCs) of OBFX to establish evidence-based treatment of this drug for canine UTI. In chapter 1, the author evaluated urinary concentration and UBTs of OBFX in urine obtained from dogs administered with the drug to evaluate urinary PK/PD of OBFX in dogs. In chapter 2, the author determined the MBECs of OBFX in
canine UTI pathogens to assess the effect of biofilm formation on efficacy of the drug. In the last chapter, the author clarified differences in the likelihood of emergence of fluoroquinolone-resistant mutants among major bacterial pathogens.
Chapter 1
Assessment of urinary pharmacokinetics and pharmacodynamics of
orbifloxacin in healthy dogs with ex vivo modeling
1. Introduction
Antimicrobial treatment is required for dogs with UTI (Weese et al., 2011). Successful antimicrobial treatment is based on site-specific PK/PD principles (Wagenlehner et al., 2004). In dogs with UTIs, most bacteria are present in the urine within the urinary tract, including the kidneys, ureters, urinary bladder and urethra (Weese et al., 2011). Therefore, drug concentrations and antimicrobial activity in the urine (urinary PK/PD) can indicate the treatment efficacy of antimicrobial drugs (Wagenlehner et al., 2004; Wagenlehner et al., 2009). An ex vivo model has been established in humans to determine UBTs, which can serve as a PK/PD assessment of antimicrobial agents in the urine (Wagenlehner et al., 2009). However, the UBT model has not yet been applied to dogs.
The aim of the present study was to use liquid chromatography-tandem mass spectrometry (LC-MS/MS) to investigate the urinary PK of OBFX in dogs. A further aim was to measure UBTs and related parameters of OBFX against the common UTI pathogens of dogs.
2. Materials and Methods
1) Sampling of urine from dogs administered OBFX
in accordance with the Tottori University Animal Use Committee (approval number: 14 T 18). Six beagle dogs (5 males and 1 female; mean weight, 11.0 ± 1.4 kg) were purchased from Kitayama Labes Co. Ltd., Nagano, Japan. Three dogs were 10 13 years of age; the remaining three dogs were 2 years old (Table 1). Prior to this study, all dogs were confirmed to be clinically healthy based on physical examination, complete blood count, biochemical blood test and urinalysis. A balloon catheter was placed in the urinary bladder of each dog to allow urine collection. Dogs were orally administered OBFX (Victas®, provided by DS Pharma Animal Health Co. Ltd., Osaka, Japan) at a dose of 5 mg/kg body weight, which is the approved dose in the treatment of canine UTIs in Japan. Whole urine was obtained via the catheter at 4, 8, 12, 16, 20 and 24 h after administra
analysis.
2) Measurement of urine OBFX concentration with LC-MS/MS
Reference standard OBFX and lomefloxacin (LMFX) as the internal standard were separately dissolved in acetonitrile and then diluted with ultrapure water. LC-MS/MS was carried out with a Nexera ultra-high-performance liquid chromatograph equipped with an LCMS-8050 triple quadrupole mass spectrometer (Shimadzu Co. Ltd., Kyoto, Japan). An electro-spray ionization source interface operating in positive-ion mode was applied for multiple reaction monitoring. The precursor ion of OBFX and LMFX were represented by peaks at m/z 396.10 and m/z 352.10, respectively. The product ion mass spectrums of OBFX were m/z 352.10 and m/z 295.15, whereas those of LMFX were
m/z 265.10 and m/z 307.90. The interface settings were as follows: nebulizing gas flow, 3 L/min; desolvation line temperature, 250°C; heat block temperature, 400°C; and drying gas flow, 10 L/min. The compounds were separated on a 2-mm internal diameter × 50-mm length,
3-GLC Ltd., Tokyo, Japan). The mobile phase comprised 0.1% formic acid aqueous solution and acetonitrile, and the flow rate was 0.3 mL/min. The injection volume was
5 min, the supernatants were harvested, and then diluted 100-fold with ultrapure water for analysis. The validity of the LS-MS/MS assay was verified, according to the guideline by the US Food and Drug Administration (2001). The area under the time-urine concentration curve during the first 24 h after administration (urinary
AUC0-24) was calculated with the trapezoidal rule. The half-life time (T1/2) in urine was
calculated by linear regression of the semi-logarithmic plot of urine concentration versus the midpoint of the urine collection time.
3) Test organisms
The following 14 bacterial strains from the urine of dogs with UTI were used in this study: E. coli (strains EC1-EC6), P. aeruginosa (strains PA1 and PA2), K. pneumoniae (strains KP1 and KP2), P. mirabilis (strains PM1 and PM2) and S. pseudintermedius
(strains SP1 and SP2). Strains of K. pneumoniae and S. pseudintermedius were kindly provided by Mr. Y. Tsuyuki (Sanritsu Zelkova Veterinary Laboratory); the other strains were selected from the collected isolates (Harada et al., 2012a, 2012b & 2014).
4) Determination of MIC and minimum bactericidal concentration
MICs of OBFX in cation-adjusted Mueller-Hinton broth (CAMHB) against all strains were determined using the broth dilution method, according to the guidelines of the Clinical and Laboratory Standards Institute (CLSI) (2013a). Based on MICs, all strains were categorized as susceptible, intermediate or resistant, according to the MIC breakpoint established by the CLSI (2013b). For quality control, E. coli ATCC 25922, S. aureus ATCC 29213 and P. aeruginosa ATCC 27853 were used. The minimum
bactericidal concentration (MBC) were also determined after MIC determination, and
organisms after incubation for 24 h, according to CLSI guidelines (1999).
5) Determination of UBT, the area under the UBT-versus-time curve and minimum urinary bactericidal concentration
UBTs are corresponding to the maximal dilution titer of urine allowing bactericidal activity, and were determined as described previously (Well et al., 1998). A logarithmic serial two-fold dilution was prepared using a 1:1 mixture of the urine sample obtained at
-free urine obtained prior to drug administration. UBTs were determined using a microdilution test system.
ed dilution. The final
inoculum was about 5 × 10⁵ colony-forming units (CFU)/mL. The plates were incubated at 35°C for 18 h. Then the subcultured urine was transferred to antimicrobial-free agar. The plates were incubated at 35°C overnight. The number of colonies subsequently grown was used to determine the bactericidal endpoint. The UBT was defined as a
no bactericidal activity and a UBT of 1 was assigned when only undiluted urine displayed bactericidal activity. UBTs were transformed into ordinal data and described with reciprocal numbers (Wagenlehner et al., 2009).
The UBT-versus-time curve (AUBT) was calculated as the sum of the products of the reciprocal UBT values and the respective time (h) intervals for each test organism, to easily compare UBT data among the tested strains. The calculation of AUBT values is an approximation considering the time intervals of 4 h and the nonlinear kinetics in urine (Wagenlehner et al., 2009).
The minimum urinary bactericidal concentration (MUBC) for each strain was determined by dividing the antimicrobial concentration in a urine sample by the corresponding UBT (Well et al., 1998).
6) Statistical analysis
UBT, MIC vs. median AUBT, and MBC vs. median MUBC). A P-value of < 0.05 was considered significant for all analyses.
3. Results
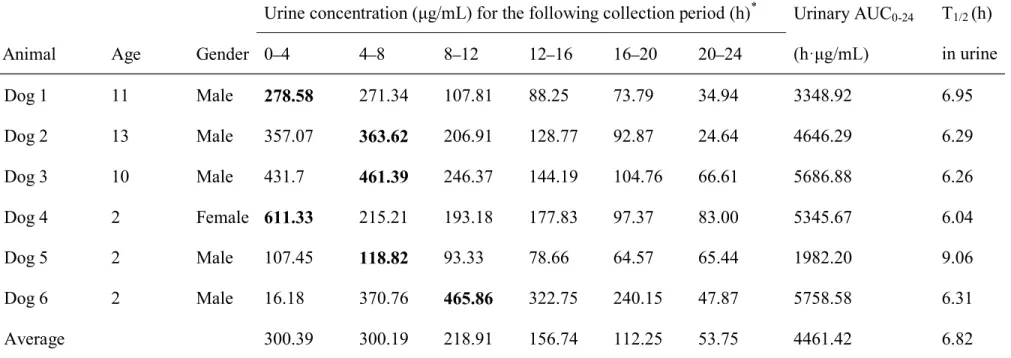
1) Urine concentration
In this study, the LC-MS/MS assay showed lower limit of quantitation at 1 ng/mL for OBFX in dog urine. The temporal changes in urine OBFX concentration in each dog are shown in Table 1. The maximum concentration periods were 0 4 h (n = 2), 4 8 h (n = 3) and 8 12 h (n = 1). The maximum urinary concentration (Umax) and urinary
AUC0-24
5758.58 h µg/mL (4461 ± 1509 h µg/mL), respectively. The T1/2 in urine ranged from
6.04 to 9.06 h (6.82 ± 1.14 h).
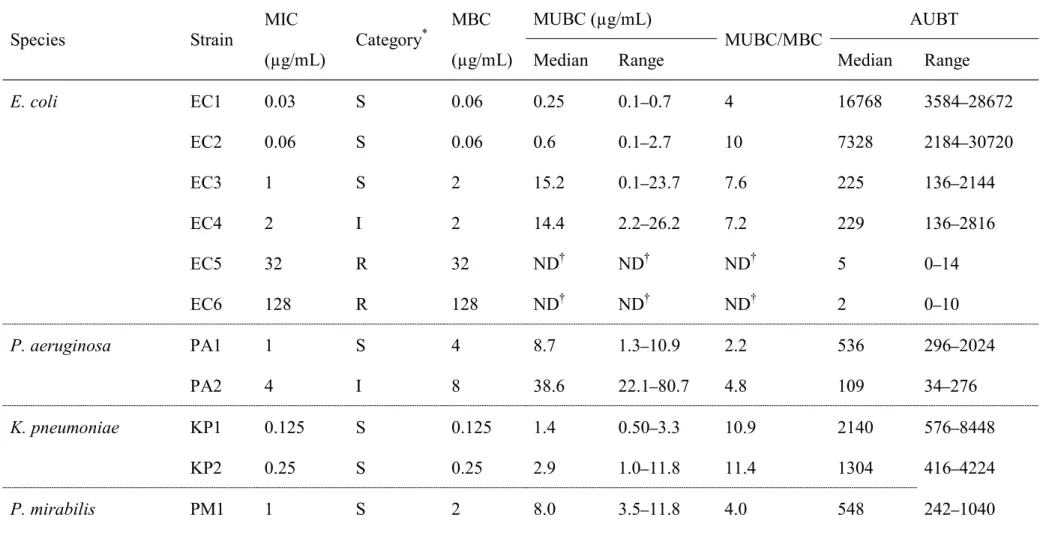
2) MICs and MBCs
Table 2 shows the MICs determined with the broth microdilution method, ranging from 0.03 to 128 µg/mL. Three strains of E. coli were categorized as susceptible, one as intermediate and two as resistant. One strain of P. aeruginosa was categorized as
mirabilis were categorized as susceptible. In addition, one strain of S. pseudintermedius was categorized as susceptible and one as intermediate. The MBCs ranged from 0.06 to 128 µg/mL, one to four times the corresponding MIC for each strain.
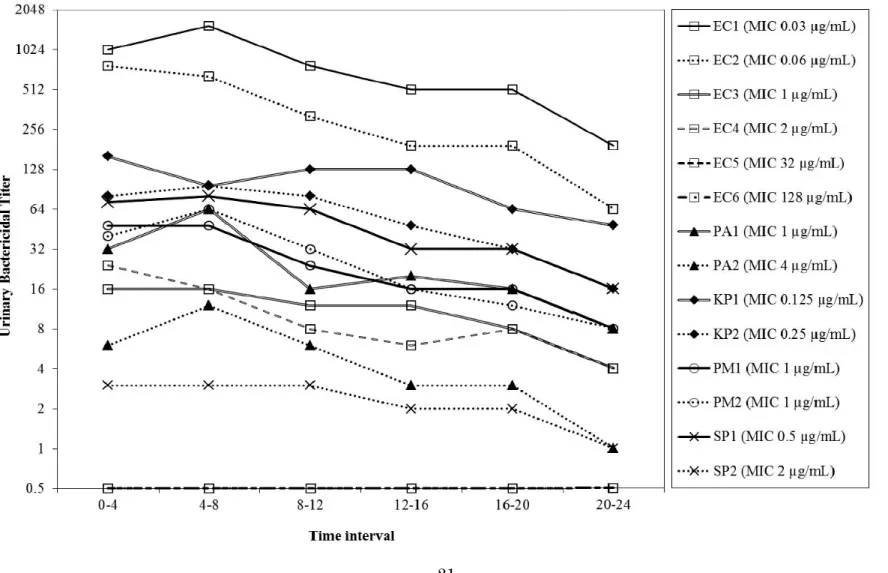
3) UBTs and AUBTs
The temporal changes of median UBTs for each strain are shown in Fig. 1. The median UBTs of OBFX peaked at 0 4 or 4 8 h after administration and then gradually decreased for all strains, except for two resistant strains of E. coli, in which most median UBTs were consistently 0 during the 24 h after administration. The highest median UBTs (range) of OBFX for strains EC1, EC2, EC3 and EC4 were 1536 (256 2048), 768 (4 1024), 16 (8 64) and 24 (1 64), respectively. In the strains other than E. coli, the highest median UBTs (range) for strains PA1, PA2, KP1, KP2, PM1, PM2, SP1 and SP2 were 64 (16 256), 12 (4 32), 160 (4 1024), 96 (16 256), 48 (16 128), 64 (16 64), 80 (1 128) and 3 (1 16), respectively.
Of the tested strains, the highly susceptible (MIC of less than 1 µg/mL) strains (n = 5) had the highest median AUBTs (1045 16,768), followed by less susceptible (MIC of 1 µg/mL) strains (n = 4, 225 652), intermediate (MIC of 2 4 µg/mL) strains (n = 3, 53 229) and resistant (MIC of more than 4 µg/mL) strains (n = 2, 2
P < 0.01).
The median values (ranges) of MUBCs in tested strains are shown in Table 2. In OBFX-susceptible and intermediate strains, the median MUBCs ranged from 0.25 to 59.8 µg/mL. Ratios of median MUBC to corresponding MBC ranged from 2.2 to 15.0,
P < 0.01). In contrast, median MUBCs of OBFX-resistant strains could not be determined because of extremely low UBTs.
4. Discussion
To date, many antimicrobials, including OBFX, have been approved for treating UTIs in dogs. However, little is known about the urinary PK/PD of veterinary antimicrobials. Accumulation of knowledge and better understanding of PK/PD principles is essential to promote evidence-based veterinary medicine. This is the first report to investigate the urinary PK/PD of veterinary drugs in dogs by using LC-MS/MS and an ex vivo model established in humans.
Unlike the maximum drug concentration time (Tmax) in blood, there has been little
investigation of the urinary Tmaxof veterinary antimicrobials in dogs. This study showed
that the urine concentration of OBFX peaked at 0 4, 4 8, or 8 12 h after oral
administration, whereas the serum Tmaxvalue was previously reported to be 1.7 ± 0.2 h
after oral administration (Matsumoto et al., 1997). In addition, T1/2 in urine was
comparable with those in serum after oral administration at dose of 2.5 and 5.0 mg/kg body weight (7.1 and 6.51 h, respectively) (Matsumoto et al., 1997; Heinen, 2002). This study also clarified the extremely high Umax of OBFX, which was over 100 times higher
than the maximum drug concentration in plasma (Cmax
administration at the same dose (Matsumoto et al., 1997). Similarly in the dogs orally administered with enrofloxacin, the Umax of enrofloxacin plus ciprofloxacin reached
over 100 times Cmax (Monlouis et al., 1997). These findings are likely explained by the
fact that both drugs are eliminated mainly by renal excretion (Brown, 1996).Such urinary PK may elucidate that once daily administration of OBFX, as well as enrofloxacin, maintains high concentrations in dog urine up to 24 h.
In the present study, temporal UBTs and AUBTs of OBFX for 12 bacterial strains were determined for six dogs. In all strains except the EC6 strain, the period of
maximum UBTs were 0 4 and/or 4 8 h after administration, similar to the urinary Tmax.
In addition, the median UBTs in susceptible and intermediate strains fluctuated closely with the urine concentration during the same period. Thus, it is likely that the temporal UBTs of OBFX strongly reflect its urinary PK in dogs. In contrast, AUBTs, which reflect the overall UBT values, greatly depended on the respective MIC of each strain. A similar finding was confirmed in a study on the urinary PK/PD of fluoroquinolone drugs in humans (Wagenlehner et al., 2006). Therefore, the UBTs and AUBTs can be parameters to estimate urinary PK/PD of antimicrobials in dogs, as well as in humans. Breakpoints are usually established on the basis that they are relevant at all sites of infection. However, this assumption vastly increases the complexity of breakpoint setting, especially in infections where drug concentrations are substantially different, such as urinary tract infections (Turnidge et al., 2007). The CLSI (2013b) has defined the MIC breakpoint of OBFX for UTI in dogs as
maintained to have bactericidal activity against the susceptible and intermediate strains up to 24 h after oral administration, but not against the resistant strains.
The author found broad interindividual variability in the median UBTs and AUBTs for the same strain, although significant differences in these parameters between ages were not confirmed. Likewise, an approximately 22-fold variation of UBT and AUBT values was confirmed among seven different human patients with UTIs (Wagenlehner et al., 2009). In this study, the interindividual variation in these values might be
explained by the differences in maximum urinary concentration and peak concentration period among individuals. Further studies would be needed to clarify whether such variable urinary PK of OBFX can cause interindividual differences in clinical efficacy.
It is known that fluoroquinolones exhibit lower antimicrobial activity in human urine than in standard microbiological media such as CAMHB (Miyazaki et al., 1996; Well et al., 1998). In the present study, MUBCs were calculated in each test strain based on urine concentration and UBTs to assess the activity of OBFX in dog urine. As a result, the median MUBCs were approximately 2 15-fold higher than the corresponding MBCs. These findings indicate that the antimicrobial activity of OBFX against bacterial species tested in this study decreases in dog urine, and can explain the reason why OBFX in dog urine had no antibacterial activity against the resistant strains in spite of the high drug concentration in urine. In humans, the activity of fluoroquinolones in urine depends on the urine pH, osmotic pressure and the concentrations of various solutes, mainly cations (Naber, 2001; Hofbauer et al., 1997; Drobot et al., 1996). These factors might similarly affect the activity of fluoroquinolones in dog urine; however, verification of this speculation needs further study. At least, such a decrease in
antimicrobial activity in dog urine implies that the urine concentration of antimicrobials does not fully indicate the PD of the drug in urine.
In conclusion, the urinary PK/PD was assessed of OBFX in dogs with LC-MS/MS and an ex vivo model. The fluctuation of UBTs closely correlated with that of urine concentration, and UBT values depended on the susceptibility of the bacterial strains to OBFX. The present data support the reasonableness of the CLSI breakpoint for OBFX for UTIs in dogs when administered at 5 mg/kg once daily. The author strongly believes that the UBTs and the related parameters are important indicators of urinary PK/PD of antimicrobials indicated for UTIs in dogs as well as humans.
Table 1. Urinary AUC0 24 of OBFX after a single oral dose of 5 mg/kg in six healthy dogs.
Urine concentra * Urinary AUC0-24 T1/2 (h)
in urine Animal Age Gender 0 4 4 8 8 12 12 16 16 20 20 24
Dog 1 11 Male 278.58 271.34 107.81 88.25 73.79 34.94 3348.92 6.95 Dog 2 13 Male 357.07 363.62 206.91 128.77 92.87 24.64 4646.29 6.29 Dog 3 10 Male 431.7 461.39 246.37 144.19 104.76 66.61 5686.88 6.26 Dog 4 2 Female 611.33 215.21 193.18 177.83 97.37 83.00 5345.67 6.04 Dog 5 2 Male 107.45 118.82 93.33 78.66 64.57 65.44 1982.20 9.06 Dog 6 2 Male 16.18 370.76 465.86 322.75 240.15 47.87 5758.58 6.31 Average 300.39 300.19 218.91 156.74 112.25 53.75 4461.42 6.82
Table 2. The MIC, MUBC and area under the AUBT of OBFX for the 14 bacterial strains tested in this study. Species Strain MIC (µg/mL) Category * MBC (µg/mL) MUBC (µg/mL) MUBC/MBC AUBT
Median Range Median Range
E. coli EC1 0.03 S 0.06 0.25 0.1 0.7 4 16768 3584 28672 EC2 0.06 S 0.06 0.6 0.1 2.7 10 7328 2184 30720 EC3 1 S 2 15.2 0.1 23.7 7.6 225 136 2144 EC4 2 I 2 14.4 2.2 26.2 7.2 229 136 2816 EC5 32 R 32 ND ND ND 5 0 14 EC6 128 R 128 ND ND ND 2 0 10 P. aeruginosa PA1 1 S 4 8.7 1.3 10.9 2.2 536 296 2024 PA2 4 I 8 38.6 22.1 80.7 4.8 109 34 276 K. pneumoniae KP1 0.125 S 0.125 1.4 0.50 3.3 10.9 2140 576 8448 KP2 0.25 S 0.25 2.9 1.0 11.8 11.4 1304 416 4224 P. mirabilis PM1 1 S 2 8.0 3.5 11.8 4.0 548 242 1040
PM2 1 S 2 6.8 3.2 11.8 3.4 652 272 928
S. pseudintermedius SP1 0.5 S 1 3.4 2.1 29.6 3.4 1045 172 1568
SP2 2 I 4 59.8 27.7 133.7 15.0 53 26 32
*
Strains were categorized as susceptible (S), intermediate (I) or resistant (R), based on CLSI breakpoints for OBFX for UTI in dogs (CLSI, 2013b).
Chapter 2
Determination of minimum biofilm eradication concentrations of
orbifloxacin for canine bacterial uropathogens
1. Introduction
To select antimicrobials that effectively eliminate bacterial biofilms, the
susceptibility of biofilms to various antimicrobial drugs must be measured (Morck et al., 1994). The Calgary biofilm method is a newly developed assay for rapid and
reproducible determination of the MBEC of a drug (Ceri et al., 1999). In general, MBECs are determined following 24 hr of exposure to the antimicrobials, as previously reported (Ceri et al., 1999; Antunes et al., 2010; Naparstek et al, 2014). However, MBECs for extended exposure to antimicrobials need to be investigated to estimate clinical efficacy against canine biofilm-related UTIs because several guidelines recommend at least a 7-day course of antibiotic treatment for this type of infection (Weese et al., 2011; Smee et al., 2013b).
Previous in vitro studies have demonstrated that almost all clinical E. coli and S. pseudintermedius isolates from dogs can produce biofilms (Oliveira et al., 2014; Singh et al., 2013). Likewise, most P. mirabilis, K. pneumoniae, and P. aeruginosa isolates from human patients have been identified as biofilm producers (Shikh-Bardsiri et al., 2013; Seifi et al., 2016; Azimi et al., 2016). It is likely that these bacteria can induce biofilm-related UTIs in dogs; however, MBECs of veterinary antimicrobials against these pathogens remain to be investigated.
The aim of this study was to investigate the MBECs of veterinary OBFX (Cazedey et al., 2013), trimethoprim-sulfamethoxazole (TMS) and amoxicillin/clavulanate (ACV) against uropathogenic E. coli over several different treatment periods. Further, the
author aimed to compare the MBECs of OBFX for common UTI pathogens of dogs.
2. Materials and Methods
1) Tested strains
Thirty bacterial strains were used in this study, including 10 E. coli, five S.
pseudintermedius, five P. aeruginosa, five K. pneumoniae and five P. mirabilis strains. S. pseudintermedius strains obtained from different dogs with UTIs were kindly
provided by Mr. Y. Tsuyuki (Sanritsu Zelkova Veterinary Laboratory, Kanagawa, Japan). Several other strains were randomly selected from the collected isolates (Harada et al., 2012a, 2012b, 2014 & 2016) on the basis of the following criteria: i) isolates obtained from different dogs with UTIs, and ii) fluoroquinolone-susceptible isolates (in the case of E. coli, isolates susceptible to TMS and ACV, in addition to
fluoroquinolones).
2) Determination of MICs
The MICs of OBFX, TMS and ACV for E. coli were determined using a broth microdilution method, according to the guidelines of the CLSI (2013a). The MIC of OBFX was also determined for all other bacteria using the same method.
The MBECs of OBFX, TMS and ACV were determined for E. coli according to a previously described protocol (Melchior et al., 2007), whereas the MBEC of OBFX was determined for all other species. Briefly, a 1.0 McFarland standard suspension of each strain was prepared in tryptic soy broth and then diluted 30-fold in tryptic soy broth. An aliquot (150mL) of each dilution was dispensed into an individual well of a 96-well plate, after which a peg lid (Immuno TSP; Nunc, Roskilde, Denmark) was placed into each well. The plates were incubated for 24 hr at 37°C with shaking (150 rpm) to allow bacterial biofilms to grow on the pegs. Following incubation, several pegs were removed from the lid and the number of bacteria within biofilms on them determined by 10-fold serial dilutions (i.e. 106 107 CFU/peg). The
remaining pegs were dipped for 1 min into the wells of a 96-well plate containing 200 mL of 0.85% saline solution (rinse plate) to remove any loosely adherent planktonic cells from the biofilms. The peg lids were then transferred into the wells of a 96-well plate, each containing 200mL of Mueller-Hinton broth (MHB) supplemented with two-fold-diluted antimicrobial solution (challenge plate). The plates were then incubated at 37°C for 24, 72 or 168 hr. During the incubation period, challenge plates were freshly prepared every 24 hr. Following challenge, the peg lids were washed twice in fresh rinse plates for 1 min each wash, and then placed into a 96-well plate containing 200 mL of MHB per well (recovery plate). The pegs were then
sonicated for 1 hr to disrupt the biofilms and the peg lids discarded. The original microtiter plate lids were replaced, and the plates incubated at 37°C for 24 hr. Following incubation, the lowest concentration of antimicrobial that prevented visible growth of the bacterium was deemed to be the MBEC. Additionally, the MBECs of OBFX for E. coli were determined in dog urine, in addition to MHB. Each experiment was performed three times; the results are shown
as median values.
4) Statistical analysis
The Wilcoxon matched-pairs signed-rank test was used to compare MICs and MBECs, as well as the 24 hr MBECs with the 72 or 168 hr MBECs for each drug and bacterial species. P < 0.05 was considered to denote significance for all analyses.
3. Results
1) OBFX, TMS, and ACV MBECs for canine uropathogenic E. coli
The MICs and MBECs determined following 24, 72, or 168 hr exposure of the 10 E. coli strains to the three tested drugs are presented in Table 3. For OBFX, TMS, and ACV, the 24 hr MBECs (medians: 64 2048, 16/304 >256/4864, and >512/256 g/mL, respectively) were significantly higher than the MICs (P < 0.05), while the 72 hr MBECs (medians: 0.25 64, 4/76 256/4864, and 8/4 128/64 g/mL, respectively) and 168 hr MBECs (medians: 0.25 2, 0.25/4.75 2/38, and 4/2 512/256 g/mL,
respectively) were significantly lower than the 24 hr MBECs (P < 0.05). The median MBECs of OBFX, TMS, and ACV were assessed according to the CLSI guidelines on susceptibility breakpoints for canine UTIs (1, 2/38, and 8/4 g/mL, respectively) (CLSI, 2013b). Most of E. coli strains had susceptible MBECs for all three drugs after 72 and/or 168 hr exposure, with the exception of several strains. For example, after both 72
and 168 hr exposure, the EC1 and EC2 strains had non-susceptible MBECs for ACV and the EC9 strain had non-susceptible MBECs for OBFX. After 72 hr exposure, the majority (8/10) of the strains had MBECs classed as susceptible for OBFX, whereas 0/10 and 3/10 of the strains had susceptible MBECs for TMS and ACV, respectively. After 168 hr exposure, most or all of the strains had susceptible MBECs for all three drugs.
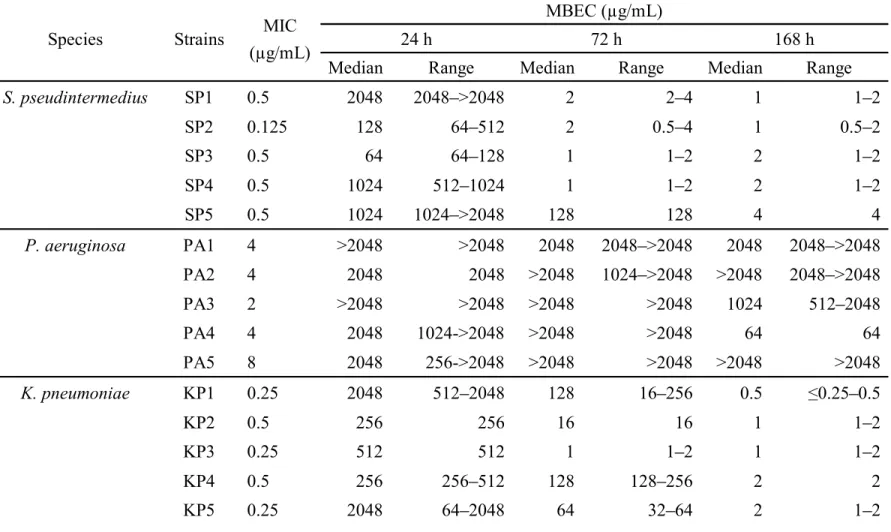
2) OBFX MBECs for other canine uropathogenic bacteria
The MIC and MBEC values of OBFX for the four non- E. coli bacterial species (S. pseudintermedius, P. aeruginosa, K. pneumoniae, and P. mirabilis) are presented in Table 4. Like E. coli, the 24 hr OBFX median MBECs were significantly higher than the MICs (P < 0.05) for each bacterial species. In the three species other than P.
aeruginosa, all strains had low OBFX median MBECs (4 g/mL) after 168 hr exposure, whereas between strain variations were observed in OBFX median MBECs after 72 hr exposure: SP5 strain had a relatively high concentration (128 g/mL) in S.
pseudintermedius, whereas KP3 and PM4 strains had relatively low concentrations (1 and 4 g/mL, respectively) in K. pneumoniae and P. mirabilis, respectively. The 72 and 168 hr OBFX median MBECs for S. pseudintermedius and K. pneumoniae and the 168 hr MBEC for P. mirabilis were significantly lower than the 24 hr MBECs (P < 0.05). In P. aeruginosa, no significant difference was observed between 24 hr MBECs (medians: 32 >2048 g/mL) and 72 hr MBECs (medians: 2048 >2048 g/mL) or 168 hr MBECs (medians: 64 >2048 g/mL; P < 0.05).
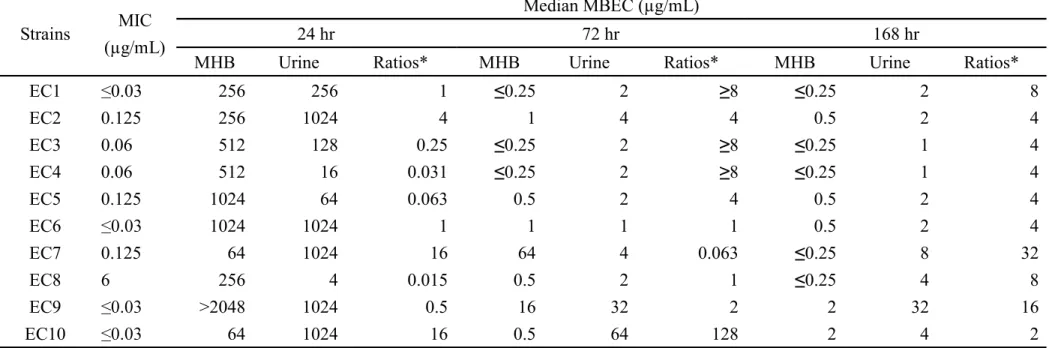
3) Comparison between OBFX MBECs for E. coli in MHB and dog urine
The MBECs of OBFX for E. coli strains in MHB and dog urine were shown in Table 5. In dog urine, as well, as MHB, the 72 and 168 hr MBECs were significantly lower than the 24 hr MBECs (P < 0.05). There were no significant differences in the 72 and 168 hr MBECs between dog urine and MHB, although the 168 hr MBECs in urine were significantly higher than that in MHB (P < 0.05).
4. Discussion
To estimate the clinical efficacy of OBFX, a second-line drug for the treatment of canine UTIs, the author investigated the MBECs of OBFX and other major first-line drugs (TMS and ACV) for uropathogenic canine E. coli strains. The author determined that the 24 hr MBECs of all three drugs were significantly higher than the respective MICs, as previously reported for other veterinary pathogens (Melchior et al., 2007; Olson et al., 2002). Antunes et al. (Antunes et al., 2010) have reported that all strong, moderate and weak biofilm-producing isolates have higher 24 hr MBECs than MICs, whereas the MICs and MBECs of non-biofilm producers were identical in their study. These findings imply that all E. coli strains used in this study are biofilm producers and that the demonstrated resistance to the tested drugs was attributable to biofilm formation. Therefore, 24 hr of treatment with either the first- or second-line drugs tested is unlikely to eradicate biofilm-forming E. coli uropathogens.
The present data also demonstrate that 72 and 168 hr challenge with the tested drugs significantly decreases the MBECs, indicating that longer courses of antibiotics should be used to eradicate biofilm-forming E. coli strains. When compared with CLSI susceptibility breakpoints for canine UTIs (CLSI, 2013b), the 168 hr MBECs of all three drugs were classed as susceptible for the majority of the E. coli strains tested. In contrast, most of the isolates had susceptible MBECs for OBFX after 72 hr, but had resistant MBECs for both TMS and ACV. These data suggest that a 3-day course of OBFX, as well as the standard 7-day course, may be sufficient to eradicate
biofilm-forming E. coli strains. Shorter courses of antibiotics are also preferable in regard to development of resistance (Olofsson et al., 2007). Further clinical trials are needed to determine the appropriate duration of OBFX treatment for biofilm-related UTIs in dogs.
The author determined the MBECs of OBFX for E. coli in dog urine, in addition to MHB. As a result, although the MBECs tended to be higher than the MBECs challenged with OBFX in MHB, there was significantly difference at only 168 hr MBEC. Therefore the MBEC in MHB may be helpful in evaluating the efficacy of OBFX against biofilm formed by E. coli in dog urine.
The 24 hr MBECs against E. coli in urine were higher than the Umax of OBFX.
However the urine MBECs decreased due to prolongation of exposure time and 72 and/or 168 hr MBECs were lower than the urinary concentration similarly the MBECs in MHB. Therefore when biofilm forms in urine, it is not able to eradicate biofilm by 1 day treatment of OBFX. It is considered that 3 or 7 days treatment of OBFX is able to eradicate the biofilm in urine of dogs because the 72 and/or 168 hr MBECs in dog urine
were lower than the urine concentration although the activity to eradicate biofilm in urine is lower than that in MHB.
In this study, the author also investigated the MBECs of OBFX for several other canine uropathogens over different treatment periods. Like E. coli, all S.
pseudintermedius, K. pneumoniae, P. mirabilis and P. aeruginosa strains tested had high 24 hr MBECs for OBFX, implying that all strains are biofilm producers. Exposure to OBFX for 72 and/or 168 hr induced a decrease in the MBECs for S.
pseudintermedius, K. pneumoniae and P. mirabilis, whereas the OBFX MBECs for P. aeruginosa were consistently extremely high for at least 168 hr. The author found that the number of bacteria within biofilm were mostly the same for the various tested bacterial species; thus, it is likely that between-species differences in MBECs are independent of the quantity of biofilm. P. aeruginosa has a remarkable ability to form biofilms, which renders most antimicrobial treatments ineffective (Rasamiravaka et al., 2015). This trait explains these findings, which imply that administration of OBFX alone will have negligible effects on biofilm-forming strains of P. aeruginosa. In recent years, several studies have identified anti-biofilm effects associated with some
antimicrobials (e.g., azithromycin) and other substances (e.g., N-acetylcysteine, cranberry proanthocyanidin and lactoferrin) (El-Feky et al., 2009; Ulrey et al., 2014; Moreau-Marquis et al., 2015; Saini et al., 2015). Further studies are required to establish the efficacy of combination therapies with OBFX and antibiofilm agents against canine UTIs caused by biofilm-forming strains of P. aeruginosa.
In conclusion, the author investigated the MBECs by extended exposure to OBFX, together with TMS and ACV, for E. coli strains, and compared OBFX MBECs among
common bacterial species from dogs with UTI. These data suggest that OBFX is likely to eradicate biofilm-forming E. coli by shorter-term administration course, compared with TMS and ACV, although the three drugs have the similar efficacy under long-term condition. The present study also found the clear differences in OBFX MBECs among common pathogens: 72 and/or 168 h exposure of OBFX can eradicate biofilm-forming isolates of E. coli, S. pseudintermedius, K. pneumoniae and P. mirabilis, but not the strains of P. aeruginosa. In addition, the author demonstrated that biofilm-forming E. coli can be eradicated by long-term exposure of OBFX in dog urine, as well as MHB.
These data indicate that the administration period and bacterial species of uropathogens are important factors affecting the OBFX MBECs, and thus should be considered in the treatment against biofilm-related UTIs in dogs.
Table 3. MBECs of OBFX, TMS, and ACV for 10 uropathogenic E. coli strains from dogs after challenge for 24, 72, or 168h.
Strains Anitimicrobials MIC (µg/mL)
MBEC (µg/mL)
24 h 72 h 168 h
Median Range Median Range Median Range
EC1 OBFX 0.03 256 256 0.25 0.25 0.25 0.25 TMS 256/4864 256/4864 64/1216 64/1216 2/38 2/38 ACV 4/2 >512/256 >512/256 64/32 32/16 >512/256 16/8 8/4 >512/256 EC2 OBFX 0.125 256 128 256 1 0.5 2 0.5 0.25 0.5 TMS >256/4864 >256/4864 4/76 4/76 8/152 0.25/4.75 0.25/4.75 0.5/9.5 ACV 4/2 >512/256 512 >512 32/16 16/8 64/32 16/8 8/4 256/128 EC3 OBFX 0.06 512 256 1024 0.25 0.25 0.5 0.25 0.25 TMS >256/4864 >256/4864 4/76 4/76 8/152 1/19 0.5/9.5 1/19 ACV 4/2 >512/256 128 >512 8/4 8/4 8/4 4/2 16/8 EC4 OBFX 0.06 512 512 0.25 0.25 0.25 0.25 TMS >256/4864 >256/4864 8/152 4/76 16/304 0.25/4.75 0.25 0.5 ACV 4/2 >512/256 >512/256 8/4 4/2 8/4 8/4 4/2 8/4 EC5 OBFX 0.125 1024 512 1024 0.5 0.25 0.5 0.5 0.25 0.5 TMS 0.06/1.14 >256/4864 >256/4864 4/76 2/38 4/76 0.25/4.75 0.25/4.75
ACV 4/2 >512/256 >512/256 32/16 32/16 8/4 8/4 16/8 EC6 OBFX 0.03 1024 512 1024 1 0.5 1 0.5 0.25 0.5 TMS 256/4864 64/1216 256/4864 32/608 32/608 1282432 0.5/9.5 0.5/9.5 ACV 4/2 >512/256 256 >512 128/64 32/16 256/128 4/2 4/2 8/4 EC7 OBFX 0.125 64 32 64 64 64 128 0.25 0.25 TMS 0.06/1.14 16/304 16/304 32/608 8/152 4/76 16/304 0.5/9.5 0.5/9.5 ACV 4/2 >512/256 >512/256 16/8 16/8 32/16 8/4 4/2 8/4 EC8 OBFX 0.06 256 128 256 0.5 0.25 0.5 0.25 0.25 TMS 0.06/1.14 128/2432 128/2432 32/608 8/72 64/1216 0.5/9.5 0.5/9.5 ACV 4/2 >512/256 >512/256 16/8 16/8 32/16 8/4 8/4 EC9 OBFX 0.03 >2048 2048 >2048 16 8 32 2 2 TMS 7 64/1216 32/608 128/2432 16/304 16/304 1/19 0.5/9.5 4/76 ACV 4/2 >512/256 >512/256 16/8 16/8 32/16 8/4 4/2 16/8 EC10 OBFX 0.03 64 64 128 0.5 0.25 2 2 1 2 TMS 128/2432 64/1216 128/2432 256/4864 256/4864 >256/4864 0.25/4.75 .03/0.57 1/19 ACV 2/1 >512/256 >512/256 8/4 4/2 8/4 512/256 512/256 >512/256
Bold faces mean susceptible-level MBECs (median) based on CLSI susceptibility breakpoints for canine urinary tract infections (OBFX, 1 µg/mL 2/38 µg/mL; ACV, 8/4 µg/mL).
Table 4. MBECs of OBFX for 20 bacterial uropathogens other than E. coli from dogs after challenge for 24, 72, or 168 h.
Species Strains MIC (µg/mL)
MBEC (µg/mL)
24 h 72 h 168 h
Median Range Median Range Median Range
S. pseudintermedius SP1 0.5 2048 2048 >2048 2 2 4 1 1 2 SP2 0.125 128 64 512 2 0.5 4 1 0.5 2 SP3 0.5 64 64 128 1 1 2 2 1 2 SP4 0.5 1024 512 1024 1 1 2 2 1 2 SP5 0.5 1024 1024 >2048 128 128 4 4 P. aeruginosa PA1 4 >2048 >2048 2048 2048 >2048 2048 2048 >2048 PA2 4 2048 2048 >2048 1024 >2048 >2048 2048 >2048 PA3 2 >2048 >2048 >2048 >2048 1024 512 2048 PA4 4 2048 1024->2048 >2048 >2048 64 64 PA5 8 2048 256->2048 >2048 >2048 >2048 >2048 K. pneumoniae KP1 0.25 2048 512 2048 128 16 256 0.5 0.25 0.5 KP2 0.5 256 256 16 16 1 1 2 KP3 0.25 512 512 1 1 2 1 1 2 KP4 0.5 256 256 512 128 128 256 2 2 KP5 0.25 2048 64 2048 64 32 64 2 1 2
P. mirabilis PM1 1 2048 2048 2048 2048 2 2 PM2 2 >2048 1024 >2048 2048 2048 >2048 4 2 4
PM3 0.5 >2048 2048 >2048 2048 1024 2048 2 2
PM4 0.5 >2048 2048 >2048 4 4 4 2 16
Table 5. MBECs of OBFX for 10 uropathogenic E. coli strains in MHB and dog urine.
Strains MIC (µg/mL)
Median MBEC (µg/mL)
24 hr 72 hr 168 hr
MHB Urine Ratios* MHB Urine Ratios* MHB Urine Ratios*
EC1 0.03 256 256 1 0.25 2 8 0.25 2 8 EC2 0.125 256 1024 4 1 4 4 0.5 2 4 EC3 0.06 512 128 0.25 0.25 2 8 0.25 1 4 EC4 0.06 512 16 0.031 0.25 2 8 0.25 1 4 EC5 0.125 1024 64 0.063 0.5 2 4 0.5 2 4 EC6 1024 1024 1 1 1 1 0.5 2 4 EC7 0.125 64 1024 16 64 4 0.063 0.25 8 32 EC8 6 256 4 0.015 0.5 2 1 0.25 4 8 EC9 >2048 1024 0.5 16 32 2 2 32 16 EC10 64 1024 16 0.5 64 128 2 4 2
Chapter 3
Mutant prevention concentration of orbifloxacin: Comparison between
Escherichia coli, Pseudomonas aeruginosa, and Staphylococcus
pseudintermedius of canine origin.
1. Introduction
The incidence of canine pathogens showing decreased susceptibility or increased resistance to fluoroquinolones was reported in Japan (Harada et al., 2012a & 2012b; Onuma et al., 2012) as well as worldwide. Determination of the MPC, the antimicrobial concentration that prevents selection of resistant mutants, is important for reduction of the incidence of fluoroquinolone resistance (Blondeau, 2009). It is hypothesised that drug exposure below the MPC may promote selection of resistant strains and the concentration range between the MIC and MPC, which is referred to as the MSW, may enrich and amplify resistant mutants. Thus, MPC and MSW are important parameters for evaluation of the potential for emergence of fluoroquinolone-resistant mutants for antimicrobial-pathogen combinations (Blondeau, 2009). MPCs of fluoroquinolone in canines have been sporadically reported for single pathogens (Gebru et al., 2011 & 2012; Awji et al., 2012). However, a consistent comparison of fluoroquinolone MPCs among different pathogens has not been performed. Gebru et al. (2012) and Awji et al. (2012) found that OBFX MPCs were relatively high compared to those of other veterinary fluoroquinolones, which may be helpful in establishing a comprehensive understanding of the variation of MPCs among different pathogens.
The purpose of the present study is to investigate differences in the likelihood of emergence of fluoroquinolone-resistant mutants among major bacterial pathogens based on MPC determination and to characterize the resistance mechanism of mutants. The author compared the MPCs of OBFX among fluoroquinolone-susceptible E. coli, P. aeruginosa, and S. pseudintermedius strains. Mutants arising after exposure to sub-MPC
concentrations were screened for QRDR mutations and the effects of efflux pump inhibitors (EPIs) on the MICs of OBFX were determined.
2. Materials and Methods
1) Bacterial isolates
Ten fluoroquinolone-susceptible strains each of the following three bacterial
species were used in this study: E. coli (strains E1 E10), P. aeruginosa (strains P1 P10), and S. pseudintermedius (strains S1 S10). E. coli and P. aeruginosa strains were
selected from the collected isolates of urine and ear/skin samples, respectively, obtained from domestic dogs (Harada et al., 2012a & 2012b). S. pseudintermedius strains were isolated from swabs obtained from dogs with canine pyoderma at the Veterinary Medical Teaching Hospital, Nippon Veterinary and Life Sciences University, and at three veterinary hospitals located in Tokyo, Japan. Swabs were streaked onto mannitol salt agar (Eiken Chemical, Japan) and typical colonies were collected. Bacterial identification was carried out by Gram staining, catalase and coagulase tests, and multiplex-polymerase chain reaction (PCR) (Sasaki et al., 2010). All confirmed S. pseudintermedius isolates were store °C in 10% skimmed milk.
2) Determination of MPCs and mutant recovery
MPCs were determined using a previously described protocol (Pasquali et al., 2007) with slight modifications. A concentrated cellular suspension of each bacterial
) containing >1010 CFU/mL was plated onto each of three Mueller-Hinton agar (Becton Dickinson, France) plates, which were supplemented with OBFX at a concentration equal to the MIC and six doubling dilutions higher than the MIC (i.e. 2 ×, 4 ×, 8 ×, 16 ×, 32 ×, and 64 × MIC). Plates were incubated at 37°C for 5 days because preliminary tests showed no significant differences in MPCs between incubations for 2 and 5 days, similarly with the previous report (Pasquali et al., 2007). The lowest drug concentration that prevented the emergence of mutants after the 5-day incubation period was recorded as the MPC. Each experiment was performed twice.
A mutant of each original strain (EM1 EM10, PM1 PM10, and SM1 SM10) was randomly selected from plates with a concentration of OBFX that was one dilution (i.e. twofold) lower than the MPC (sub-MPC). Each mutant was cultured on
antimicrobial-further analysis.
3) Susceptibility testing for OBFX
MICs of OBFX against the original strains and mutants were determined using the agar dilution method, according to the guidelines of the CLSI (CLSI, 2008). MICs of
OBFX were also determined i L of
Phe-Arg- - -Aldrich, MO, USA) for E. coli and P.
aeruginosa L reserpine (Sigma-Aldrich) for S. pseudintermedius. All inoculated agar plates were incubated at 35°C for 16 20 h. E. coli ATCC 25922, P. aeruginosa ATCC27853, S. aureus ATCC29213, and Enterococcus faecalis ATCC29212 were used as quality control strains.
4) PCR amplification and DNA sequencing of QRDRs
The QRDRs of the gyrA and parC genes for E. coli and P. aeruginosa or of the grlA and gyrA genes for S. pseudintermedius in the original strains and in representative mutants of each original strain were amplified by PCR using previously described primers (Akasaka et al., 2001; Lee et al., 2005; Intorre at al., 2007). The amplicons were bidirectionally sequenced using the PCR primers.
5) Statistical analysis
One-way analysis of variance (ANOVA) was used to compare MPCs and
MPC/MIC, Cmax/MPC, and AUC/MPC ratios among the three bacterial species, based
on the results for ten original isolates per species. A Tukey test was used to evaluate differences among the geometric means of these parameters. A Welch test was used for pairwise comparison of MICs. The threshold for significance was set at a value of P < 0.05 in all analyses.
3. Results
1) MICs of original strains and mutants in the presence or absence of EPIs
The results of the study are summarised in Table 6. The MICs of OBFX against the original strains and mutants were 0.063 L and 1 L, respectively, for E.
coli, and 1 L and 16 L, respectively, for P. aeruginosa. Thus, the OBFX MICs against the original strains of P. aeruginosa were significantly increased by drug exposure compared with those of the E. coli original strains (4- to 32-fold vs. 2- to 16-fold, P < 0.05).
For S. pseudintermedius, the MICs of OBFX against the original strains were 0.25 L. After drug exposure, the MICs of the high-susceptible strains (S1 S6) increased 1- to 4-fold, whereas those of the low-susceptible strains (S7 S10) increased 8- to 64-fold. The MICs of OBFX against the mutants of this species were widely distributed (0.5 L).
t the mutants and original strains of E. coli and P. aeruginosa (P < 0.05) by 8- to 32-fold and 32- to 512-fold, respectively. In contrast, the MICs of OBFX against the original strains and mutants of S. pseudintermedius were unaffected by addition of reserpine (P > 0.05). By comparison of the MICs of mutants for all three bacterial species, the decrease in the MIC of OBFX against P. aeruginosa was more pronounced, compared with those for E. coli and S. pseudintermedius (P < 0.05).
2) QRDR mutations in original strains and mutants
Sequence analysis of QRDRs revealed that four low-susceptible original strains (E7 E10; MIC: 0.5 L) and all the mutants of E. coli harboured one point
mutation (Ser-83 to Leu or Asp-87 to Asn) in gyrA. In P. aeruginosa, four strains (PM4, PM7 PM9) harboured one point mutation (Thr-83 to Ile). No mutations were found in the parC gene of E. coli or P. aeruginosa.
In S. pseudintermedius, four low-susceptible original strains (S7 S10; MIC: 1 L) and four mutants (SM6 SM10) harboured one point mutation (i.e. Ser-80 to Ile) in grlA. Of these mutants, three high-level resistant mutants (strains SM7, SM8, and SM10) harboured an additional mutation (i.e. Ser84 to Trp or Leu) in gyrA.
Some original strains (i.e. E10, S2 and S5) gave atypical mutants without significant increases in MICs and an additional QRDR mutation emerged after drug exposure, indicating that these original strains have lower incidence of mutations.
3) MPCs and MPC/MIC ratios
The MPCs and MPC/MIC ratios for the original strains of E. coli were 0.5 32 L and 4 32, respectively. In this species, low-susceptible strains with one QRDR mutation (strains E7 E10) had relatively higher MPCs (8 L), compared with high-susceptible strains (0.5 L). P. aeruginosa exhibited similar MPCs (16 128
64) for all original strains. In S. pseudintermedius, the MPCs (16 L) and MPC/MIC ratios (16 128) in low-susceptible strains (S7 S10) with one QRDR mutation were higher than those in high-susceptible strains without QRDR mutations (S1 S6; MPC: 2 L and MPC/MIC: 4 16).
According to the published PK data of OBFX, the Cmax and AUC of OBFX at a
dose of 7.5 mg/kg are 6.9 mg/L and 42.9 mg.h/L, respectively, were obtained (Walker 2000). Using these data, the Cmax/MPC and AUC/MPC ratios were calculated for E. coli,
P. aeruginosa, and S. pseudintermedius as 0.22 13.8 (Cmax/MPC) and 1.34 85.8
(AUC/MPC), 0.05 0.43 and 0.34 2.68, and 0.05 3.45 and 0.34 21.45, respectively. A comparison among the bacterial species showed that MPC was significantly higher, but
the AUC/MPC and Cmax/MPC ratios were significantly lower, for P. aeruginosa
compared to E. coli (P < 0.05). There were no significant differences in these values between S. pseudintermedius and the other two bacterial species. There were also no significant differences in the MPC/MIC ratios among the three bacterial species.
4. Discussion
Since introduction of the concept of the MPC, there have been numerous reports of MPCs for fluoroquinolones against Gram-positive and Gram-negative bacteria, but no comparisons of MPCs of fluoroquinolones against different bacterial species under the same experimental conditions. Thus, this is the first comparison of the MPCs of fluoroquinolones against canine pathogens, and the first determination of the MPC of OBFX against P. aeruginosa.
These results showed that the MPC of OBFX against P. aeruginosa is higher than that against E. coli. Pasquali et al. (2007) also found that the MPCs of enrofloxacin and ciprofloxacin are higher against P. aeruginosa than against E. coli. Collectively, these results indicate that P. aeruginosa has a tendency to exhibit higher MPCs for various drugs compared with E. coli. In contrast, the OBFX MPCs against S. pseudintermedius did not differ significantly from those of E. coli and P. aeruginosa. This result may be explained by the considerable variation in MPCs among the strains of S.
pseudintermedius. Awji et al. (2012) also found that S. pseudintermedius exhibited a wider range of OBFX MPCs, compared with those for other veterinary
fluoroquinolones. Therefore, the variable MPCs among S. pseudintermedius strains are likely to be due to the type of bacterial species and the susceptibility of the pathogen to
OBFX.
To examine the basis for the differences in MPCs of OBFX among the three bacterial species, the author determined the MICs and fluoroquinolone-resistance
mechanisms in MPC mutants of each species. In this study, high-susceptible strains of E. coli lacking a QRDR mutation and low-susceptible strains with one QRDR mutation were used as original strains. The MICs of OBFX against all mutants were categorised
L) (CLSI, 2008), except for one strain (strain E9), which exhibited a MIC of 8 L. Sequence analysis revealed that all E. coli mutants harboured only one QRDR mutation in the gyrA gene, as also found by Gebru et al. (2011). The two types of gyrA mutations found in the current study (S83L and D87N) are known to cause elevated fluoroquinolone MICs in E. coli (Yoshida et al., 1990; Oram et al., 1991). Generally, MICs of fluoroquinolone against E. coli increase in correspondence to the number of QRDR mutations (Webber et al., 2001), which is the primary mechanism for
fluoroquinolone resistance (Chang et al., 2007). The emergence of only one QRDR mutation in E. coli in this study may be mainly responsible for the failure to acquire OBFX resistance. Similarly, several studies have shown that most E. coli mutants from MPC plates had one or none of QRDR mutations even when parent strains with one gyrA mutation were used (Gebru et al., 2011; Gebru et al., 2012; Pasquali et al., 2007). These findings imply that E. coli rarely acquires two or more QRDR mutations in MPC experiments performed under static conditions. In contrast, all strains of P. aeruginosa exhibited higher OBFX MICs than the CLSI breakpoint and the MICs were
significantly higher than those against E. coli. However, a T83I mutation, which
in fewer mutants of P. aeruginosa, compared with E. coli, and there were no differences in MICs between P. aeruginosa mutants with and without QRDR mutation. These findings suggest that QRDR mutations in P. aeruginosa play an insignificant role in the increased MICs of OBFX against the mutants and increased MPC of OBFX.
MICs of OBFX for P. aeruginosa and E. coli mutants were significantly decreased fect of this EPI was greater on P. aeruginosa strains than on E. coli strains. Pasquali and Manfreda (2007) similarly found that the
more pronounced for P. aeruginosa than for E. coli. The author previously showed that efflux pumps, rather than QRDR mutations, play an important role in the development of fluoroquinolone resistance in P. aeruginosa (Harada et al., 2012a). Differential expression of efflux pumps in E. coli and P. aeruginosa is likely to be the main factor in the variable increases in OBFX MIC values against mutants of E. coli and P. aeruginosa and in OBFX MPCs against these two species.
In S. pseudintermedius, unlike E. coli and P. aeruginosa, OBFX MICs against the mutants and MPCs against the original strains differed markedly based on the
susceptibility of the original strain. Sequence analysis revealed three types of QRDR mutations at codon 80 of grlA and codon 84 of gyrA, which are hotspots for mutations that decrease fluoroquinolone susceptibility in Staphylococcus spp., including S.
pseudintermedius (Onuma et al., 2012; Piddock, 1999). High-susceptible original strains lacking the QRDR mutation yielded relatively low OBFX MICs for mutants, which resulted in relatively low MPCs for original strains. In contrast, low-susceptible strains with one QRDR mutation mostly exhibited an additional QRDR mutation after drug exposure and yielded relatively high MICs for mutants, which resulted in relatively high
MPCs for original strains. For S. pseudintermedius, the relationship between
fluoroquinolone susceptibility of the original strain and the MPC value of OBFX has not been investigated previously. These results imply that fluoroquinolone susceptibility and the status of QRDR mutations in the original strains can greatly affect the MICs of OBFX against mutants and MPC values for original strains. Further studies are needed to explore these findings. Addition of an EPI did not significantly affect the MICs of OBFX against S. pseudintermedius mutants, consistent with the results of Awji et al. (2012). These findings suggest that efflux pumps are not responsible for conferring fluoroquinolone resistance in S. pseudintermedius.
Conversion of in vitro MPCs into clinically useful data requires use of PK/PD parameters of a drug. The Cmax/MPC and AUC/MPC ratios are important predictors for
prevention of the emergence of resistant bacteria. This study obtained these parameters based on published Cmax and AUC values for OBFX in dogs (Walker, 2000) and found
that both Cmax/MPC and AUC/MPC for OBFX were lower in P. aeruginosa than in E.
coli, although the values in these two species did not differ significantly from those of S. pseudintermedius. Olofsson et al. (Olfsson et al., 2006) suggested that an AUC/MPC
gence of a fluoroquinolone-resistant mutant. Thus, these data may imply that appropriate OBFX AUC/MPC ratios cannot be
achieved, especially in low-susceptible strains of E. coli and S. pseudintermedius, and in P. aeruginosa strains. However, the OBFX concentration may be higher at infection sites of these bacteria (i.e. urine and skin) than in serum (Matsumoto et al., 1997; Kay-Mugford et al., 2002). Thus, determination of the in vivo AUC/MPC ratio at each infection site is required to evaluate the practical likelihood of the emergence of fluoroquinolone-resistant mutants.
Based on urinary AUC0 24 of OBFX in dog (Chapter 1), the urinary AUC0 24/MPC
ratios of OBFX for E. coli was 139.42 8922.84, which is higher than the ratio to prevent emergence of fluoroquinolone-resistant mutant (Olfsson et al., 2006). The similar result was also shown in the previous study demonstrating urinary concentration of ciprofloxacin in dogs administrated with enrofloxacin (Daniels et al., 2014).
However, fluoroquinolone-resistant mutants in UTI pathogens from companion animals demonstrated an upward trend (Tsuyuki et al., 2017). One reason why is that urine concentration of veterinary fluoroquinolones increase more slowly, compared with the blood concentrations (Chapter 1), which can contribute to the prolonged transit time in MSW.
In conclusion, the results of this study showed that the MPCs and MPC/MIC ratios of orbifloxacin against E. coli, P. aeruginosa, and S. pseudintermedius are mainly determined by the primary resistance mechanism of each bacterial species. Notably, E. coli and P. aeruginosa, which are representative Gram-negative bacteria frequently encountered in companion animal medicine, yielded markedly different MPCs of orbifloxacin. MPCs were also affected by the susceptibility (high or low) of the original isolate, especially in S. pseudintermedius. Therefore, the type of bacterial species and the fluoroquinolone susceptibility of the pathogen should be taken into consideration when using fluoroquinolone drugs such as orbifloxacin in canines.
Table6. MICs and MPCs of OBFX and QRDR mutations in the gyrA, parC, and grlA genes of the original stains and mutants used in the study.
Parent strains and mutantsa MIC L)
MIC (+EPI)b L)
QRDR mutationc MPC L)
MPC /MIC Cmax /MPCd AUC /MPCd gyrA parC (grlA)
E. coli E1 0.063 <0.015 wt wt 1 16 6.9 42.9 E2 0.063 <0.015 wt wt 0.5 8 13.8 85.8 E3 0.063 <0.015 wt wt 1 16 6.9 42.9 E4 0.125 <0.015 wt wt 2 16 3.45 21.45 E5 0.125 <0.015 wt wt 2 16 3.45 21.45 E6 0.25 <0.015 wt wt 1 4 6.9 42.9 E7 0.5 0.063 S83L wt 16 32 0.43 2.68 E8 1 0.063 D87N wt 8 8 0.86 5.36 E9 2 0.125 D87N wt 8 4 0.86 5.36 E10 2 0.125 S83L wt 32 16 0.22 1.34 EM1 (0.5) 1 0.125 S83L wt - - EM2 (0.25) 1 0.125 S83L wt - - EM3 (0.5) 1 0.125 S83L wt - -
EM4 (1) 2 0.125 S83L wt - - EM5 (1) 2 0.25 S83L wt - - EM6 (0.5) 2 0.125 S83L wt - - EM7 (8) 4 0.125 S83L wt - - EM8 (4) 4 0.25 D87N wt - - EM9 (4) 8 0.25 D87N wt - -EM10 (16) 4 0.125 S83L wt - - P. aeruginosa P1 1 0.015 wt wt 32 32 0.22 1.34 P2 1 0.031 wt wt 16 16 0.43 2.68 P3 1 0.063 wt wt 32 32 0.22 1.34 P4 2 0.125 wt wt 64 32 0.11 0.67 P5 2 0.063 wt wt 32 16 0.22 1.34 P6 2 0.125 wt wt 32 16 0.22 1.34 P7 2 0.031 wt wt 64 16 0.11 0.67 P8 2 0.063 wt wt 128 64 0.05 0.34 P9 4 0.25 wt wt 64 16 0.11 0.67 P10 4 0.125 wt wt 64 16 0.11 0.67 PM1 (16) 32 0.063 wt wt - - PM2 (8) 16 0.25 wt wt - - PM3 (16) 16 0.5 wt wt - -
PM4 (32) 32 1 T83I wt - - PM5 (16) 32 0.25 wt wt - - PM6 (16) 64 0.125 wt wt - - PM7 (32) 64 1 T83I wt - - PM8 (64) 64 0.125 T83I wt - - PM9 (32) 128 2 T83I wt - - PM10 (32) 16 0.25 wt wt - - S. pseudintermedius S1 0.25 0.25 wt wt 2 8 3.45 21.45 S2 0.25 0.5 wt wt 2 4 3.45 21.45 S3 0.25 0.5 wt wt 8 16 0.86 5.36 S4 0.5 0.5 wt wt 2 8 3.45 21.45 S5 0.5 0.5 wt wt 4 8 1.73 10.73 S6 0.5 0.5 wt wt 4 4 1.73 10.73 S7 1 1 wt S80I 128 128 0.05 0.34 S8 1 1 wt S80I 128 128 0.05 0.34 S9 1 1 wt S80I 64 64 0.11 0.67 S10 1 1 wt S80I 16 16 0.43 2.68 SM1 (1) 1 1 wt wt - - SM2 (1) 0.5 0.5 wt wt - - SM3 (4) 1 1 wt wt - -
SM4 (1) 2 1 wt wt - - SM5 (2) 0.5 0.5 wt wt - - SM6 (2) 1 2 wt S80I - - SM7 (64) 64 128 S84W S80I - - SM8 (64) 64 128 S84L S80I - - SM9 (32) 8 8 wt S80I - - SM10 (8) 32 32 S84L S80I - -
a Number in parenthesis indicates the OBFX conce L) supplemented in the agar from which mutants were derived. b MICs in the presence of EPIs
cparC of E. coli and P. aeruginosa, and grlA of S. pseudintermedius; wt, wild type; S83L, Ser-83 to Leu; D87N, Asp-87 to Asn; T83I,
Thr-83 to Ile; S80I, Ser-80 to Ile; S84W, Ser84 to Trp; S84L, Ser84 to Leu.
d Data for maximum concentration (C
max: 6.9 mg/l) and area under the concentration time-curve (AUC: 42.9 mg.h/l) of OBFX (dose of 7.5
General Conclusion
The use of antimicrobial drugs contributes to the health and welfare of companion animals by treating bacterial infections, including UTIs. However, the improper use of antimicrobial drugs may lead not only to the failure of treatments but also to the development of resistant bacteria. Notably, UTIs are the frequently encountered
bacterial infections in companion animal medicine, and thus the improper antimicrobial prescription for UTIs might have a significant negative impact. The PK and PD
parameters are utilized to optimize dose against target pathogens and to assess risk of antimicrobial resistance in the pathogens. In the present study, the author investigated urinary PK/PD parameters, including UBTs, MBECs, and MPCs, against canine uropathogens to promote evidence-based medicine with OBFX, as a representative of veterinary antimicrobial drugs.
In the first chapter, the author assessed the urinary PK and bactericidal activity of OBFX in dogs by LC-MS/MS and an ex vivo modeling to determine UBTs of
antimicrobials. As the result, the author confirmed that OBFX concentration in dog urine is significantly higher than that in dog serum, and closely correlates with the fluctuation of UBTs. On the other hand, the author also found that the bactericidal activity in dog urine depends on OBFX susceptibility of each bacterial strain, and furthermore, is lower than that in standard microbiological media. It is widely believed that the concentration of antimicrobials in infection sites is an indicator of efficacy of antimicrobial treatment. However, the present data indicates that the concentration of OBFX in urine does not directly reflect bactericidal activity of the drug in urine because
of potential factors decreasing the activity in urine. Such effects of property and
components of urine on bactericidal activity should be comprehended for antimicrobial treatment for canine UTIs.
In the second chapter, the author investigated the MBECs of OBFX, along with TMS and ACV, for canine uropathogenic E. coli strains, and compared MBECs of OBFX among common bacterial species to estimate the impact of biofilm formation on antimicrobial treatment for bacterial UTIs. The results of this study indicate that 24h MBECs were significantly higher than respective MICs, regardless of bacterial species and antimicrobial agents. Among the three antimicrobials, OBFX can eradicate
biofilm-forming E. coli more promptly, compared with TMS and ACV. The author also found the clear differences in OBFX MBECs between the uropathogens: extended exposure to OBFX can eradicate biofilm-forming isolates of E. coli, S.
pseudintermedius, K. pneumoniae, and P. mirabilis, but not those of P. aeruginosa. These data suggest that the duration of administration and uropathogenic bacterial species are important factors affecting the MBECs of OBFX. Although unfortunately, the incidence of biofilm-related UTIs in companion animals, as well as humans, remains unknown, the impact of biofilm formation should be taken into account in antimicrobial treatment of biofilm-related UTIs in dogs.
In the last chapter, the author determined the MPCs of OBFX against E. coli, P. aeruginosa, and S. pseudintermedius to obtain the knowledge on prevention of fluoroquinolone-resistant mutants in the treatment for UTIs. The results of this study showed that the primary resistance mechanisms of each bacterial species were differed: QRDR mutations in gyrA and parC in E. coli and S. pseudintermedius, respectively,