Interannual variations in summer temperature on the summit of Mt. Changbai in northeast China
Naoya Wada1* and Qi-Jing Liu2
Abstract
We analyzed interannual variations in summer temperature recorded at the Tianchi meteorological observatory, located near the summit of Mt. Changbai in northeast China during the period from 1959 to 2001. The monthly means of daily maximum temperatures were analyzed with the linear regression model, and showed a significant increasing trend in June during the period from 1959 to 2001.
Monthly means of daily maximum temperatures in July appeared to increase after 1990 and those in September after 1970. Monthly means of daily minimum temperatures in August and September also appeared to increase after 1980.
However, the temperature increases were more obvious in maximum temperatures than in minimum temperatures during this period. Overall, the means of maximum daily summer temperatures have significantly increased at a rate of 0.28ºC per decade.
Keywords: Alpine, Changbaishan, Global warming, Northeast Asia, Temperature
Introduction
With economic development, anthropogenic emissions of carbon dioxide, one of the most prevalent greenhouse gases, have been increasing around the globe (EIA, 2006). East Asia, which includes China and India, is one of the particularly important regions for control of global carbon dioxide emissions because their total primary energy consumption is expected to grow at a higher rate than that in the OECD (Organization for Economic Cooperation and Development) nations (EIA, 2006). In addition to carbon dioxide, air pollutants from East Asia will effectively accelerate global warming because those emitted in East Asia are efficiently transported vertically into the upper troposphere and easily transported by westerly winds to North America and Europe where ozone formed from the air pollutants acts as a greenhouse gas (Wild and Akimoto, 2001). The early signs of climate change already observed in some parts of Asia and elsewhere may become more prominent over a period of 1 or 2 decades (IPCC, 2001b). Thus, East Asia is now facing the dilemna of keeping emissions of fossil fuels at a lower level while simultaneously trying to achieve greater economic development.
1Center for Far Eastern Studies, University of Toyama, 3190 Gofuku, Toyama 930-8555, Japan, and 2Institute of Geographic Sciences and Natural Resources Research, Chinese Academy of Sciences, Beijing 100101, P. R. China.
*E-mail: [email protected]
This study was partially supported by a grant from the Center for Far Eastern Studies, University of Toyama, for Environmental Research Group (2006)
In such a situation, one of the roles scientists could play is that of issuing a stern warning to humanity based on the scientific observation of climate change (IPCC, 2001a). Meteorological monitoring on high mountains is very important and valuable for detecting global climate changes (Diaz and Bradley, 1997) mostly because the impact of human land use that could mask climate-related signals is negligible or of little significance in many alpine regions (Grabherr et al., 2000). In China, significant trends of increasing air temperatures are being observed at several locations of high altitude such as the Tibetan Plateau (Du, 2001) and Mt. Qomolangma (Yang et al., 2006). However, limited information is available from high mountains located in northeast China.
Tianchi meteorological observatory is located at 2623 m above sea level, near the summit of Mt.
Changbai, a middle-latitude mountain in northeast China. The observatory has been recording meteorological data during the summers over a period 40 years from the late 1950’s. In this study, we report interannual variations in summer temperature during the period from 1959 to 2001.
Study site and methods
Figure 1. Tianchi meteorological observatory (indicated by the arrow). The station is located on the gravel plains, at the upper part of the alpine life zone (2623 m a.s.l.), on the northern slope near the summit of Mt. Changbai (photo: 28 June 2006).
Tianchi meteorological observatory is located at the upper level of the alpine life zone (Fig. 1) near the summit of Mt. Changbai, a middle-latitude mountain in northeast China (42º01’N, 128º05E, and 2623 m a.s.l.). Daily maximum and minimum temperatures, precipitation, humidity, and wind speed have been recorded there from 1958. However, due to the harsh living conditions at the site, this data has been recorded only seasonally during the summers from June to September since 1989.
In this paper, data collected in the summers during the period from 1959 to 2001 were used for analysis of interannual variations in monthly means of daily maximum and minimum temperatures for the months from June to September.
Results and discussion
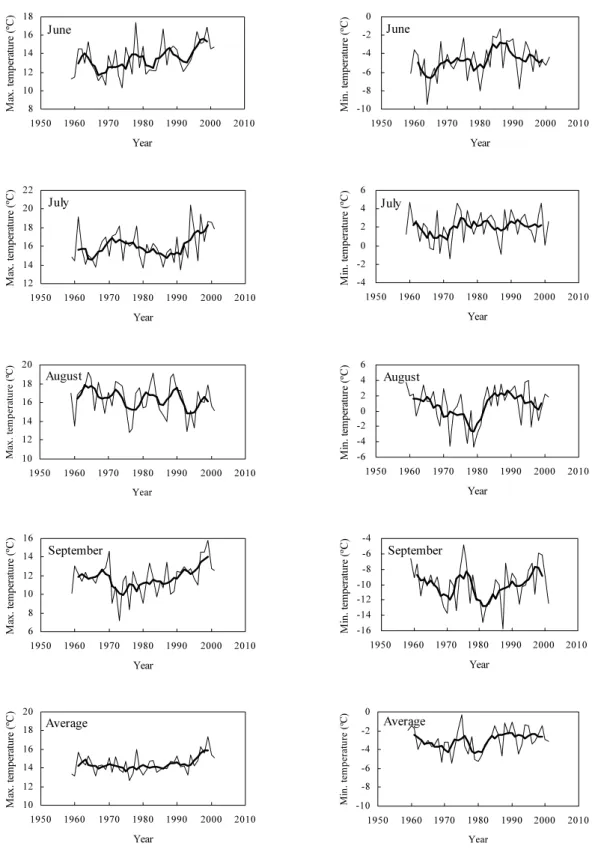
Figure 2 shows interannual variations in monthly means of daily maximum temperatures and daily minimum temperatures in each summer month. Monthly means of daily maximum temperatures for June showed a significant trend of increase during the period from 1959 to 2001, as analyzed by the linear regression model (Table 1). Although the trends of monthly means of daily maximum July temperatures obtained by the linear regression model were not statistically significant, they appeared to increase after 1990, and temperatures in September appeared to increase after 1970 (Fig. 2). Monthly means of daily minimum temperatures in August and September also appeared to increase after 1980 (Fig. 2). However, the trends of temperature increase were more obvious for maximum temperatures than for minimum temperatures during this period (Table 1). Overall, means of daily maximum temperatures in summer have significantly increased at a rate of 0.28ºC per decade (Table 1). We could not answer the question of why increasing rates were higher in maximum temperatures than in minimum temperatures. One of the possible reasons might be related to climate change during daytime in Mt. Changbai: the higher rate of increase in maximum temperatures than that in minimum temperatures might be attributable to increased solar radiation.
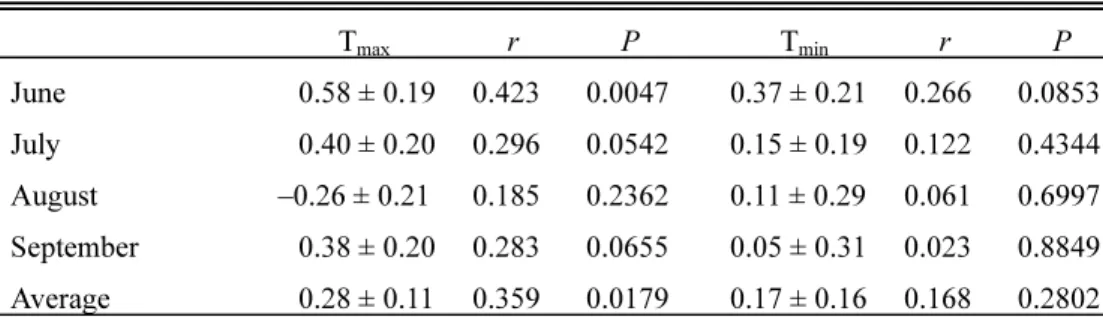
Table. 1. Increasing rates (means ± SE) of daily maximum temperature (Tmax, ºC) and daily minimum temperature (Tmin, ºC) per decade with their respective r and probabilities (P) in each month from 1959 to 2001, as analyzed by the linear regression model. The increasing rate (with standard error) per decade was calculated from the inclination of the regression adjusted per decade for each month.
Tmax r P Tmin r P June 0.58 ± 0.19 0.423 0.0047 0.37 ± 0.21 0.266 0.0853 July 0.40 ± 0.20 0.296 0.0542 0.15 ± 0.19 0.122 0.4344 August –0.26 ± 0.21 0.185 0.2362 0.11 ± 0.29 0.061 0.6997 September 0.38 ± 0.20 0.283 0.0655 0.05 ± 0.31 0.023 0.8849 Average 0.28 ± 0.11 0.359 0.0179 0.17 ± 0.16 0.168 0.2802
The means (from June to August) of daily maximum summer temperatures on the Tibetan Plateau have been reported as increasing at a rate of 0.12ºC per decade during the period from 1961 to 2000 (Du, 2001). On Mt. Changbai, we obtained a rate of 0.24 ± SE0.13ºC per decade when we calculated the linear trend of the summer means of daily maximum temperatures during this season from June to August (r = 0.281, P = 0.0678). Although the mechanism and the reasons are unknown, the higher rate of temperature increases recorded during the summer on Mt. Changbai than that on the Tibetan Plateau is noteworthy.
Figure 2. Interannual variations in monthly summer means of daily maximum air temperature (left figures), and monthly summer means of daily minimum air temperature (right figures) for the 43 years from 1959 to 2001 at Tianchi, Mt.
Changbai. Five-year moving averages are shown as bold lines.
The alpine ecosystem on Mt. Changbai may have been greatly affected by increased temperatures over the past forty years. Particularly important is the fact that the monthly means of daily maximum June temperatures have significantly increased at the highest rate, 0.58 ± 0.19ºC.
8 10 12 14 16 18
1950 1960 1970 1980 1990 2000 2010 Year
Max. temperature (ºC)
June
12 14 16 18 20 22
1950 1960 1970 1980 1990 2000 2010 Year
Max. temperature (ºC)
July
10 12 14 16 18 20
1950 1960 1970 1980 1990 2000 2010 Year
Max. temperature (ºC)
August
6 8 10 12 14 16
1950 1960 1970 1980 1990 2000 2010 Year
Max. temperature (ºC)
September
10 12 14 16 18 20
1950 1960 1970 1980 1990 2000 2010 Year
Max. temperature (ºC)
Average
-10 -8 -6 -4 -2 0
1950 1960 1970 1980 1990 2000 2010 Year
Min. temperature (ºC) June
-4 -2 0 2 4 6
1950 1960 1970 1980 1990 2000 2010 Year
Min. temperature (ºC)
July
-6 -4 -2 0 2 4 6
1950 1960 1970 1980 1990 2000 2010 Year
Min. temperature (ºC) August
-16 -14 -12 -10 -8 -6 -4
1950 1960 1970 1980 1990 2000 2010 Year
Min. temperature (ºC)
September
-10 -8 -6 -4 -2 0
1950 1960 1970 1980 1990 2000 2010 Year
Min. temperature (ºC) Average
Because most alpine plants in Mt. Changbai begin leafing and flowering in June, these phenophases might occur earlier due to increased temperatures, as has been reported in the Swiss Alps (Defila and Clot, 2005). Ecological monitoring of alpine tundra environments, e.g., phenology and vegetation structure, is necessary to assess the effects of global warming on alpine ecosystems.
Results obtained from such monitoring can be used to issue a stern warning to the people of northeast Asia.
References
Defila, C. and Clot, B., 2005. Phytophenological trends in the Swiss Alps, 1951-2002.
Meteorologische Zeitschrift, 14, 191-196.
Diaz, H. and Bradley, R. S., 1997. Temperature variations during the last century at high elevation sites.Climatic Change, 36, 253-279.
Du, J., 2001. Change of temperature in Tibetan Plateau from 1961-2000. Acta Geographica Sinica, 56, 690-698 (in Chinese with English abstract).
EIA: Energy Information Administration, 2006. International Energy Outlook 2006.
http://www.eia.doe.gov/oiaf/ieo/index.html.
Grabherr, G., Gottfried, M. and Pauli, H., 2000. GLORIA: A Global Observation Research Initiative in Alpine Environments. Mountain Research and Development, 20, 190-191.
IPCC: Intergovernmental Panel on Climate Change, 2001a. Climate Change 2001: The Scientific Basis. Cambridge: Cambridge University Press.
IPCC: Intergovernmental Panel on Climate Change, 2001b. Climate Change 2001: Impacts, Adaptation, and Vulnerability. Cambridge: Cambridge University Press.
Wild, O. and Akimoto, H., 2001. Intercontinental transport of ozone and its precursors in a three-dimensional global CTM. Journal of Geophysical Research, 106 (D21), 27,729-27,744.
Yang, X., Zhang, Y., Zhang, W., Yan, Y., Wang, Z., Ding, M. and Chu, D., 2006. Climate change in Mt. Qomolangma region since 1971. Journal of Geographical Sciences, 16, 326-336 (in Chinese with English abstract).
Received 28 November 2006; accepted 9 March 2007