SHIBAURA INSTITUTE OF TECHNOLOGY
Study on Object Detection using
Computer Vision by Artificial Neural
Network
by
Jittima Varagul
A dissertation submitted in partial fulfillment for the degree of Doctor of Philosophy
in the
To my parents who give me unwavering love and always believe
in me.
To Varagul family for always encouraging me in all of my
pursuits to follow my dreams.
To my friends for listening, offering me advice, and supporting
me in everything I do.
To teachers who kindly advise and motivate me to accomplish
my goal and fulfill my dream. . .. . .
Acknowledgements
Though only my name appears on the cover of this dissertation, many great people have supported to the contribution until this dissertation has been succeeded. I would like to express my sincere gratitude to all people who has made this disser-tation possible and because of whom my graduate experience has been one that I will cherish forever.
I have gained a professional experience and valuable lifeskills during my time at Shibaura Institute of Technology (SIT) and the experience opened my eyes to other possibilities. Definitely, this dissertation would not have been accomplished with-out the scholarship of Shibaura Institute of Technology and Japanese Government (Monbukagakusho or MEXT) Scholarship.
My deepest gratitude is to my supervisor, Prof. Toshio Ito. He has been warmly welcome and supported me since the first day I attended his laboratory. I have been amazingly fortunate to have a supervisor who gave me the freedom to learn and researched, and always helped me when I faced trouble. His enthusiasm and immense knowledge have been an inspiration and motivation to me. He has made me believe that if I try hard enough I can achieve whatever I want in life. In the future, I would follow his step and become a good supervisor to my students as he has shown to me.
I would like to extend my gratitude to my dissertation committees: Prof. Hiroyuki Arai, Prof. Masanobu Takahashi, Prof. Hiroshi Hasegawa, and Assoc. Prof. Toshiya Hirose, for precious comments, including the questions which intended me to widen my research from various perspectives. I am gratefully indebted to them for their very valuable comments on this dissertation.
Dozens of people have helped and encouraged me immensely. I am grate-ful to SIT friends and my friends in Suranaree University of Technology for their encouragement, many supports, and for all the great time we have had.
throughout my years of study and through the process of researching and writing this thesis. This accomplishment would not have been possible without them. Thank you very much.
SHIBAURA INSTITUTE OF TECHNOLOGY
Abstract
Graduate School of Engineering and Science Division of Functional Control System
Doctor of Philosophy by Jittima Varagul
A collision avoidance system, which is an automobile safety system designed to reduce the severity of a collision, namely to detect objects and obstacle avoidance. In the actual vehicle driving situation on the road, it is desirable to be able to recognize the preceding obstacles. In order to prevent a collision of the vehicles and the obstacles - of which we do not know the exact shape, size or color- it uses various sensors to detect the obstacles, such as optical sensors, RADAR, SONAR, LIDAR, and camera. The camera is a master of classification and texture interpretation, which has the lowest price. As a result, The author would like to reduce the cost of the detector and improve the performance of the vehicle by making the vehicle has the ability to see and recognize the obstacles like human beings by computer vision system.
recogni-The main objectives of this research is to study on object detection using computer vision by ANN as well as to design algorithm to feature extraction, object recognition and classification, from the actual video images taken by an on-board camera. Due to this, TDNN was used in object classification and detection, where TDNN has the potential to work on sequential data.
In this dissertation, the author proposes a novel general object detection sys-tem by computer vision with ANN, which only one camera is used. Whereas the previous work, stereo vision is widely used in advanced driver assistance systems (ADAS). This is to reduce the number of cameras, but still be able to detect ob-jects. To obtain the effective object detection, the author also introduce several systems: object analysis, feature extraction and identification based on histogram of oriented gradients (HOG) descriptor, object classification, and TDNN. After their processes were completed, this system can effectively detect general objects, which can classify the obstacles that are real obstacles or fake obstacles.
All systems had been tested and presented results, including new findings. The results showed that the performance of each system proposed in this dissertation was highly effective. It can detect general objects, and is not restricted to vehicles, objects or pedestrians - which most of the previous work was to detect specific types of objects such as pedestrians, cars, trucks, etc. It has provided good results along with high accuracy and reliability. Therefore, this system can be applied to provide a warning to the driver when there is an imminent collision in order to prevent an accident and reduce the severity of a collision.
Contents
Acknowledgements v
Abstract vii
List of Figures xiii
List of Tables xvii
Abbreviations xix
1 Introduction 1
1.1 Background . . . 1
1.2 Object Detection by Computer Vision with Artificial Neural Networks 5 1.3 Problem Statement . . . 5
1.4 Objectives . . . 7
1.5 Outline of the dissertation . . . 7
1.6 Novelty of the Study . . . 9
1.7 Scope of study . . . 9
1.8 Structure of This Dissertation . . . 10
2 Related works 13 2.1 Object feature extraction method . . . 14
2.2 Object detection with Artificial Neural Networks (ANN) . . . 17
3 Object-types analysis 19 3.1 Background . . . 20
Contents
3.1.2 The object detection for electric senior vehicle in a senior car
lane . . . 21
3.1.3 The object detection for vehicle in traffic . . . 23
3.2 Object feature analysis . . . 24
3.3 Discussion . . . 26
4 Object feature extraction 31 4.1 Background . . . 31
4.2 Methodology . . . 32
4.2.1 Pre-processing . . . 37
4.2.2 Feature extraction . . . 37
4.3 Experiment and results . . . 38
4.3.1 Pre-processing . . . 39
4.3.2 The object edge feature extraction (METHOD 1) . . . 40
4.3.2.1 Object edge feature extraction for simple shape . . 41
4.3.2.2 Object edge feature extraction for complex shape . 44 4.3.3 The extraction of the difference of the edge orientation in each frame (METHOD 2) . . . 45
4.3.4 The shape variation ratio (METHOD 3) . . . 47
4.4 Discussion . . . 50
4.5 Conclusions . . . 51
5 Object classification 53 5.1 Background . . . 54
5.2 Methodology . . . 55
5.2.1 Multi-Layer Feed-forward Artificial Neural Network . . . 56
5.2.2 Time Delay Neural Network . . . 58
5.2.3 Experiment and results . . . 60
5.2.3.1 Preparation of input for object classification . . . . 60
5.2.3.2 The experiment configuration . . . 62
5.2.3.3 The result of the experiments . . . 68
5.3 Discussion . . . 71
5.4 Conclusions . . . 72
6 Object detection system 75 6.1 Background . . . 75
6.2 Methodology . . . 76
6.2.1 Pre-processing . . . 77
6.2.2 Feature extraction . . . 77
6.2.2.1 Object recognition and classification . . . 78
Contents
6.2.2.2 Object detection . . . 80
7 Experiment and Evaluation 83 7.1 Experimental design for object detection . . . 84
7.2 Experimental procedure . . . 86
7.2.1 Experimental results and evaluation . . . 87
7.2.2 Discussion . . . 91
8 Conclusions and Future Works 95 8.1 Conclusions . . . 95
8.2 Future works . . . 99
A List of Publications 101 A.1 International Journal Papers . . . 101
A.2 International Conference Papers (Peer-reviewed) . . . 101
List of Figures
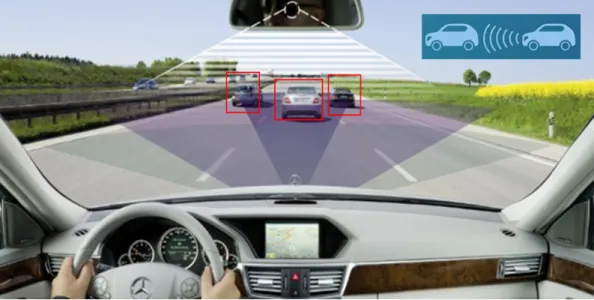
1.1 Preview object detection system for a collision avoidance system . . 3 1.2 Properties of object detection sensor: (a) demonstrates the sensing
area of each sensor and the distance used to control the safety function of autonomous car, (b) demonstrates sensing technology comparison 4 1.3 The moving objects on the road . . . 6 1.4 The fake obstacles . . . 6 1.5 Preview image of the camera perspective . . . 6 1.6 Preview image from the front view by an orthographic projection . . 7 1.7 Content structure of this dissertation . . . 11 3.1 Automated Guided Vehicle (AGV) . . . 21 3.2 The obstacle images in factory environment (indoor scene): (a) real
obstacle; (b) fake obstacle . . . 21 3.3 Changes in the Japan Population Pyramid, Source: Statistics Bureau,
MIC; Ministry of Health, Labour and Welfare . . . 22 3.4 Preview of electric senior vehicle usage . . . 23 3.5 The obstacle images on the sidewalk and a bike lane: (a) real obstacle;
(b) fake obstacle . . . 23 3.6 The obstacle images on traffic: (a) real obstacle; (b) fake obstacle . 24 3.7 Preview image of the camera perspective at various distances . . . . 25 3.8 A 2D construction of perspective viewing, showing the formation of
a vanishing point . . . 26 3.9 The examples of the edge detection: (a) the edge detection of the high
objects; (b) the edge detection of the non-high objects . . . 27 3.10 A comparison of changes in the shape of an object at different
dis-tances; (a) the high object; (b) the non-high object . . . 28 4.1 The structure of cell division: (a) R-HOG type; (b) C-HOG type; (c)
List of Figures
4.3 Pre-processing Flow Chart . . . 37
4.4 The HOG method flowchart . . . 38
4.5 Example of samples of various obstacle: (a) the sample of real obsta-cles; (b) the sample of fake obstacles . . . 39
4.6 The edge detection of the object: (a) high object, (b) non-high object 40 4.7 The effect the cell size parameter has on the amount of shape data encoded in the feature vector for simple shape . . . 42
4.8 HOG feature visualization for simple shape: (a) high object; (b) non-high object . . . 43
4.9 Illustration of a comparison of the orientation of gradient values from HOG feature between high object and non-high object for simple shape . . . 43
4.10 The effect the cell size parameter has on the amount of shape data encoded in the feature vector for complex shape . . . 44
4.11 HOG feature visualization for complex shape: (a) high object; (b) non-high object . . . 45
4.12 Illustration of a comparison of the orientation of gradient values from HOG feature between high object and non-high object for complex shape . . . 46
4.13 The result of the extraction of the difference of the edge orientation in each frame: (a) comparison of HOG feature of high object; (b) comparison of HOG feature of non-high object; (c) comparison of square error of HOG feature in different time . . . 48
4.14 The result of comparison of the shape variation ratio (a) object seg-mentation by active contour; (b) shape variation ratio of the obstacles . . . 49
5.1 The example, the following four-layer neural network has two hidden layers . . . 56
5.2 A neuron in artificial neural network . . . 57
5.3 Supervised learning with back-propagation flow chart . . . 58
5.4 Overall architecture of the TDNN . . . 59
5.5 Single TDNN with M inputs and N delays for each input at time t. Ddi are the registers that store the values of delayed input Ii(t − d) . 60 5.6 The sample images into training and test subsets. . . 61
5.7 The number of hidden neurons visualization plot for MLFANN train-ing; (a) the experiment for AGV; (b) the experiment for electric senior vehicle; (b) the experiment for vehicle in traffic . . . 63
5.8 The number of hidden neurons visualization plot for TDNN training; (a) the experiment for AGV; (b) the experiment for electric senior vehicle; (b) the experiment for vehicle in traffic . . . 64
List of Figures
5.9 The number of inputs visualization plot for MLFANN training; (a) the experiment for AGV; (b) the experiment for electric senior vehicle;
(b) the experiment for vehicle in traffic . . . 65
5.10 The number of set of inputs visualization plot for TDNN training; (a) the experiment for AGV; (b) the experiment for electric senior vehicle; (b) the experiment for vehicle in traffic . . . 66
5.11 The MLFANN training and validation by learning HOG feature (input length for simple shape is 4356, 34596 for complex shape) . . . 67
5.12 The TDNN training and validation . . . 68
5.13 The accuracy of object classification of all experiment . . . 70
5.14 Illustration of %errors of all experiment; (a) the experiment for elec-tric senior vehicle; (b) the experiment for vehicle in traffic . . . 71
6.1 Illustration of Image set for object recognition and classification . . 77
6.2 The process of HOG method . . . 79
6.3 The design of the object recognition and classification by TDNN . . 80
6.4 The process of object detection by MLFANN . . . 81
6.5 The process of object detection by TDNN . . . 82
6.6 The ROI to detect the obstacles . . . 82
7.1 An overview of the experiment procedure . . . 86
7.2 The accuracy of object detection of all experiment . . . 89
7.3 Illustration of %errors of all object detection experiment; (a) the ex-periment for electric senior vehicle; (b) the exex-periment for vehicle in traffic . . . 90
7.4 The accuracy at different speed of vehicle in traffic . . . 91
7.5 The result of object detection testing in nighttime; (a) the obstacle detected; (b) The detection miss an obstacle . . . 93 7.6 The result of object detection testing by using actual video images;
List of Tables
5.1 Settings of my object classification experiments . . . 61
5.2 The number of epoch and training time of object classification exper-iments . . . 69
5.3 The result of the object classification experiments . . . 69
7.1 Settings of my object detection experiments . . . 85
7.2 The result of the object detection experiments . . . 88
Abbreviations
Abbreviations
ADAS Advanced Driver Assistance Systems AGV Automated Guide Vehicle
ANN Artificial Neural Network
BRISK Binary Robust Invariant Scalable Keypoints CNN Convolutional Neural Networks
FREAK Fast Retina Keypoint
HOG Histogram of Oriented Gradients K-NN k nearest neighbor
LIDAR Light Detection and Ranging
MLF-ANN Multi-Layer Feed-forward Artificial Neural Network MLFANN Multi-Layer Feed-forward Artificial Neural Network MLP Multi-Layer Perceptrons
RADAR Radio Detection and Ranging RBF radial basis function
ROI Region of Interest
Chapter 1
Introduction
The aim of this chapter is to introduce background information, existing prob-lem and research objective that lead to comprehend an importance of this disser-tation, which entitled Study on object detection using computer vision by artificial neural network. The proposed solution and research methodology will be presented in this chapter. Finally, describe a structure of this dissertation.
1.1
Background
Chapter 1. Introduction
Stereo vision is widely used in applications ADAS and robot navigation [6, 8] where stereo vision is used to estimate the actual distance or range of objects of interest from the camera. A stereo camera pair must have two identical cameras rigidly mounted so that they will not move with respect to each other. The two cameras on the front of vehicle take pictures of the same object with difference view. These two images contain some encrypted information about the depth of the object[28]. This information is the third dimension of the two images. Therefore the image distance and its depth can be determined by using the stereo cameras.
However, the aim of this dissertation is to reduce the number of cameras but still be able to detect objects, which one camera is used. Thus, I proposed the method of detecting objects using only one camera.
Object detection plays a major role which results in reducing the accidents. In the actual vehicle driving situation on the road, it is desirable to be able to recognize the preceding obstacles. In order to prevent a collision of the vehicles and the obstacles - of which we do not know the exact shape, size or color - it uses various sensors to detect the obstacles, such as optical sensors, radio detection and ranging (RADAR) [63], sound navigation and ranging (SONAR) [32, 38], light detection and ranging (LIDAR) [12], camera 4, and laser sensor. After the detection is done, these systems either provide a warning to the driver such as a flashing dashboard icon, a beep, a tug from the seat belt or braking autonomously without any driver input when a collision is imminent as show in Figure 1.1. However, every detection sensor has both advantages and disadvantages [42] as show in Figure 1.2(b).
The radar sensor system uses radio waves to determine the velocity, range and angle of an object. Radars can operate under all practical driving conditions such as rain, snow or fog. However, radar sensors suitable for the detection of large objects such as vehicles, may not suit small or narrow objects such as a pedestrian. In addition, the cost of the radar sensor is higher than a camera.
The lidar that measures distance using emitted light with high accuracy, which will work in every condition. Moreover, the minimum target size of lidar is a 1” square or larger. Therefore, it can detect objects of various sizes such as vehicles,
Chapter 1. Introduction
Figure 1.1: Preview object detection system for a collision avoidance system
motorcycles or bicycles. Nonetheless, due to lidar using light to detect objects, problems may arise when light is reflected from dark objects such as a black object, and they are still quite expensive.
The camera is a master of classification and texture interpretation, which has the cheapest and most widely available sensors of all three sensor types. Nowadays, price cameras with very high resolution are available. Furthermore, even a low-price camera has a resolution higher than lidar. It can detect every object, shape, size, and color. Therefore, it is able to understand things that cant be learned from lower-resolution lidar and radar.
Figure 1.2(a) demonstrates the sensing area of each sensor and the distance used to control the safety function of autonomous car, which the camera can be used to detect obstacles in a wide range. Besides, Figure 1.2(b) demonstrates sensing technology comparison-the key point and interesting is that the camera has the lowest cost.
Chapter 1. Introduction
Figure 1.2: Properties of object detection sensor: (a) demonstrates the sens-ing area of each sensor and the distance used to control the safety function of
autonomous car, (b) demonstrates sensing technology comparison
Chapter 1. Introduction
1.2
Object Detection by Computer Vision with
Artifi-cial Neural Networks
Currently, computer vision, either alone or combine with other technologies whether it be sonar, radar, or lidar, is one of the key technologies of advanced driver assistance systems (ADAS). Many studies have been developed using com-puter vision with Artificial Neural Network (ANN) applied to obstacles recognition and classification. For example, Karthik B, et al. [29] proposed a computer vision system with neural networks to identify the traffic sign by using HOG based SVMs to extract feature of traffic sign. Then, the neural networks are used to train the traffic sign pattern and classify the 16 different traffic sign image. The result showed that 98 percent accuracy has been achieved, which it is high efficiency. Further-more, also many work use computer vision with an ANN for the object recognition and classification such as the vehicle detection and classification in traffic [13, 20] , pedestrian detection [60, 72], vehicle license plate recognition [1, 30].
The computer vision with ANN is mathematical for a computer that can im-itate the function of human brain. Hence, it can improve the performance of the vehicle has the ability to see and recognize like a human, which is an important task in an automotive safety application.
1.3
Problem Statement
For the objects that can be found on the road with several of sizes, shapes and colors. In particular, a detection of moving objects (pedestrians, cars, bicycles, etc.) as show in Figure 1.3. Such real-time obstacle detection by computer vision was crucial in that we often found fake obstacles such as a text, sign, or painting on the road as show in Figure 1.4.
Chapter 1. Introduction
Figure 1.3: The moving objects on the road
Figure 1.4: The fake obstacles
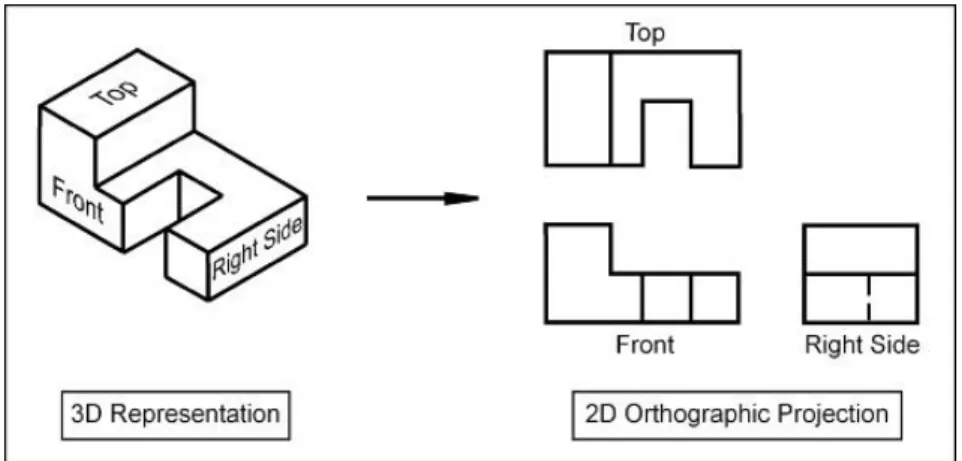
in Figure 1.5, even if the object is a three-dimensional object, but the camera images can be seen, it is a two-dimensional image based on the principles of an orthographic projection 45. An orthographic projection is a two-dimensional representation of a three-dimensional object, which two-dimensional drawing represents different sides of an object as in Figure 1.6.
Figure 1.5: Preview image of the camera perspective
As mentioned above, real-time obstacle detection by computer vision may be a mistake in detecting fake obstacles becoming real obstacles. Therefore, an algorithm for obstacle detection in this dissertation need to recognize and extract the difference
Chapter 1. Introduction
Figure 1.6: Preview image from the front view by an orthographic projection
of specific feature of the obstacles along with appropriate methods to learning and classify whether the object detected is a real obstacle or fake obstacle.
1.4
Objectives
The major purpose of this dissertation is to introduce a novel object detec-tion for vehicles integrating several techniques that the author proposed in the past, such as object feature extraction, object recognition, and object classification. Such real-time obstacle detection by computer vision was crucial in that we often found fake obstacles. Thus, the aim of this dissertation is to improve general object de-tection method for the vehicle using computer vision with ANN, which can classify the obstacles that are real obstacle or fake obstacle. In this dissertation, the pro-posed technique is based on HOG to extract features of the objects and classify the obstacles by the ANN for several situations.
1.5
Outline of the dissertation
Chapter 1. Introduction
which is one of importance task of an automobile safety system, namely to detect objects and obstacle avoidance. The object that the author is interested in this research is the generic object, which is not limited to vehicles, pedestrians, bicycles or motorcycles.
This dissertation reports the findings of a thorough study and introduces novel methods, including their evaluations. The experimental results have proven that the methods have been effective and succeeded in completing a goal of this research. The author herein proposed the algorithms to detect object in front of the vehicle in both indoor and outdoor environments.
The first, analyzed and identified the characteristics of the object in the var-ious cases that are viewed in the camera view. The image seen from the camera’s perspective is a two-dimensional image, distinct from the three-dimensional vision of the human eye. This distinctive feature of each object-type can be used to classify objects that are detectable as real or fake objects.
Second, the extraction method extracts the characteristics of each type of object to learn and remember the characteristics of the object. This approach focuses only on the objects in the image, thus reducing the role of the background and making the object stand out so that the desired result, shape and ratio are needed. Finally, classification of objects from individual characteristics. This method using several techniques to distinguish object types based on their characteristics discovered in feature extraction to learn the difference between a height object and non-height object.
Hence, my entire studies are assembled into one main system, called object detection system for general obstacle detection, from the actual video images taken by an on-board camera. The proposed method, the author extracted feature of the obstacles to classify the obstacles that are real obstacles or fake obstacles such as a painting, sign or text on the road. The experimental results showed that this system can detect general objects, and is not restricted to vehicles, objects or pedestrians. It has provided good results along with high accuracy and reliability, which it is accurate enough to provide a warning to the driver when a collision is imminent.
Chapter 1. Introduction
1.6
Novelty of the Study
There are a lot of existing studies focusing on object detection for vehicles, as similar to this study - which most of the previous work was to detect specific types of objects such as pedestrians, cars, trucks, etc. However, this study focuses on the general object detection regardless of the size or color of the object, and is not restricted to vehicles, objects or pedestrians.
The novelty of the study is the general object detection system by computer vision with ANN, from the actual video images taken by an on-board monocular camera. The novel general object detection is based on HOG to extract features of the objects and classify the obstacles by TDNN. This system can effectively detect general objects with several sizes, shapes, and colors, which can classify the obstacles that are real obstacles or fake obstacles with high accuracy and reliability.
1.7
Scope of study
Study focuses on general object detection for vehicles by using computer vision with ANN. The key for detecting objects with the camera is the lighting conditions. As a result, places and environments directly affect the object detection. Besides, the obstacle that may be found in each case are different. Under this condition, the author decided to demonstrate my proposed method with the experiment. The author conducted three case as follows:
1. Object detection for AGV in indoor scene.
Chapter 1. Introduction
1.8
Structure of This Dissertation
The remainder of the dissertation is organized into 6 chapters. The rest of the dissertation is organized as follows;
The next chapter discusses previous researches related to the topics of this dis-sertation. From Chapter 3 to Chapter 6, the author describe methodologies of each proposed study respectively: Object-types analysis, object feature extraction, object recognition and classification, and prototype of object detection system. Chapter 7 presents experiment procedures and results. Chapter 8 is devoted to discussing new findings of each study and their limitations. Finally, the author summarize the dissertation and draw conclusions, including future works. Figure 1.7 presents an overall content structure of the dissertation
Chapter 1. Introduction
Chapter 2
Related works
In the previous chapter, the author has explained the background of existing problems and the research objectives. This chapter surveys existing works related to the topic of this dissertation. This chapter surveys the works and theory that related to the topic of this dissertation.
Chapter 2. Related works
2.1
Object feature extraction method
In various computer vision applications widely used is the process of finding the local features and extracted from the images refer to a pattern or distinct structure found in an image, such as a point, edge, orientation, or small image patch. These systems called feature extraction [16, 51] have received intensive attention in the literature of object detection and classification, tracking, and motion estimation. Consequently, a broad range of techniques has been proposed, such as BRISK [33], FREAK [25], SIFT [35, 47], SURF [40], HOG [14] and optical flow [24, 48, 49].
The feature extraction method depends on considering the criteria of appli-cation and the nature of data. For example, binary descriptors, such as BRISK or FREAK, which are encoded into binary vectors based on the different local inten-sity. These descriptors are suitable used for finding point correspondences between images, which are used for registration. In contrast, the SIFT, SURF, optical flow and HOG descriptors are suitable for recognition, classification, and detection tasks. SIFT is an algorithm for detecting distinctive invariant image features which provide robust matching between different two images and are invariant to image scale and rotation. SIFT has four main steps consist of scale-space extrema detec-tion, keypoint localizadetec-tion, orientation computation and keypoint descriptor. This method provides highly effective results in matching images in different views of an image, which is a popular method for studying to improve the efficiency of ob-ject recognition [59] or classification [22], but it is suffered with speed. For example, Ramisa [47] evaluated and also proposed several modifications to the original schema to improve the SIFT for object recognition method in a mobile robotics setting.
SURF is one of local feature detector and descriptor, which is inspired by SIFT descriptor. The characteristics of SURF are fast interest point detection, distinctive interest point description, speedup descriptor matching, and invariant to common image transformations: image rotation, scale changes, illumination change, or small change in viewpoint. The computation speed of SURF faster than SIFT [27, 52], but comparable performance.
Chapter 2. Related works
Optical flow is descriptor that use for motion detection algorithms. The main objective of motion detection algorithms is to mark video frame regions that contain motion and also estimate the direction and magnitude of movement. Optical flow is a motion pattern of the object in the scene caused by relative motion between the scene and the eye (a camera). This method is used for specific fields, such as motion-based object detection, image segmentation to tracking and predict the mo-tion vector of a moving object by momo-tion estimamo-tion. For example, moving object detection and tracking based on optical flow [3], this system proposed motion object detection and tracking in image sequences from stationary camera images in traffic surveillance. It used optical flow to detecting motion vectors, the vector magni-tudes threshold are used to segment objects from the background in urban videos. However, this system is done for detection and tracking in image sequences from stationary camera. Besides, Hariyono et al. [24] proposed a method for pedestrian detection from a moving vehicle by using optical flows to segment moving object regions. Then, HOG features is used to object recognition and classified using lin-ear support vector machine (SVM). Moreover, because the calculating the optical flow is computationally expensive [61], the optical flow descriptors are much more expensive to extract than the HOG descriptors.
HOG feature descriptor counts occurrences of gradient orientation in localized portions of an image. This descriptor similar to SIFT and SURF, but differs in that it is computed on a dense grid of uniformly spaced cells and uses overlapping local contrast normalization for improved accuracy and its advantages in detecting edge and texture information of image. The HOG descriptor has more important advantages over other descriptors. Since it operates on local cells, it is invariant to geometric and photometric transformations, except for object orientation.
Chapter 2. Related works
suitable for identification of specific objects in object recognition (e.g. in a Bag-of-features fashion). In this dissertation, the object that has to detect is an unknown object - of which we do not know the exact shape, size or color. HOG is typically used in a sliding window fashion in object detection systems (e.g. pedestrian detection). Thus, HOG is suitable to use to extract feature of an object in this problem.
In this dissertation, the target object of detection is not an exact shape, size or color. One method that is highly effective in the feature extraction of the object in the image is the HOG method. Basically, HOG used the feature of shape regardless of the size or color of the object. It counts occurrences of gradient orientation in part of an image hence it is an appearance descriptor [14], which it is the most commonly use method to find an edge. HOG features are now widely used in object recognition and detection [58].
Many works for pedestrian detection system uses the Histograms of Oriented Gradient (HOG) method [14, 58, 70]. For example, Zhang et al. [70] proposed a method base on HOG classifier for pedestrian detection to extract the specific features of the human in infrared images by the distribution of intensity gradients or edge directions regardless of the size or color of the human. Then, linear support vector machines (SVMs) [5, 70] is used as a classifier for pedestrian detection. The system achieved is up to 99%. This is a comparison and recognition process which can be applied to separate and classify the features of pedestrians efficiently.
HOG descriptors were invoked in different applications other than human de-tection which it was original designed for as follows: There are many traffic signs recognition and classification used HOG descriptor to extract feature of the object in images. [21, 54]. Fleyeh et al. [21] proposed the method that used HOG descriptor approach for traffic signs classification and classified the traffic signs by a Gentle AdaBoost classifier with high accuracy was 99.42%.
Vehicles recognition, classification, and detection is an important task for au-tomotive safety system. Many works developed for this system, which the vehicle feature extraction based on HOG-combined with several classifiers [10, 53]. For example, Rybski et al. [53] proposed a vision-based algorithms for coarse vehicle
Chapter 2. Related works
orientation classification by use HOG to extract the different orientations of vehicles in images and used orientation-specific classifiers for the classification. The result of the classification was stabilized at 88% accuracy.
Moreover, also many works use HOG descriptors as features extraction for object recognition, classification, or detection such as the hand shape classification [66], and the handwritten digit recognition [15].
2.2
Object detection with Artificial Neural Networks
(ANN)
One of the most important obstacle avoidance is the vehicle has to be able to recognize and classify the obstacles. So far, many recognition and classification methods have proposed. Several works have been developed using neural networks for image analysis applied to obstacles recognition and classification [11, 29], which is an important task in an automotive safety application.
Quiles et al. [46] proposed the objects detection and recognition of mobile robot, which is implemented by using sonar to detect obstacle. In the image segmen-tation process is performed by a color classification method based on MLP Neural Networks [9, 43, 46]. The results of the classification is a defined color, separate from other colors of the image. For example, when the red object is required, every pixel of the image is classified as red or non-red. But this system can only be used to track objects of a specific color.
Chapter 2. Related works
For the objects that can be found on the road with several of sizes, shapes and colors-in particular, a detection of moving objects (pedestrians, cars, bicycles, etc.). Detection using single frame images may be faulty. Many studies have improved the detection method by using multi-frame images instead single frame[50, 57, 69].
For example, Zhan [69] used multi-frame images instead single frame to im-prove moving object detection algorithms. This system used the difference of the object edge between the two images by using Canny detector to moving object. The result has a high recognition rate and a high detection speed, but the problem of this system is false detecting under more complicated background.
The Time Delay Neural Network (TDNN) has the potential of learning to overcome the limitations of a multi-layer neural network, and complete image se-quences at a time instead of a single image, which it can work with complex data efficiently. Several works for object recognition use TDNN [39, 64, 65]. For exam-ple, a pedestrian classification based on the typical criss-cross motion pattern of a pedestrians legs in sequences of gray-scale stereo images taken from a moving cam-era pair. The recognition is stabilized by feedback loops added to the feed-forward TDNN architecture.
Chapter 3
Object-types analysis
As mentioned before, object detection, which is an important task in an au-tomotive safety application. In the previous chapter, the author mentioned related works and their addressed problems on object classification and detection. Many state-of-art studies attempted to propose solutions to solve existing obstacles effec-tively.
Chapter 3. Object-types analysis
3.1
Background
In the actual vehicle driving situation on the road, it is desirable to be able to recognize the preceding obstacles-of which we do not know the exact shape, size or color-in order to prevent severity of a collision.
The work that the author reviewed in the previous chapter, these systems are classified to identify and detect specific objects in the image such as pedestrian de-tection, traffic signs recognition, vehicle license plate recognition. Nevertheless, this dissertation proposed novel methods to detect general object, and is not restricted to vehicles, objects or pedestrians. Such real-time obstacle detection by computer vision was crucial in that we often found fake obstacles such as a text, sign, or painting on the road.
This study focuses on general object detection for vehicles by using computer vision. The key for detecting objects with the camera is the lighting conditions. As a result, places and environments directly affect the object detection. Besides, the obstacle that may be found in each case are different. Under this condition, the author decide to study in three cases. First is object detection for AGV in indoor scene. Second, electric senior vehicle in a senior car lane. Finally, object detection for vehicle in traffic.
3.1.1 The object detection for AGV in indoor scene
Currently, the AGV is a transport vehicle widely used in manufacturing in-dustry. This system can also reduce labor costs in industry, as well as increasing the safety of its employees from working in dangerous environments as in Figure 3.1. It can move materials and equipment to various locations that work automatically according to conditions, and the directions to destination are defined, but it cannot avoid obstacles in front by itself. When considering the actual AGV driving situa-tion on the path, it is desirable to be able to recognize the preceding obstacles. In order to prevent a collision the AGVs and the obstacles-which most objects might be found in factories are simple shape as in Figure 3.2(a). Such real-time obstacle
Chapter 3. Object-types analysis
detection was crucial in that we often found fake obstacles such as flat tiles, papers, or painting on the floor as in Figure 3.2(b).
Figure 3.1: Automated Guided Vehicle (AGV)
Figure 3.2: The obstacle images in factory environment (indoor scene): (a) real obstacle; (b) fake obstacle
3.1.2 The object detection for electric senior vehicle in a senior car lane
Chapter 3. Object-types analysis
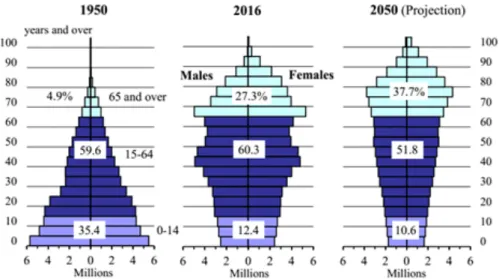
for men. Similarly, in 2016, the elderly population (aged 65 or over) has increased from 1950 constituting 22.4 percent of the total population. Furthermore, the elderly population also projection to 37.7 percent in 2050 as in Figure 3.3.
Figure 3.3: Changes in the Japan Population Pyramid, Source: Statistics Bureau, MIC; Ministry of Health, Labour and Welfare
The electric senior vehicle widely used to support the elderly in daily life. It is often referred to as a mobility scooter or a senior car as well. It is intended to drive pedestrians on footpaths equivalent to a wheelchair, but configured like a motor-scooter. It can help the elderly and the disabled regain their freedom, confidence and independence inside and outside the home. Moreover, it is convenient and safety for elderly to go around their neighbors such as a supermarket or a convenience store as in Figure 3.4.
Normally, the electric senior vehicle is operated in a bike lane and side walk in case to leave or enter the property. The object that is the most common objects that can be found on the sidewalk and a bike lane in Japan are not exact shape-in particular, pedestrians and bicycles as in Figure 3.5(a). Moreover, the fake obstacles that often found in real-time obstacle detection in this situation, such as painting, sign or text on the street as in Figure 3.5(b).
Chapter 3. Object-types analysis
Figure 3.4: Preview of electric senior vehicle usage
Figure 3.5: The obstacle images on the sidewalk and a bike lane: (a) real obstacle; (b) fake obstacle
3.1.3 The object detection for vehicle in traffic
Chapter 3. Object-types analysis
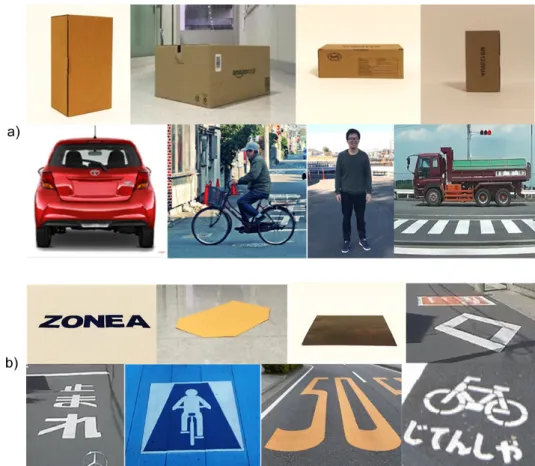
detect objects and obstacle avoidance. In the actual vehicle driving situation on the road, it is desirable to be able to recognize the preceding obstacles. In order to prevent a collision of the vehicles and the obstacles. For the real objects that can be found on the road with several of sizes, shapes and colors. In particular, a detection of moving objects (pedestrians, cars, bicycles, etc.) as show in Figure 3.6(a). Moreover, there are various symbols and messages on the road, which may lead to misunderstandings as real objects as show in Figure 3.6(b).
Figure 3.6: The obstacle images on traffic: (a) real obstacle; (b) fake obstacle
In this dissertation, detecting objects is a detection regardless of the object color. Hence, it is the detection based on the object characteristic analysis.
3.2
Object feature analysis
As the author mentioned above, the objects that can be found in each cases in several sizes, shapes or colors, such real-time obstacle detection by computer vision was crucial we often found fake obstacles. Identifying whether the object is a real or fake object needs to know the different characteristics of each type. Then, it uses the different characteristics of object to identify whether the object being detected is a real or fake object.
Chapter 3. Object-types analysis
In general, the camera will take pictures in front looking directly at the object in the front view as in Figure 3.7. However, even if the object is a three-dimensional object, but the camera images can be seen, it is a two-dimensional image based on the principles of an orthographic projection. An orthographic projection is a two-dimensional representation of a three-two-dimensional object, which two-two-dimensional drawing represents different s ides of an object. We can use this principle to analyze the specific features of the obstacles that need to detect.
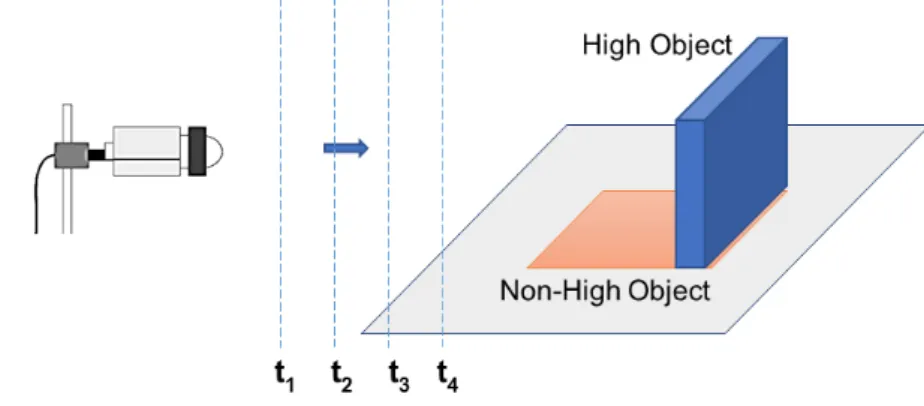
Figure 3.7: Preview image of the camera perspective at various distances
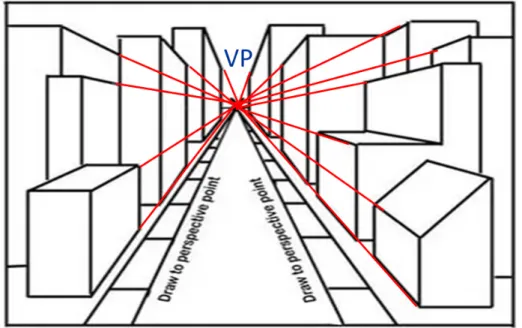
In case of the object as a simple shape, when the camera shoots a real object from the front view, the height of the object is vertical line based on the principles of an orthographic projection as the author mentioned in chapter 1. In contrast, the fake object image is no border in the vertical line based on construction of perspective viewing, showing the formation of a VP [31], which is the image of the point at infinity as show in Figure 3.8.
From the object projection to VP show that the angle of the object edge from the camera view is different as shown Figure 3.9. From this result, these different edge features can be used to classify objects.
Chapter 3. Object-types analysis
Figure 3.8: A 2D construction of perspective viewing, showing the formation of a vanishing point
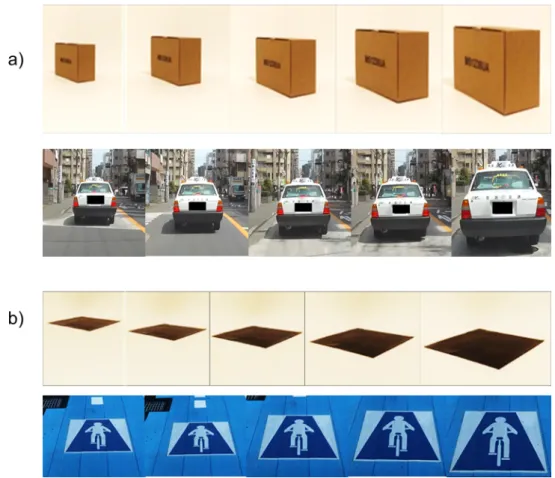
When the vehicle moves closer to the height object, as long t1, t2, t3 as in 3.7[C.4, C.5], though the size of the object has changed, the shape of the object has not changed. However, when the vehicle moves closer to the non-height object, the size and shape of the object have changed as in 3.10. From changes in the shape of the edge of the object can be analyzed to classify the object, which can be illustrated by comparing the difference of the orientation of the edges in each frame. One method that is highly effective in the feature extraction of the object in the image is the HOG method. Basically, HOG used the features of shape regardless of the size or color of the object in the image. HOG counts occurrences of gradient orientation in part of an image hence it is an appearance descriptor. Thus, this HOG method is best suited to solve this problem.
3.3
Discussion
The aim of this dissertation is to detect the obstacles in front of a vehicle. Real time object detection by computer vision was crucial in that fake obstacles may be
Chapter 3. Object-types analysis
Figure 3.9: The examples of the edge detection: (a) the edge detection of the high objects; (b) the edge detection of the non-high objects
found, such as text or symbols on the road. Therefore, this algorithm needs to recognize the difference of specific features of the obstacles, where the real obstacle is a high object and the fake obstacle is a non-high object.
Based on the result of analysis of the characteristics of each object, the object feature that can be used to classify the obstacles that are real obstacles or fake obstacles as follows:
Chapter 3. Object-types analysis
Figure 3.10: A comparison of changes in the shape of an object at different distances; (a) the high object; (b) the non-high object
2. Comparison of the difference of the edge orientation in each frame (METHOD 2), which the difference of the orientation of the edges the real object is very small compared to the fake object.
3. Comparison of the shape variation ratio by calculating the ratio between the width and height of the object (METHOD 3), which the fake object has a shape variation ratio over the real object.
In conclusion, characteristics of objects used in the proposed methods pre-sented in this dissertation-it is based on the comparison of learning outcomes of the object feature in three cases as follows:
Chapter 3. Object-types analysis
1. Feature recognition by METHOD 1 2. Feature recognition by METHOD 2 3. Feature recognition by METHOD 3
Chapter 4
Object feature extraction
In the previous chapter, the author introduced the object-type analysis based on characteristics of objects such as orientation of edge, the difference orientation of edge in each frame, and shape variation ratio. My focus of this dissertation was to extract feature of the object with several sizes, shape, and color-to classify the object is a real object or fake object.
In this chapter, the author describe object feature extraction and identifica-tion. This method can be can be used to identify and extract feature of shape of both real obstacle and fake obstacle.
I will begin by explaining a background of the study and then move to seeing how the method works. the author conducted several experiments to evaluate results to prove a validation of the method. Findings will be discussed in a discussion section in this chapter. Finally, the author present a conclusion.
4.1
Background
Chapter 4. Object feature extraction
to extract the dominant features of the objects. Thus, the method used should be appropriate for the analysis and extraction of the image features, regardless of the color or size of the object in the image. From the results of the analysis of object types in the previous chapter.
From the results of the analysis of object types in the previous chapter, the object feature to be extracted to classify the obstacles that are real obstacles or fake obstacles as follows:
1. The object edge feature extraction
2. Comparison of the difference of the edge orientation in sequence of time 3. The shape variation ratio by calculating the ratio between the width and height
of the object.
4.2
Methodology
As the author mentioned in chapter 2, the three feature extraction that pop-ular in object recognition, classification, and detection such as SIFT, SURF and HOG method. Although the computation is concerned they are similar, but they have different applications. SIFT and SURF descriptor compute the gradient his-togram only for patches around specific interest points, which it is highly effective in identification of specific objects. Nevertheless, the object that has to detect in this dissertation is an unknown object - of which we do not know the exact shape, size or color. HOG is computed for an entire by divides the image into small cell and summing up the orientation of gradient over every pixel within each cell in an image. Besides, HOG is typically used in a sliding window fashion in object detec-tion systems (e.g. pedestrian detecdetec-tion). Thus, HOG is suitable to use to extract feature of an object in this problem.
The HOG method was first proposed by Dalal & Triggs [14], devised as a method to be used to detect humans. Basically, HOG used the features of shape
Chapter 4. Object feature extraction
regardless of the size or color of the object in the image. HOG counts occurrences of gradient orientation in part of an image hence it is an appearance descriptor. It is the most commonly used method to find an edge. It then divides the image into sub-images (block). Heres how the image is divided into two types as in the Figure 4.1(a) Regtangle-HOG type (R-HOG) and in the Figure 4.1(b) is Circle-HOG type (C-HOG).
Figure 4.1: The structure of cell division: (a) R-HOG type; (b) C-HOG type; (c) example of an image with sixteen cells; (d) example of setting block size 2-by-2
cells
Chapter 4. Object feature extraction
For example, Figure 4.1(c) shows an image with sixteen cells. If the block size is 2-by-2 cells, hence each block consists of four cells as show in Figure 4.1(d).
The computation of the gradient values can be calculated by using 1D - discrete derivative masks in both the horizontal and vertical directions. This method requires filtering the grayscale image with the following filter kernels by equation 4.1-4.2.
Dx = h −1 0 1 i (4.1) Dy = h −1 0 1iT (4.2)
Hence, being given an image I, we obtain the x and y derivatives using a convolution operation by equation 4.3-4.4.
Ix= I ∗ Dx (4.3)
Iy = I ∗ Dy (4.4)
Each pixel in the cell will have the magnitude and orientation similar to equa-tion 4.5-4.6.
|G| = q
Ix2+ Iy2 (4.5)
θ(x, y) = arctan(Ix/Iy) (4.6)
θ(x, y) = the angle of the gradient vector coordinates (x, y).
Chapter 4. Object feature extraction
The key parameter is bin, which is evenly spread over 0 to 180 or 0 to 360 degrees, depending on whether the gradient is unsigned or signed. The final feature vector includes all of the block in 1D matrix form.
Find the sum of each direction by equation 4.7 and calculated feature of each block by equation 4.8. Cb = n X i=1 θ(x, y)i (4.7) υk= n X i=1 (|G(x, y)k=i| ∗ Cb)|θ(x, y)k=i (4.8) where
n = number of position (x, y) for each block. b = direction
Cb = a summary of each direction
The feature include all of block by equation 4.9.
υk= υk=1 υk=2 .. . υk=k = [] (4.9)
where k = the order of the block.
con-Chapter 4. Object feature extraction
Then the normalization factor can be calculated by one of the following as equation 4.10-4.12). Optimized HOG feature extracting flow chart as shown in Figure 4.2. L2-norm:
f = υ p||υ||2
2+ e2
(4.10)
L2-hys: L2-norm followed by clipping (limiting the maximum values of v to 0.2) and renormalizing. L1-norm: f = υ (||υ||1+ e) (4.11) L1-sqrt: f = r υ ||υ||1+ e (4.12)
Figure 4.2: HOG feature extracting flow chart
I proposed a HOG method to extract feature of the obstacles, which is highly effective in the feature extraction of the object in the image. Therefore, the author used the HOG method to extract features of the obstacles which can detect objects and shapes within an image by analyzing the distribution of the intensity gradient and edge direction, and then explain the image in a histogram. The proposed method is separated into two parts, i.e., pre-processing and feature extraction.
Chapter 4. Object feature extraction
4.2.1 Pre-processing
The pre-processing process aims to prepare the data for the next stage. The output of this stage would be ready for the next stage to perform complicated image processing tasks on the data. Prior to extracting features, training and testing a classifier. On the basic of HOG to use the features of shape regardless of size or color of the object in the image. So, a pre-processing step is image enhancement, the input images of our system are initially converted to binary image, applied to remove noise for highlight certain features of interest in the images, cropped to ROI. This provides better feature vectors for training the classifier. The most important thing is to detect and treat the edges of the object in the image, which the edge detector is Canny detector [23, 36]. The simple pre-processing flowchart is given as in Figure 4.3.
Figure 4.3: Pre-processing Flow Chart
4.2.2 Feature extraction
Chapter 4. Object feature extraction
edge. HOG features are now widely used in object recognition and detection such as pedestrian detection system, traffic signs recognition and classification, Vehicles recognition, classification, and detection. With these properties, the author used HOG to extract the feature of the object that the author described in chapter 2 as shown in Figure 4.4.
Figure 4.4: The HOG method flowchart
4.3
Experiment and results
I conducted an experiment to evaluate whether the proposed method can ex-tract feature suitable for each cases. The experiment is separated into four parts, i.e.,
Chapter 4. Object feature extraction
pre-processing, the object edge feature extraction, the extraction of the difference of the edge orientation in each frame, and extract shape variation of the object.
4.3.1 Pre-processing
For this experiment, the author collected the samples of various obstacle that include sample of real obstacles and sample of fake obstacles, which taken from the front view by an on-board camera and downscale to 256x256 size as shown in Figure 4.5. Then, enhance image quality follow the process in flowchart as show in Figure 4.4.
Chapter 4. Object feature extraction
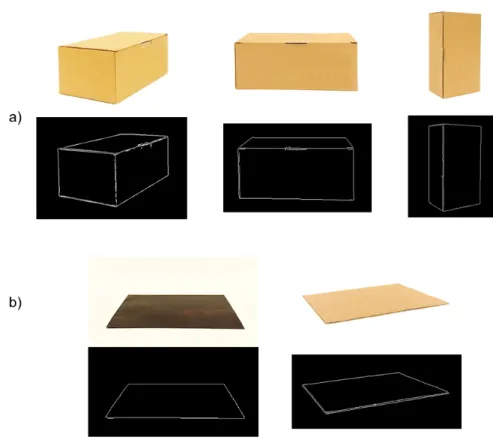
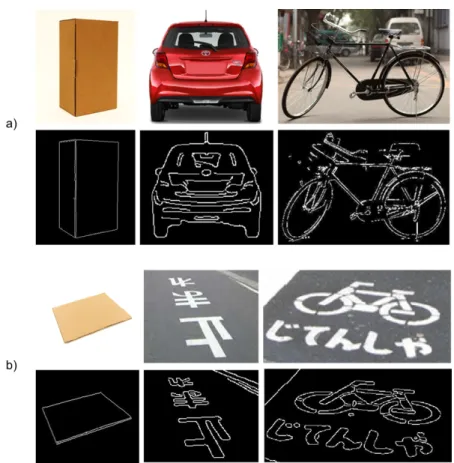
The results of this experiment can detect the edges of the object in every shape, height and orientation of the height objects and the non-height objects as in Figure 4.6.
Figure 4.6: The edge detection of the object: (a) high object, (b) non-high object
4.3.2 The object edge feature extraction (METHOD 1)
HOG can calculate the orientation of the border in the form of a histogram. This method can analyze the distribution of the orientation in the form of a his-togram. It can classify the obstacle by learning the orientation of object edges, which the real object-the height of the object is arranged in a vertical line. In con-trast, the fake object image is no border in the vertical line. This experiment was conducted to investigate the feasibility of using object edge feature extraction to recognize and classify the object that are real object or fake object. The experiment
Chapter 4. Object feature extraction
is separated into two parts, i.e., object edge feature extraction for simple shape and object edge feature extraction for complex shape.
4.3.2.1 Object edge feature extraction for simple shape
As the author mentioned before, in case of the AGV, the object is a simple shape [C.1, C.2]. In case of the object as a simple shape, when the camera shoots a real object from the front view, the height of the object is vertical line based on the principles of an orthographic projection as the author mentioned in chapter 1. In contrast, the fake object image is no border in the vertical line based on construction of perspective viewing.
It is important to make sure the HOG feature vector encodes the right amount of information about the object. the author has tested the effect the cell size pa-rameter has on the amount of shape data encoded in the feature vector. By varying the HOG cell size parameter and visualizing the result as show in Figure 4.7.
The HOG visualization plot shows that a cell size of 24-by-24 does not encode much shape information every edges, while a cell size of 16-by-16 encodes a lot of shape information but increases the dimensionality of the HOG feature vector signif-icantly. A good compromise is a 20-by-20 cell size. This size setting encodes enough spatial information to visually identify a digit shape while limiting the number of dimensions in the HOG feature vector, which helps speed up training.
Therefore, the author created an experiment to analyze the characteristics of both types of obstacles by using the HOG feature method. This experiment sets linear gradient voting into 9 orientation bins in 0 to 180 degrees. Then it divides the image into sub-images by 2-by-2 blocks and 20-by-20 pixel cells. From the results, the feature length of each image is 4356.
Chapter 4. Object feature extraction
Figure 4.7: The effect the cell size parameter has on the amount of shape data encoded in the feature vector for simple shape
orientation of gradient values pattern of each object are different as show in Figure 4.9. In this graph, show the example the comparison of the orientation of gradient values from HOG feature between high object and non-high object consist of three sample pairs. The difference of the orientation of gradient values pattern of each object has the same tendency and the first to fifth bin, the number of histogram feature of high object much more than non-high object.
Thus, the distinguishing feature of the real obstacles that the author interested to taken into consideration is the orientation of the edges of the objects aligned as a vertical line from HOG features.
Chapter 4. Object feature extraction
Figure 4.8: HOG feature visualization for simple shape: (a) high object; (b) non-high object
Chapter 4. Object feature extraction
4.3.2.2 Object edge feature extraction for complex shape
In case of senior vehicle and vehicle in traffic, the object found would be a complex shape. The effect the cell size parameter test has on the amount of shape data encoded in the feature vector. By varying the HOG cell size parameter and visualizing the result as show in Figure 4.10.
Figure 4.10: The effect the cell size parameter has on the amount of shape data encoded in the feature vector for complex shape
The HOG visualization plot shows that a cell size of 12-by-12 does not encode much shape information every edges, while a cell size of 4-by-4 encodes a lot of shape information but increases the dimensionality of the HOG feature vector significantly. A good compromise is a 8-by-8 cell size. This size setting encodes enough spatial information to visually identify a digit shape while limiting the number of dimensions in the HOG feature vector, which helps speed up training.
Therefore, the author created an experiment to analyze the characteristics of both types of obstacles by using the HOG feature method. This experiment sets linear gradient voting into 9 orientation bins in 0 to 180 degrees. Then it divides
Chapter 4. Object feature extraction
the image into sub-images by 2-by-2 blocks and 8-by-8 pixel cells. From the results, the feature length of each image is 34596.
The result of edge feature extraction for the complex shape as show in Figure 4.11. Figure 4.12, show the difference of the orientation of gradient values pattern of each object has the same tendency and the first to third bin, the number of histogram feature of high object less than non-high object, other bins are unstable.
Figure 4.11: HOG feature visualization for complex shape: (a) high object; (b) non-high object
From the result of the object edge feature extraction for the simple shape and complex shape, the features of the edge of the object are distinctly different in case of simple shape. For the complex shape, the features of the edge are different as well, but not distinct when compared with simple shape. This method may be error under more complicated shape. If the object is more complex shape, it will be necessary to find other features to analyze together.
4.3.3 The extraction of the difference of the edge orientation in each frame (METHOD 2)
Chapter 4. Object feature extraction
Figure 4.12: Illustration of a comparison of the orientation of gradient values from HOG feature between high object and non-high object for complex shape
when the vehicle moves closer to the non-high object, the size and shape of the object have changed. the author is concerned about the difference of the edge orientation in each frame of obstacle. Hence, we can also use this relationship to learn the difference between high and non-high objects.
This experiment was conducted to investigate the feasibility of using extraction of the difference of the edge orientation in each frame to recognize and classify the object that are real object or fake object. For the feature extraction used HOG descriptor, which setting parameter same as METHOD 1. Then, gauge the difference between the HOG features in different frame by computing the square error between them.
The result of the extraction of the difference of the edge orientation in each frame as show in Figure reffig:4-11. From this result show that when the vehicle moves closer to the high object, HOG features in different frame is slightly change as shown in Figure 4.13(a). However, HOG features in different frame is greatly changed when the vehicle moves closer to the non-high object as shown in Figure 4.13(b). Figure 4.13(c) show the square error to compare the difference between the HOG features in different frame of each object. The square error is smaller when
Chapter 4. Object feature extraction
images have similar edge orientation. Thus, HOG features in different time of the high-object has a little bit change when the vehicle moves closer to the object. In contrast, the non-high-object has higher difference of HOG features in different time.
This comparison of the difference of the edge orientation in each frame (METHOD 2) can use to object classification, which the difference of the orientation of the edges the real object is very small compared to the fake object.
4.3.4 The shape variation ratio (METHOD 3)
From the previous chapter, when the vehicle moves closer to the object, the real obstacle has a low shape variation ratio. In contrast, the fake obstacles has a high shape variation ratio. This experiment was conducted to investigate the feasibility of compare the ratio between the width and height of the object for identification of objects in object recognition [C.7].
Computation of shape variation ratio, the beginning segments the 2-D grayscale image into object and background regions using active contour [7] based segmenta-tion based on Chan-Vese method. The output image bw is a binary image where the foreground is white (logical true) and the background is black (logical false). Mask is a binary image that specifies the initial state of the active contour. The boundaries of the object region(s) (white) in mask define the initial contour position used for contour evolution to segment the image.
Chapter 4. Object feature extraction
Figure 4.13: The result of the extraction of the difference of the edge orientation in each frame: (a) comparison of HOG feature of high object; (b) comparison of HOG feature of non-high object; (c) comparison of square error of HOG feature in
different time
Chapter 4. Object feature extraction
Chapter 4. Object feature extraction
4.4
Discussion
This experiment was conducted to investigate the feasibility of using various feature extraction to recognize and classify the objects that are real object or fake object. The experiment is separated into two parts based on shape, i.e., feature extraction for simple shape and complex shape. Moreover, three parts based on object feature, i.e., the object edge feature extraction, the edge orientation in each frame, and the shape variation ratio. For object segmentation using active contour based on Chan-Vese method. In addition, HOG is used to extract feature of the object to classify the objects that are real object or fake object.
From the result of the METHOD 1, the difference of object edge feature from HOG feature between high object and non-high object is quite distinctly different under simple shape object. However, the difference of object edge feature is lightly different for complex shape object. Thus, METHOD 1 may be error under more complicated shape. If the object is more complex shape, it will be necessary to find other features to analyze together.
METHOD 2, the result show that show that when the vehicle moves closer to the high object, HOG features in different frame is slightly change as shown in Figure 4.13(a). However, HOG features in different frame is greatly changed when the vehicle moves closer to the non-high object as shown in Figure 4.13(b). Figure 4.13(c) show the square error to compare the difference between the HOG features in different frame of each object. The square error is smaller when images have similar edge orientation. Thus, HOG features in different time of the high-object has a little bit change when the vehicle moves closer to the object. In contrast, the non-high-object has higher difference of HOG features in different time.
This comparison of the difference of the edge orientation in each frame (METHOD 2) can use to object classification, which the difference of the orientation of the edges the real object is very small compared to the fake object.
Chapter 4. Object feature extraction
Finally, the experiment for METHOD 3 was conducted to investigate the feasi-bility of compare the ratio between the width and height of the object for identifica-tion of objects in object recogniidentifica-tion. The result of shape variaidentifica-tion ratio comparison, the result of this method is pattern of the shape variation of the obstacle to recognize the obstacles. We can compare this variation by calculating the ratio between the width and height of the object. The real obstacle has a low shape variation ratio. In contrast, the fake obstacles has a high shape variation ratio.
4.5
Conclusions
In this dissertation, the object that has to detect is an unknown object - of which we do not know the exact shape, size or color. From the result of feature extraction show that HOG is suitable to use to extract feature of an object in this problem as follow;
METHOD 1, a comparison of the difference of object HOG feature suit for sim-ple shape object classification, but the problem of this method may false classifying under more complicated shape.
METHOD 2, this system used the difference of the object edge between the two images by using HOG feature, which the square error of the orientation of the edges of the real object in sequence of time is very small compared to the fake object. This method effective in identifying both simple shape and complex shapes object.
METHOD 3, this method compare shape variation by calculating the ratio between the width and height of the object. The real obstacle has a low shape variation ratio. In contrast, the fake obstacles has a high shape variation ratio when the vehicle move closer to object. As a result, the author can take pattern of the shape variation of the obstacle to recognize the obstacles.
Chapter 5
Object classification
In the previous chapter, the author presented three methods to extract feature of the object. Each method must consider the criteria of application and the nature of data to select the best feature detector and descriptor. However, classifier is also important in object detection. The accuracy of the classification depends on the selection of the discriminator to suit the feature to be classified.
This chapter presents the method for classify the obstacles based on the three feature extractions described in the previous chapter as follows;
1. Object classification by learning the difference of HOG feature of the object in single image (METHOD 1).
2. Object classification by learning pattern of the difference of HOG feature of the object in sequence of images (METHOD 2).
3. Object classification by learning the shape variation ratio of the object (METHOD 3)