九州大学学術情報リポジトリ
Kyushu University Institutional Repository
Optimization of post-label delay in single-
phase arterial spin labeling (ASL) using multi- phase ASL in four-dimensional magnetic
resonance angiography
大下, 剛史
https://doi.org/10.15017/2534385
出版情報:九州大学, 2019, 博士(保健学), 課程博士 バージョン:
権利関係:
Optimization of post-label delay in single-phase arterial spin labeling (ASL) using multi-phase ASL in four-dimensional magnetic resonance angiography
Tsuyoshi Oshita
1, Hidetake Yabuuchi
2and Masanobu Osame
1Abstract
Purpose: To optimize the post-label delay in single-phase arterial spin labeling (SP-ASL) using multi-phase ASL in 4-dimensional magnetic resonance angiography (4D-MRA).
Methods:Ten healthy volunteers (six men, four women; age range, 24–37 years; mean, 29.1) were enrolled. 4D-MRA and SP- ASL were performed on a 3T magnetic resonance imaging (MRI) scanner. Signal intensities in four cerebral arterial territories (anterior cerebral artery, middle cerebral artery, posterior cerebral artery, and whole area) were measured using both 4D-MRA and SP-ASL, and peak time of maximum intensity through each technique was recorded. Regression analysis was used to determine the correlation between the peak times using 4D-MRA and those using SP-ASL, and the regression function obtained was used to estimate the peak time for SP-ASL (optimum post-label delay) from that obtained for 4D-MRA.
Results:The peak time in anterior cerebral artery territory for SP-ASL was expressed as 1.19þ0.30(peak time of 4D-MRA) s, (p¼0.017, r2¼0.14). The peak time in middle cerebral artery territory for SP-ASL was 0.96þ0.58(peak time of 4D-MRA) s, (p<0.001, r2¼0.32). The peak time in posterior cerebral artery territory for SP-ASL was expressed as 0.92þ0.58(peak time of 4D-MRA) s, (p<0.001,r2¼0.33). The peak time in whole brain for SP-ASL was expressed as 1.04þ0.46(peak time of 4D-MRA) s, (p<0.001,r2¼0.25).
Conclusion:The peak time values at 4D-MRA showed potential for use in predicting the optimum post-label delay of SP-ASL.
Keywords
Perfusion imaging, cerebral perfusion, arterial spin labeling, post-label delay, magnetic resonance imaging
Introduction
Arterial spin labeling (ASL) has been widely applied as a magnetic resonance imaging (MRI) technique for measurement of cerebral perfusion.1,2 It is a non- invasive technique with the ability to quantify the regio- nal cerebral blood flow (CBF) without contrast enhancement.3,4 This technique involves acquisition of perfusion images by applying labeling pulses to the proximal arteries that supply the evaluation area, and subsequent subtraction of the image with labeling from that without labeling.5
Post-label delay (PLD) is the time interval between application of the labeling pulse and the readout. There are two ways to determine the optimum PLD: first, multi-phase PLD method that collects images at various lengths of PLD within one repetition time (TR); second, a single-phase PLD method that collects images at only one PLD within one TR. The multi-phase PLD method can respond to various flow rates, but it shows low signal-to-noise ratio (SNR) due to the short sampling time in each readout. In contrast, the single-phase
PLD method is routinely used, because it can measure blood flow using only one PLD and has advantages of high SNR and short imaging time. In clinical practice, a PLD of 1.5 s in single-phase ASL (SP-ASL) is usually used.6 Since the single-phase PLD method measures blood flow using only one PLD, the value of the blood flow peak obtained may be inaccurate. Previous studies have reported that in order to obtain the accurate value of the blood flow peak, two or more patterns of PLD such as 1.5 s and 2.5 s may be required.7–9
Application of the multi-phase ASL method enables acquisition of 4-dimensional magnetic resonance
1Division of Radiology, Steel Memorial Yawata Hospital, Kitakyushu, Japan
2Department of Health Sciences, Graduate School of Medical Sciences, Kyushu University, Fukuoka, Japan
Corresponding author:
Hidetake Yabuuchi, Department of Health Sciences, Graduate School of Medical Sciences, Kyushu University, 3-1-1 Maidashi, Higashi-ku, Fukuoka 812-8582, Japan.
Email: h-yabu@med.kyushu-u.ac.jp
The Neuroradiology Journal 2019, Vol. 32(3) 173–178
!The Author(s) 2019 Article reuse guidelines:
sagepub.com/journals-permissions DOI: 10.1177/1971400919834693 journals.sagepub.com/home/neu
angiography (4D-MRA) images by overlapping all slices and using the maximum intensity projection tech- nique.104D-MRA can image slow blood flow, whereas time-of-flight MRA can not clearly image slow blood flow. Since ASL has low SNR, several acquisitions are necessary to obtain adequate data, which result in a longer imaging time. In addition, it takes time to acquire SP-ASL images at various PLDs. The arrival time of the peak blood flow after application of the labeling pulse depends on the degree of stenosis of the proximal artery; thus it is difficult to estimate the opti- mum PLD for each patient. The ability to predict the
peak blood flow using 4D-MRA would be useful in a clinical practice, because it would eliminate the need to obtain multiple images using SP-ASL. Thus, the pur- pose of this study was to optimize the PLD of SP-ASL by using multi-phase ASL in 4D-MRA.
Methods and materials Subjects
Ten healthy volunteers (six men, four women; age range, 24–37 years; mean age, 29.1 years) were enrolled
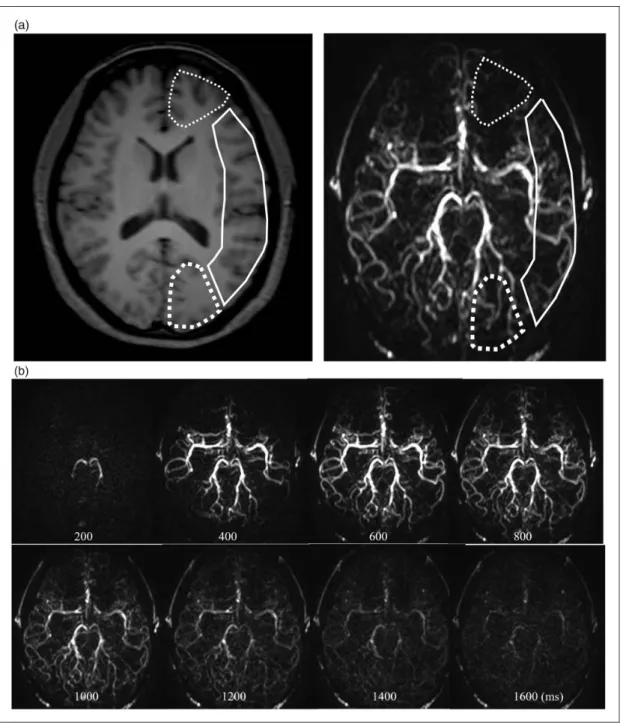
Figure 1. Multi-phase 4-dimensional magnetic resonance angiography images in a 24-year-old female volunteer. (a) Regions of interest set to include both the white matter and the grey matter avoiding the main cerebral artery for quantification of the hemodynamic parameters in the anterior cerebral artery (thin dotted line), the middle cerebral artery (solid line), and the posterior cerebral artery (thick dotted line) perfusion territory. (b) Post-label delays at 200–1600 ms with constant interval of 200 ms in 4-dimensional magnetic resonance angiography.
174 The Neuroradiology Journal 32(3)
in the study. The inclusion criteria were as follows: no present illness or treatment history of the head and neck areas; no contraindication for MR examinations, including claustrophobia; or no presence of metallic medical or electronic devices in the body. We excluded patients with metallic artificial denture or dental bridges, because of the possibility of severe susceptibil- ity artefacts in the MR images. To eliminate the
difference in blood flow due to age group, we selected the 20–39-year age group. Our institutional ethics com- mittee approved the study, and a written informed con- sent was obtained from all subjects.
MRI technique
The imaging technique was implemented on a 3T MRI scanner, (Ingenia; Philips Healthcare, Best, The Netherlands), with a 15-channel head coil. The scan ranged from the medulla oblongata to the cen- trum semiovale of the cerebrum. Pulsed ASL was used for all labeling in bilateral common carotid artery. In this study, two imaging protocols were used. The first protocol was 4D-MRA, with the following param- eters: TR, 4000 ms; echo time (TE), 9.2 ms; flip angle, 35; slice thickness/gap, 8/0 mm; field of view (FOV), 240240 mm; acquisition matrix, 176134;
acquisition voxel size, 1.36/1.78/8.0 mm; SENSitivity Encoding (SENSE) factor, 3.5; defined phases, 14;
PLD, 200–2800 ms with constant interval of 200 ms;
number of signal averaging, six; number of slices, eight; scan time, 2 min 40 s. The second protocol was SP-ASL, with the following parameters: TR, 4000 ms; TE, 20 ms; flip angle, 90; slice thickness/
gap, 8/1 mm; FOV, 240240 mm; acquisition matrix, 112110; acquisition voxel size, 2.14/2.18/
8.0 mm; SENSE factor, 2; defined phases, 5; PLD, 1200–2000 ms with constant interval of 200 ms;
number of signal averaging, 30; number of slices, eight; scan time, 4 min 8 s.
MRI analysis
We analyzed all MR images using a commercial work- station (Virtual Place, AZE, Tokyo, Japan). Regarding
Figure 3. Spearman’s rank correlation coefficient between observer 1 and observer 2 shows moderate to strong agreement in evaluation of the peak time of maximum signal intensity at both (a) 4-dimensional magnetic resonance angiography (r¼0.61,p<0.001) and (b) single-phase arterial spin labeling (r¼0.54,p<0.001).
Figure 2. Single-phase arterial spin labeling image in a 24-year- old female volunteer. The post-label delay was 1600 ms. Regions of interest set to include both the white matter and the grey matter for quantification of the hemodynamic parameters in the anterior cerebral artery (thin dotted line), the middle cerebral artery (solid line), and the posterior cerebral artery (thick dotted line) perfusion territory.
the analysis of 4D-MRA images, two authors (TO and MO, with 13 and 5 years of experience in neuroradiol- ogy, respectively) independently set the regions of inter- est in the brain parenchyma by referring to the T1- weighted image, excluding the main cerebral artery (Figure 1(a)). The signal intensities were measured at the level of the basal ganglia in three groups: the bilat- eral anterior cerebral artery (ACA) territory, the middle cerebral artery (MCA) territory, and the posterior cere- bral artery (PCA) territory (Figure 1(a)). These ana- lyses were repeated in eight phases of PLD (every 200 ms at 200–1600 ms) of 4D-MRA (Figure 1(b)), and the peak time of maximum intensity in each terri- tory was recorded. Subsequently, the average signal intensity of the whole brain region and corresponding peak time were calculated. In addition, we measured signal intensities using SP-ASL in the three brain terri- tories in the same manner as that for 4D-MRA (Figure 2), and the peak time of maximum intensity in each territory was recorded.
Statistical analysis
Inter-observer agreement regarding the evaluation of signal intensity in each territory was assessed using Spearman’s rank correlation coefficient and Bland–
Altman plot. Limits of agreement in terms of overall mean value and 95% confidence intervals (CIs) were calculated by using Bland–Altman analysis.11For esti- mation of the peak time at maximum signal intensity in each territory in SP-ASL, we used Y¼aXþb, as a linear function of X, the peak time at maximum signal intensity of 4D-MRA. The coefficient and R value were calculated by linear regression analysis using the least-squares method to assess the optimum PLD of SP-ASL. Statistical package for the social
sciences (SPSS version 23, Chicago, IL, USA) software was used to analyze the raw data. Apvalue<0.05 was considered to indicate a statistically significant difference.
Results
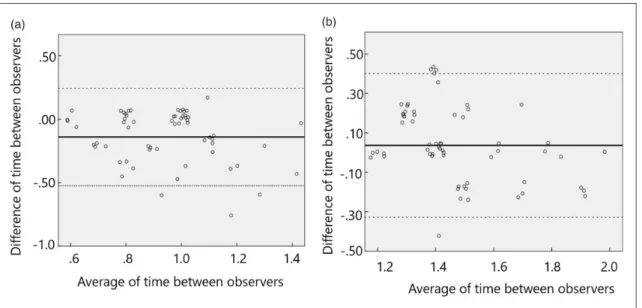
With regard to the inter-observer agreement in meas- urement of the peak time of signal intensity at each territory, Spearman’s rank correlation coefficient for the two observers was 0.61 (p<0.001) for 4D-MRA (Figure 3(a)), and 0.54 (p<0.001) for SP-ASL (Figure 3(b)), indicating moderate to strong inter- observer agreement. Bland–Altman plots are shown in Figure 4(a) and (b) with 95% limits of agreement for the measurement of peak time of signal intensity at 4D- MRA in Figure 4(a), and those using SP-ASL in Figure 4(b). Bland–Altman plots showed the mean difference (solid line) of inter-observer variabilities in measure- ment of the peak time in 4D-MRA, and the limits of agreements (1.96 standard deviations, dotted lines) were –0.52 s to 0.24 s (mean, –0.14; 95% CI, 0.95 1.07s) (Figure 4(a)). The limits of agreement (1.96 standard deviations, dotted lines) of inter-observer variabilities in measurement of the peak time at SP- ASL were –0.33 s to 0.40 s (mean, 0.04; 95% CI, 1.391.51s) (Figure 4(b)).
Representative SP-ASL images are shown in Figure 5. The peak time of signal intensities in each region of the brain was 1.010.22 s for 4D-MRA and 1.500.18 s for SP-ASL in the ACA territory;
0.880.20 s for 4D-MRA and 1.450.20 s for SP- ASL in the MCA territory; 0.950.22 s for 4D-MRA and 1.450.25 s for SP-ASL in the PCA territory;
0.940.22 s for 4D-MRA and 1.470.21 s for SP- ASL in the whole brain.
Figure 4. Bland–Altman plots show the value difference against value average between observer 1 and observer 2 at (a) 4-dimensional magnetic resonance angiography and at (b) single-phase arterial spin labeling. Solid lines show the average measurement difference and dotted lines show 95% limits of agreement.
176 The Neuroradiology Journal 32(3)
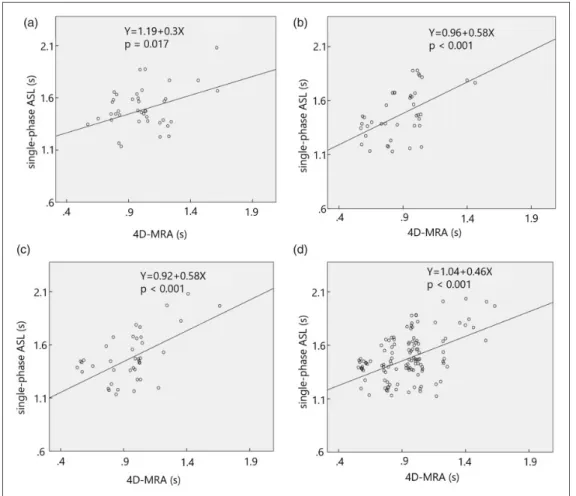
The peak time in the ACA territory of SP-ASL was expressed as 1.19þ0.30(peak time of 4D-MRA) s, (p¼0.017,r2¼0.14) (Figure 6(a)); the peak time in the MCA territory of SP-ASL was expressed as 0.96þ0.58(peak time of 4D-MRA) s, (p<0.001, r2¼0.32) (Figure 6(b)); the peak time in PCA territory was shown as 0.92þ0.58(peak time of 4D-MRA) s, (p<0.001, r2¼0.33) (Figure 6(c)); the peak time in whole brain was expressed as 1.04þ0.46(peak time of 4D-MRA) s, (p<0.001,r2¼0.25) (Figure 6(d)).
Discussion
In general, SP-ASL images are obtained by using a fixed PLD. Therefore, we have to obtain SP-ASL images with an estimated PLD when the blood flow of the labeled artery is expected to be slow. Previous studies have determined the value of PLD by the patients’ age,12 gender13 and underlying diseases.14 However, even with these modifications, the blood flow parameters derived from SP-ASL might show sub- stantial variation in response to changes in the PLD;
Figure 6. Linear regression analysis shows a significant relationship in the peak times between the 4- dimensional magnetic resonance angiography and the single-phase arterial spin labeling at (a) the anterior cerebral artery territory (Y¼1.19þ0.3X, p¼0.017,r2¼0.14), at (b) the middle cerebral artery territory (Y¼0.96þ0.58X, p<0.001,r2¼0.32), at (c) the posterior cerebral artery territory
(Y¼0.92þ0.58X, p<0.001,r2¼0.33) and at (d) the whole brain (Y¼1.04þ0.46X, p<0.001,r2¼0.25).
Figure 5. Single-phase arterial spin labeling image in a 24-year-old female volunteer with post-label delays at 1200–2000 ms with constant interval of 200 ms.
in addition, it is unclear whether the degree of stenosis of the blood vessel affects the quantitative parameters, or whether the accurate peak of the blood flow can be imaged under a fixed PLD.
In this study, the results indicated that the optimum PLD that corresponded to the peak flow in the brain parenchyma could be predicted using 4D-MRA. This procedure might enable robust PLD settings that are unaffected by the blood flow of the labeled artery in the neck, and accurate measurement of the CBF in each cor- responding territory through the use of SP-ASL with opti- mum PLD. In previous studies, the PLD was determined based on the patients’ age, sex and underlying dis- eases.12–14The proposed method shows superior perform- ance to that of the conventional method, because the optimum PLD can be predicted regardless of the patients’
age, sex and underlying diseases by using 4D-MRA.
Moreover, our method has the advantage of shor- tened imaging time. In this study, we could optimize the PLD in each vascular territory; thus, we can set the optimum PLD according to each territory in SP-ASL;
however, imaging through use of optimized SP-ASL requires a prolonged procedural time, because of the need to consider various types of PLD. The optimum PLD can be obtained immediately with the proposed method using 4D-MRA, thereby shortening the ima- ging time.
Our study has some limitations. First, the number of subjects was relatively small (n¼10). Second, we only investigated healthy young volunteers; therefore, it is unclear whether our proposed method can be adapted to patients with underlying diseases such as arterioscler- osis, vasculitis and hypertension. Third, the CBF in each territory in SP-ASL under the condition of opti- mized PLD derived from 4D-MRA is not validated in comparison with that obtained using contrast-enhanced perfusion MRA.
Future study is required to validate the proposed method in a large number of elderly patients with arteriosclerosis. Despite its limitations, this is the first study, to our knowledge, to optimize the PLD of SP- ASL with reference to 4D-MRA, which could lead to shortening the imaging time. Since ASL does not require the use of a contrast agent and is minimally invasive, it has an inherent advantage in that imaging can be repeated. This method enables imaging under optimum PLD for each patient.
In conclusion, predicting the optimum PLD of SP- ASL by referring to 4D-MRA images shows potential for use in the clinical setting.
Conflict of interest
The authors declared no potential conflicts of interest with respect to the research, authorship, and/or publication of this article.
Funding
The authors received no financial support for the research, authorship, and/or publication of this article.
ORCID iD
Hidetake Yabuuchi http://orcid.org/0000-0002-8314-1858
References
1. Detre JA, Leigh JS, Williams DS, et al. Perfusion ima- ging.Magn Reson Med1992; 23: 37–45.
2. Detre JA, Alsop DC, Vives LR, et al. Noninvasive MRI evaluation of cerebral blood flow in cerebrovascular dis- ease.Neurology1998; 50: 633–641.
3. Williams DS, Detre JA, Leigh JS, et al. Magnetic reson- ance imaging of perfusion using spin inversion of arterial water.Proc Natl Acad Sci USA1992; 89: 212–216.
4. Calamante F, Thomas DL, Pell GS, et al. Measuring cerebral blood flow using magnetic resonance imaging techniques.J Cereb Blood Flow Metab1999; 19: 701–735.
5. Detre JA and Alsop DC. Perfusion magnetic resonance imaging with continuous arterial spin labeling: methods and clinical applications in the central nervous system.
Eur J Radiol1999; 30: 115–124.
6. Dai W, Robson PM, Shankaranarayanan A, et al.
Reduced resolution transit delay prescan for quantitative continuous arterial spin labeling perfusion imaging.
Magn Reson Med2012; 67: 1252–1265.
7. Liu Y, Zeng X, Wang Z, et al. Different post label delay cerebral blood flow measurements in patients with Alzheimer’s disease using 3D arterial spin labeling.
Magn Reson Imaging2015; 33: 1019–1025.
8. Akiyama T, Morioka T, Shimogawa T, et al. Arterial spin-labeling magnetic resonance perfusion imaging with dual postlabeling delay in internal carotid artery steno-occlusion: validation with digital subtraction angi- ography.J Stroke Cerebrovasc Dis2016; 25: 2099–2108.
9. Dai W, Fong T, Jones RN, et al. Effects of arterial transit delay on cerebral blood flow quantification using arterial spin labeling in an elderly cohort.J Magn Reson Imaging 2017; 45: 472–481.
10. Bi X, Weale P, Schmitt P, et al. Non-contrast enhanced four-dimensional (4D) intracranial MR angiography: a feasibility study.Magn Reson Med2010; 63: 835–841.
11. Bland JM and Altman DG. Statistical methods for assessing agreement between two methods of clinical measurement.Lancet1986; 1(8476): 307–310.
12. Fujiwara Y, Matsuda T, Kanamoto M, et al.
Comparison of long-labeled pseudo-continuous arterial spin labeling (ASL) features between young and elderly adults: special reference to parameter selection. Acta Radiol2017; 58: 84–90.
13. Parkes LM, Rashid W, Chard DT, et al. Normal cerebral perfusion measurements using arterial spin labeling:
reproducibility, stability, and age and gender effects.
Magn Reson Med2004; 51: 736–743.
14. Liu Y, Zeng X, Wang Z, et al. Different post label delay cerebral blood flow measurements in patients with Alzheimer’s disease using 3D arterial spin labeling.
Magn Reson Imaging2015; 33: 1019–1025.
178 The Neuroradiology Journal 32(3)