九州大学学術情報リポジトリ
Kyushu University Institutional Repository
Biochar/lignin-Assisted Water Electrolysis for Hydrogen Production
陳, 立
https://doi.org/10.15017/4060198
出版情報:九州大学, 2019, 博士(工学), 課程博士 バージョン:
権利関係:
Biochar/Lignin-Assisted Water Electrolysis for Hydrogen Production
By Li Chen
Department of Applied Science for Electronics and Materials Interdisciplinary Graduate School of Engineering Sciences
Kyushu University
2020
Chapter 1: Introduction ... 1
1.1 Prospect of hydrogen as energy carrier ... 1
1.2 Hydrogen production technologies ... 4
1.3 Water electrolysis for hydrogen production ... 5
1.4 Carbon assisted water electrolysis ... 10
1.5 Biomass gasification ... 13
1.6 Lignin/biochar-assisted water electrolysis ... 16
1.6.1 Electrolysis of lignin dissolved alkaline water ... 16
1.6.2 Biochar-assisted acidic water electrolysis ... 20
1.7 Objective and outline of this study ... 23
1.8 References ... 25
Chapter 2: Lignin-Assisted Water Electrolysis ... 28
2.1 Experimental conditions... 28
2.1.1 Materials... 28
2.1.2 Electrolysis and analysis ... 30
2.2 Evaluation of potential of lignin and model compounds of lignin unit as oxidizable material by LSV ... 34
2.3 Evaluation of continuous electrolysis ... 39
2.4 Analysis of the mechanism of electrochemical oxidation of lignin ... 44
2.5 Conclusions ... 49
2.6 References ... 51
Chapter 3: Biochar-Assisted Water Electrolysis ... 52
3.1 Experimental conditions... 52
3.1.1 Materials... 52
3.1.2 Electrolysis and analysis ... 56
3.2 Evaluation of potential of biochar as oxidizable material by LSV ... 58
3.3 Evaluation of continuous electrolysis ... 64
3.4 Consideration of biochar-assisted water electrolysis toward process design ... 70
3.5 Conclusions ... 74
3.6 References ... 75
Chapter 4: General Conclusions and Future Prospects ... 76
Acknowledgements ... 79
Appendixes ... 80
1
Chapter 1: Introduction
1.1 Prospect of hydrogen as energy carrier
Recently, the demand of primary energy such as petroleum, natural gas and coal is exponentially increasing due to economic growth and world population increase. IEA expects in World Energy Outlook 20151 that the primary energy demand will increase with the growth of economics and world population until 2030, as shown in Figure 1-1, especially in developing countries because of the rapid development. IEA also expects that the annual use of renewable energy for power generation will increase from 2013 to 2030, as shown in Figure 1-21. High-efficiency use of primary energy and development of renewable energy are considered to solve the most severe problem, which is caused by the shortage of the main energy source, i.e., fossil fuel, and its non-environmental friendly property. Some new processing, such as IGCC (integrated coal gasification combined cycle) and SOFC Triple combined Cycle System2, have been developed to efficiently utilize coal and natural gas for large-scale power generation.
Figure 1-1. Transit and prediction of world energy demand
0 2000 4000 6000 8000 10000 12000 14000 16000 18000
1990 2013 2030
Global energy demand, Mtoe
Rest of non-OECD India
Middle East China OECD
2
Figure 1-2. Change in electric generating capacity from 2013 to 2030
Development of distributed power system such as small- or medium-scale power generation has attracted attention for avoiding supply disruption of electric caused by disasters. The renewable energy for small- or medium-scale power generation consists mainly of geothermal energy, wind energy, direct solar energy, hydropower, and biomass.
Biomass has been used as fuel for power generation and heat supplies and fertilizer for soil, and the proportion of world’s energy supplied by biomass reached as high as 10.2%
in 2013 according to Figure 1-33. In particular, EU and U.S. have developed the renewable energy system actively. About 80-85% of biomass energy in EU is from solid biomass resources, thus the development of high-efficiency utilization for solid biomass resources is one of the most important takes in the world.
Figure 1-3. World primary energy supply in 2013
-2000 0 2000 4000 6000 8000 10000
China E. China/
Non-OECD Asia United States European Union
Electric generating capacity, TWh
Coal Gas Nuclear Renewable
21.4%Gas
Renewable Energy 13.8%
28.9%Coal 31.1%Oil
Nuclear Energy 4.8%
Biomass 10.2%
Geothermal, Wind, Solar energy
1.2%
Hydropower 2.4%
3
We have to make a proper choice of methods of the energy storage for effectual use of variety energy including renewable energy. It is not recommended to use single methods of energy storage. The parallel use of methods can give high energy safety in handling of enormous energy4. It is a serious problem to develop an industry especially for resource- poor country such as Japan. Hydrogen (H2) is one of the attractive method of energy storage because it can be produced from a variety of feedstocks such asfossil resources, biomass and electrical power5. H2 also can give advantages when it is handled because of combustion with no reduction of CO2 and conservation in high energy intensity6. New Energy and Industrial Technology Development Organization (NEDO) had predicted the increase of Japanese market size of H2 technologies in 2014 as shown in Figure 1-47. According to the prediction, the fields of H2 as material and infrastructure consist more than 50% of total market size. It means that progression of technologies of energy production and storage has significant role in H2 energy system.
Figure 1-4. Prediction of increase of Japanese market size of H2 technologies 0
1 2 3 4 5 6 7 8 9
2020 2030 2040 2050
Market size, trillion yen
Hydrogen
Infrastructure for supply
Power generation by hydrogen Fuel-cell vehicle Stationary fuel-cell
4
1.2 Hydrogen production technologies
Currently, the most developed and used technologies for H2 production are based on fossil fuel processing technologies. These technologies convert hydrogen-containing materials derived from fossil fuels, such as gasoline, hydrocarbons, methanol, or ethanol, into a H2-rich gas stream.
However, In order to decrease the dependence on fossil fuels, significant developments in other H2 generation technologies from renewable resources such as biomass and water are considered.Table 1-18 summarizes the technologies along with their feedstock used and efficiencies obtained. The fundamental question lies in the development of alternative technologies for H2 production to those based on fossil fuels, especially for its utilization as a fuel in the transportation sector. This problem can be faced by the utilization of alternative renewable resources and related methods of production, such as the gasification or pyrolysis of biomass, electrolytic, photolytic, and thermal cracking of water8. However, for industrial perspective, both technological possibilities and economic impacts should be considered. For example, photolysis for cracking of water to H2 is environmentally friendly but its efficiency is still very low (under 1%), which is far away from the standard line for industrial use. It is thus clear that the processes to be taken into account must consider not only environmental concerns but also favorable economics for industrial use. Water electrolysis technology and biomass gasification technology for H2 production are both environmentally friendly and have industrial maturity, but still face the problems for wide application. In this work, discussions and proposals will be focused on these two technologies in following chapter.
5
Table 1-1. H2 production technologies summary
Technology Feedstock Efficiency Maturity
Steam reforming Hydrocarbons 70–85% Commercial Partial oxidation Hydrocarbons 60–75% Commercial Autothermal reforming Hydrocarbons 60–75% Near term
Plasma reforming Hydrocarbons 9–85%* Long term
Biomass gasification Biomass 35–50% Commercial
Aqueous phase reforming Carbohydrates 35–55% Med. term Water electrolysis H2O +
electricity
50–70% Commercial
Photolysis H2O + sunlight 0.5%* Long term Thermochemical water splitting H2O + heat NA Long term
* H2 purification is not included.
1.3 Water electrolysis for hydrogen production
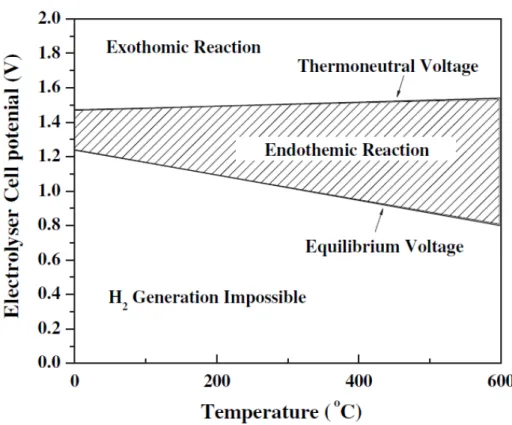
Water electrolysis is a process of splitting water into H2 and O2 by applying a direct current as shown in Equation 1-1 and 1-2 respectively. The equations means that the water electrolysis reaction progresses with electron transfer. The electrolysis reaction can be carried out by applying of energy more thanenthalpy change of reaction (ΔrH), for example, 285.8 kJ/mol at 25 °C. The ΔrH can be converted to 1.48 V that is called thermoneutral potential. The ΔrH of water electrolysis is defined as shown in Equation 1-39 because the reaction is endothermic reaction. The Gibbs free energy (ΔrG) is supplied by electrical energy generally and can be converted 1.23 V (at 25 °C) that is
6
called equilibrium potential, or standard potential. Figure 1-510 shows relationship between temperature and electrolyzer cell potential. It also describes behavior of reaction and thermoneutral potential associated with operating temperature. As shown in the figure, equilibrium potential/standard potential can be decreased by increase of function of heat energy if the electrolysis is carried out in high temperature. It means that water electrolysis is conversion of electrical and heat energy into chemical energy.
Cathode: 2H2O (l) + 2e- → H2 (g) + 2OH-
Anode: 2OH-→ 1/2O2 (g) + H2O (l) + 2e- Equation 1-1.
Total: H2O (l) → 1/2O2 (g) + H2 (g)
Cathode: 2H+ + 2e- → H2 (g)
Anode: H2O (l) → 1/2O2 (g) + 2H+ + 2e- Equation 1-2.
Total: H2O (l) → 1/2O2 (g) + H2 (g)
ΔrH = ΔrG (Gibbs free energy) + TΔS Equation 1-3.
7
Figure 1-5. Relationship between temperature and electrolyzer cell potential
In actual operation of water electrolysis, three types of additional potential that called overpotential is needed to carry out the electrolysis reaction as shown in Figure 1-610. Resistance overpotential is caused by ohmic loss that associates to electrodes and electrolyte. Activation overpotential is caused by difficulty of electrons transfer between electrode and reactants. Activation energy and operating temperature are typical function associates to the activation overpotential. In addition, concentration overpotential is observed in the operation at high current density. It can be reduced by use of catalysts and increase of operating temperature. Diffusion overpotential is caused mainly by the decrease of concentration of the reactants on electrodes and the occupancy of electrode surface by evolved bubble. The increase of transport rate, in other words, diffusion rate and concentration of reactants and the optimized electrode configuration can prevent
8
appearance of diffusion overpotential.
Figure 1-6. Typical configuration of overpotentials in water electrolysis
Alkaline electrolysis is a mature technology that has a significant operating record in industrial applications11. Water electrolysis can work suitably at distributed small-scale plant and, by using electricity from renewable energy because water electrolysis has brief electrolyzer12, the flexibility to variation of input-electricity and principle that is H2
production with no emission of CO2. It is expected that distributed energy production, conversion, storage and using system for remote communities will prevail in the near future. Figure 1-711 shows conceptual schematic illustration of the small-scale system.
9
Figure 1-7. Conceptual schematic illustration of a distributed energy system with water electrolysis
Future potential costs of H2 production by electrolysis are important subject for commercial use. The electricity consists 80% or more of total production cost of H2 in electrolysis plants5. A lot of upgrades has represented against to the problem by improvement of energy efficiency of electrolysis. Upgrade of electrode, electrolyte and catalyst, and electrolysis of steam in high temperature (800 °C -1000 °C) are typical ideas12 for an improvement. The U.S. Department of Energy expects production cost reduction of H2 to economic value, 2 dollars per kilogram, as shown in Figure 1-84. However it is noted here that, the most of the electricity produced is based on fossil energy sources that can produce electricity in relatively low cost than power generation by renewable energy13, 14. It means that much more energy efficiency improvement of water electrolysis is needed to achieve a H2 production with no emission of CO2. The water electrolysis using assist of chemical energy of carbon is one of the interesting and
Water electrolysis
Storage of Hydrogen Intermittent
electricity Renewable Energy
(Solar, Wind etc.)
Excess electricity
End use of fuel gas End use of
electricity
Power from fuel-cell
For power shortage
10
effective method to achieve it.
Figure 1-8. Future potential costs of H2 production by electrolysis
1.4 Carbon assisted water electrolysis
Carbon assisted water electrolysis, hereafter referred to as CAWE, is the technique that has been investigated since 70’s15 to enhance the energy conversion efficiency from electricity and/or coal to H2. The sulfuric acid solution that is mixed with solid carbon is used as oxidizable material in this type of water electrolysis. Carbon is oxidized to CO2
with water at anode, on the other hand, cathode reaction is not changed as shown in Equation 1-415. The ΔrH (at 25 °C) of oxidation from 1/2C(s) to 1/2CO2 (g) is -196.8 kJ/mol16. Then the standard potential can be reduced to 0.21 V at 25 °C compared to 1.23 V for conventional water electrolysis by assist of chemical energy of carbon. Figure 1- 917 shows prediction of the electrolyzer cell potential and percentage of the input-
11
electricity savings in conventional and CAWE at commercial current densities. The electrolyzer cell potential means sum of standard potential and overpotential in the figure.
The relationship of potentials and current densities is assumed based on typical performance18, 19 of electrolysis of acidic water. As described in the figure, chemical energy of carbon can reduce the input-electricity by 60% at 1.0 A/cm2 that is range of commercial operating condition.
Cathode: 2H+ + 2e- → H2 (g)
Anode: 1/2C (s) + H2O (l) → 1/2CO2 (g) + 2H+ + 2e- Equation 1-4.
Total: 1/2C (s) + H2O (l) → 1/2CO2 (g) + H2 (g)
Figure 1-9. Prediction of the interelectrode potential and percentage of the input- electricity savings in conventional and CAWE at commercial current densities
20 40 60 80 100
0 0.4 0.8 1.2 1.6 2
0 0.2 0.4 0.6 0.8 1
Input-electricity savings, %
Electrolyser cell potential, V
Current density, A/cm2 Conventional water electrolysis
Carbon-assisted water electrolysis Input-electricity savings
12
CAWE is a process that can integrate electrical energy and chemical energy of carbon into chemical energy of H2 as shown in Figure 1-10, and can be expressed as the electrochemical gasification of carbon resources at ambient temperature because it can convert carbon resources to H2 and CO2 at ambient temperature. In addition, the electrolysis can produce H2 selectively by separation of CO2 that is relatively easy compared to conventional thermochemical gasification of carbon resources15. The distributed energy system with water electrolysis shown in Figure 1-7 can obtain more suitability by use of CAWE if electricity and H2 becomes mainstream of medium of energy infrastructure.
Figure 1-10. Flow diagram of the principle of integration of electrical and chemical energy via CAWE
However, the advantage of energy integration can be obtained in limited condition in practical operation. The current density of CAWE is clearly lower than that of commercial process17, 20, 21. Large interelectrode potential, in other words, increase of overpotential could benefit the current density of CAWE. However, In the case of the interelectrode
Water
Carbon resources (Chemical energy)
Carbon-assisted water electrolysis Energy integration
H2
(Chemical energy) Electricity
(Electrical energy)
13
potential is larger than 1.6 V, current density of CAWE is almost the same value as that of conventional water electrolysis. The limited performance is possibly caused by low frequency of contact of oxidizable material, solid carbon with electrode surface22, 23.
1.5 Biomass gasification
Gasification is thermochemical process, which converts various solid carbonaceous resources into syngas including H2. Figure 1-11 shows the conceptual diagram of the biomass gasification process. Biomass is pyrolyzed into condensable organic matter (tar) and non-condensable gases, and carbonaceous solid (char) in the primary step. Then, in the secondary step, volatiles and char are reformed and/or gasified by the reforming/gasifying agents such as oxygen (O2) and steam into syngas, H2 and carbon monoxide (CO). Many different types of biomass gasification have so far been proposed and developed toward effective production of fuel gas, syngas or H2 as shown in Table 1-26. Progress in research and development is reaching cold gas efficiencies as high as 90% or even higher24. A particular type of biomass gasification in a gas-solid system, termed Type IV gasification25, 26, can attain a gloss cold-gas efficiency (stand-alone) as high as 96%-LHV by optimizing reactor configuration and rearranging parallel and consecutive thermochemical/catalytic reactions, while the gasification needs heat supply from an exothermic downstream process (water-gas shift, liquid synthesis or combustion) for generating sufficient amount of steam. It is also reported in the past review24 that catalytic hydrothermal gasification (CHTG) of biomass-derived water-soluble material (biomass-derived oils, lignin, etc.) 27, 28, 29 can be performed even at efficiency of around 100%, which results from the nature of chemical reactions and absence of latent heat of
14
water.
Figure 1-11. Conceptual diagram of biomass gasification process
Table 1-2. Current main types of Gasifiers
Actually, most types of biomass gasification has specific problems in a scheme from feeding of biomass to demand of fuel gas. Firstly, the gasification need heat-resistant and/or pressure-resistant furnace as the result of running in a high temperature and/or high pressure4. The biomass resources is dispersed geographically as shown in Figure 1-1230, then the shortage makes distributed gasification and power generation process such as household system difficult. Secondly, the thermal efficiency of gasification depends on
Gasifier Downdraft Updraft Bubbling fluidized bed Circulating fludized bed Entrained flow bed Twin fludized bed Technology Simple and
proven.
A simple reactor with relatively low investment cost.
Plants with higher
investment costs. Proven technology
with coal Complex construction Complex construction Maximum fuel
moisture, % 25 60 55 55 15 11-25
LHV of gas, MJ/Nm3 4.5-5.0 5-6 3.7-8.4 4.5-13 4-6 5.6-6.3
Tar, g/Nm3 0.015-3.0 30-150 3.7-61.9 4-20 0.01-4 0.2-2
Ash and particles
in syngas Low High High High Low High
Reaction temp., ℃ 1090 1090 800-1000 800-1000 1990 800-1000
15
scale of plants31. Therefore the running cost of biomass gasification plants increases with scale down of plants. It causes further increase in the size of biomass gasification plants.
Finally, the thermochemical gasification of carbon resources needs separation of CO2, sulfur removal and particles separation of syngas for downstream applications such as fuel-cell, internal combustion engine and secondary conversion into liquid fuels or chemicals32, 33. It decreases total efficiency of conversion of biomass to fuel and materials, and increases its total cost. As described above, the biomass gasification that running at ambient temperature and can produce pure fuel gas is desirable process ideally.
Figure 1-12. The world distribution of woody biomass resources
16
1.6 Lignin/biochar-assisted water electrolysis
In this study, lignin and biomass-derived char (biochar) are suggested to be the excellent oxidizable materials to assist water electrolysis for H2 production. In this type of electrolysis, both materials are oxidized, in other words, electrochemically gasified at ambient temperature and pure H2 can be produced by integration of electrical energy and chemical energy of biomass. Furthermore, their assisted water electrolysis processes can be effectively combined with other biomass conversion processes. The details will be described as followings.
1.6.1 Electrolysis of lignin dissolved alkaline water
Lignin is aromatic complex polymer that frames a cell wall of wood and bark. The content percentages of lignin are 25-35% in soft wood, 20-25% in hardwood and 15-25%
in particular grass plant, respectively. Lignin is polymerized from mainly three types of lignin monomer that called monolignols, namely, coniferyl alcohol, sinapyl alcohol and p-coumaryl alcohol34, and each monolignols has aromatic core unit, guaiacyl unit (G unit), syringyl unit (S unit) and p-hydroxyphenyl unit (H unit), respectively34. Figure 1-1335 shows structure of monolignols and core units. Table 1-334 shows composition of monolignols in different species of plants. The molecular weight of lignin ranges from several hundreds to several thousands because a number of monolignols are connected with ether (C-O-C) and carbon-carbon (C-C) bonds randomly as shown in Figure 1-1434. The large-molecular weight and complex structure make use of lignin difficult.
17
Figure 1-13. Structure of monolignols and aromatic core units
Table 1-3. Composition of monolignols in different species of plant
18
Figure 1-14. Example of structure of lignin
Alkaline lignin solutions, in other words, black liquors are produced inevitably in Kraft pulping processes, which are most typical ones to produce pure cellulose fibers, the main component of paper. Electrolysis of alkaline lignin solution is the technique that uses lignin as oxidizable material dissolving in sodium hydroxide (NaOH) solution36, 37. It almost equals to electrolysis of black liquor produced from Kraft pulping processes.
Lignin is oxidized to CO2 and/or oxidized lignin such as low-molecular weight organic compounds with hydroxide ion (OH-) at anode, on the other hand, cathode reaction is not changed as shown in Equation 1-538. It can be assumed that products from electrochemical oxidation of lignin depend on potential of anode and type of lignin
19
because there are some aromatic units and functional groups that have different specific reactivity. As with CAWE, the standard potential of alkaline water electrolysis, 1.23 V can be reduced by chemical energy of lignin38. It means that electrolysis of alkaline lignin solution can be classified into CAWE, gasification of lignin at ambient temperature, selective H2 production and reduction of input-electricity in water electrolysis for H2
production. Additionally it has two specific advantages, low-value material and oxidizable material dissolving in solution that previous CAWE doesn’t have. Former can reduce a cost of H2 produced from water electrolysis effectively. Latter can increase oxidation reaction rate of oxidizable material and thus H2 production rate potentially. As mentioned in Chapter 1.3, performance of CAWE is limited by the contact between carbon solid and electrode. Use of lignin that can dissolve in aqueous solution instead of solid carbon is one of the promising method to resolve this problem.
Currently there is no record and idea of introduction of this electrolysis to practical use even though it seems quite promising. Dissolution of lignin promises certainly increase of H2 production rate, however the large-molecular weight of lignin decreases diffusion rate and complex structure makes analysis of the electrochemical oxidation and improvement difficult. It is believed that practical use of electrolysis of alkaline lignin solution will realize if above problems are resolved.
Cathode: 4H2O (l) + 4e- → 2H2 (g) + 4OH-
Anode: 4OH-+ L → 2H2O (l) + 4e- + CO2 and/or Ox-L Equation 1-5.
Total: 2H2O (l) → 2H2 (g) + CO2 and/or Ox-L (L: lignin, Ox-L: oxidized lignin)
20
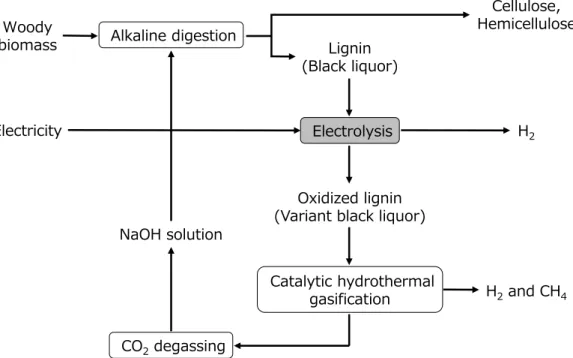
Besides, the CHTG can convert oxidized lignin to H2 and CH4 after electrolysis.
Therefore, we give a proposal of complete gasification process of lignin via electrolysis and CHTG as shown in Figure 1-15. Lignin is converted to fuel gas and NaOH continues to circulate in the gasification process. Additionally, if the electricity is produced from renewable energy, the process can realize a distributed energy system that uses H2 and electricity as energy infrastructure and furthermore with no emission of CO2.
Figure 1-15. Complete gasification process of lignin via electrolysis and CHTG
1.6.2 Biochar assisted acidic water electrolysis
In generally, biochar is defined as carbon-rich solid formed by the pyrolysis of biomass39, or other process like hydrolysis. Biochar is a candidate to apply to assist water electrolysis due to the following three reasons. Firstly, it is expected that the biomass has
Woody biomass
Cellulose, Hemicellulose Lignin
(Black liquor)
Electrolysis
Oxidized lignin (Variant black liquor)
Catalytic hydrothermal gasification Alkaline digestion
CO2degassing NaOH solution
H2
H2and CH4
Electricity
21
not only chemical but also electrochemical activity higher than well-carbonized or graphitized carbon materials such as carbon black as well as graphite. As shown in Table 1-4, standard potentials for the water electrolysis with aromatic hydrocarbons are clearly smaller than that with C as graphite. Biochar is generally rich in aromatic hydrocarbons, and the structure is far from that of graphite.
Secondly, high electrochemical activity of the biochar is also expected from its large specific surface area of 500 m2/g or greater even without subsequent gasification. Unlike the traditional electrolysis with the interface only between electrode and electrolyte, CAWE occurs at the phase boundaries among the electrode, electrolyte and carbon. This indicates greater surface area of carbon positively affects CAWE. In the present paper, the authors discuss the relationship between the performance of CAWE and the specific surface area of biochar.
Table 1-4. Standard potential for H2 production by water electrolysis in the presence of carbon and aromatic hydrocarbons
Substance Overall stoichiometry Standard potential, V
C C + 2H2O = CO2 + 2H2 0.210
Benzene (1/6)C6H6 + 2H2O = CO2 + 2.5H2 0.155
Naphthalene (1/10)C10H8 + 2H2O = CO2 + 2.4H2 0.157
Anthracene (1/14)C14H10 + 2H2O = CO2 + 2.36H2 0.157
Pyrene (1/16)C16H10 + 2H2O = CO2 + 2.31H2 0.163
Coronene (1/24)C24H12 + 2H2O = CO2 + 2.25H2 0.171
22
Thirdly, the biochar-assisted water electrolysis, can effectively be combined with other biomass conversion processes. Figure 1-16 shows an example of system that combines biomass gasification and biochar-assisted water electrolysis. In this system, biomass is endothermically converted into syngas by the CO2 gasification that is driven by the solar or wind power-derived joule heat. This gasification integrates the heat and the biomass chemical energy into the chemical energy of syngas while supplying biochar to, and accepting CO2 for electrolysis, which integrates the power and the chemical energy of the biochar into the chemical energy of H2. Assuming that the major fate of the syngas is chemicals/material, this system is carbon negative.
Figure 1-16. Conceptual diagram of a system of biomass conversion
As mentioned in Chapter 1.5, Type IV gasification of gasification can produce syngas from biomass with an efficiency as high as 96%. However, even by applying this type of gasification, the carbon conversion into CO is limited because of necessity of exothermic O2 gasification (or combustion) together with endothermic CO2 or steam gasification.
23
The above-mentioned joule-heat-driven CO2 gasification is attractive for maximization of syngas yield with respect to carbon, although such gasification requires cheap solar/wind power. In the proposed system, the biochar can circulate between the gasification and electrolysis until complete conversion. This circulation is effective, and even necessary, as reported in detail later. As also reported in this paper, it is difficult to gasify the biochar completely by electrolysis due to accumulation of oxygen functional groups on its surface. The gasification can recuperate ‘deactivated biochar’ by removing those functional groups, and furthermore, develop the surface area.
1.7 Objective and outline of this study
This study aimed to evaluate the performance of lignin and biochar as the oxidizable material to assist water electrolysis for H2 production. In Chapter 2, linear sweep voltammetry, hereafter referred to as LSV, and continuous electrolysis were conducted to evaluate a potential of lignin and model compounds as oxidizable material in alkaline water electrolysis. Especially, last examination has significant evaluation because there is no report about the operation close to practical running. It can indicate problems of electrolysis of alkaline lignin solution and tips for specific method of improvement. In this chapter, it was also aimed to analyze a mechanism of electrochemical oxidation of lignin by chemical and electrochemical analyses.
In Chapter 3, electrochemical reactivity of biochar suspended in acidic water was evaluated by LSV and continuous electrolysis in constant-voltage. LSV of biochars carbonized at different temperature and other well-carbonized materials was measured to determine the effects of biochar properties on the performance of assisting water
24
electrolysis. Durability of electrochemical reactivity of biochar was evaluated by continuous electrolysis and recuperation of reactivity by heat treatment was proposed and examined. At last, CO2 gasification enhanced the biochar activity were demonstrated, which corresponds to the process shown in Figure 1-16.
25
1.8 References
[1] IEA World Energy Outlook 2015
[2] Kobayashi, Y.; Ando, Y.; Kabata, T.; Nishimura, M.; Tomida, K.; Matake, N.;
Mitsubishi Heavy Industries Technical review, 2011, Vol. 48, No. 3 [3] Key World Energy Statistics 2015
[4] U.S. Department of Energy Office of Electricity Delivery and Energy Reliability, Energy Storage Safety Strategic Plan 2014
[5] IEA Hydrogen Production and Storage 2006
[6] Ruiz, J. A.; Juarez, M. C.; Morales, M. P.; Munoz, P.; Mendivil, M. A.; Renewable and Sustainable Energy Reviews, 2012, 18, 174–183
[7] NEDO Annual Report on Hydrogen Technology 2015
[8] Christos, M. K.; Angelos, M. E.; Conference Papers in Energy, 2013, 9
[9] Mitsushima, S.; Matsuzawa, K.; Journal of Hydrogen Energy Systems Society of Japan, 2011, 36, 11–16
[10] Zeng, K.; Zhang, D.; Progress in Energy and Combustion Science, 2010, 36, 307- 326
[11] Gahleitner, G.; International Journal of Hydrogen Energy, 2013, 38, 2039-2061 [12] Holladay, J. D.; Hu, J.; King, D. L.; Wang, Y.; Catalysis Today, 2009, 139, 244-260 [13] Turner, J.; Sverdrup G.; Mann K. M.; Maness, P. C.; Kroposki, B.; Ghirardi, M.;
Evans, R. J.; Blake, D.; International Journal of Energy Research, 2008, 32, 379-407 [14] Badwal, S. P. S.; Giddey, S.; Munnings, C.; WIREs Energy and Environment, 2013, 2, 473-487
[15] Coughlin, W. R.; Farooque, M.; Nature, 1979, 279, 301-303
26
[16] Higman, C.; Burgt, M. V. D.; Gasification 2nd Edition, 2008
[17] Giddey, S.; Kulkarni, A.; Badwal, S. P. S.; International Journal of Hydrogen Energy, 2015, 40, 70-74
[18] Badwal, S. P. S.; Giddey, S.; Ciacchi, F. T.; Ionics, 2006, 12, 7-14
[19] Carmo, M.; Fritz, L. D; Mergal, J.; Stolten, D.; International Journal of Hydrogen Energy, 2013, 38, 4901-4934
[20] Seehra, M. S.; Ranganathan, S.; Manivannan; Applied Physics Letters, 2007, 90, 044104
[21] Japan Patent Office Report on Technological Trends of Patent Applications:
Electrolytic Hydrogen Production Technology and Peripheral Technology 2013
[22] Seehra, M. S.; Bollineni, S.; International Journal of Hydrogen Energy, 2009, 34, 6078-6084
[23] Patil, P.; Abreu, Y. D.; Botte, G. G.; Journal of Power Sources 2006, 158, 368–377 [24] Hayashi, J.-i.; Kudo, S.; Kim, H.-S.; Norinaga, K.; Matsuoka, K.; Hosokai, S.;
Energy & Fuels, 2014, 28, 4–21
[25] Oike, T.; Kudo, S.; Yang, S.; Tahara, J.; Kim, H.-S.; Koto, R.; Norinaga, K.; Hayashi, J.-i.; Energy & Fuels, 2014, 28, 6407–6418
[26] Sueyasu, T.; Oike, T.; Mori, A.; Kudo, S.; Norinaga, K.; Hayashi, J.-i.; Energy &
Fuels, 2014, 26, 199–208
[27] Idesh, S.; Kudo, S.; Norinaga, K.; Hayashi, J.-i.; Energy & Fuels, 2012, 26, 67–74 [28] Idesh, S.; Kudo, S.; Norinaga, K.; Hayashi, J.-i.; Energy & Fuels, 2013, 27, 4796–
4803
[29] Kudo, S.; Hachiyama, Y.; Takashima, Y.; Tahara, J.; Idesh, S.; Norinaga, K.;
Hayashi, J.-i.; Energy & Fuels, 2014, 28, 76–85
27
[30] Pan, Y.; Birdsey, R. A.; Phillips, O. L.; Jackson, R. B.; Annual Review of Ecology, Evolution, and Systematics, 2013, 44, 593-622
[31] Dornburg, V.; Faaij, A. P. C.; Biomass & Bioenergy, 2001, 21, 91-108
[32] Abdoulmoumine, N.; Adhikari, S.; Kulkarni, A.; Chattanathan, S.; Applied Energy, 2015, 155, 294-307
[33] Woolcock, J.P.; Brown, C.R.; Biomass & Bioenergy, 2013, 52, 2013
[34] Monica, E. K.; Gellerstedt, G.; Henriksson, G.; Wood Chemistry and Biotechnology [35] Takano, T.; Japan Thermosetting Plastics Industry Association, 2010, 31, 213-223 [36] Lalvani, B. S.; Rajagopal, P.; Journal of the Electrochemical Society, 1992, 139, L1- L2
[37] Ghatak, H. R.; International Journal of Hydrogen Energy, 2006, 31, 934-938 [38] Lalvani, B. S.; Rajagopal, P.; Holzforschung, 1993, 47, 283-286
[39] Woolf, D.; Amonette, J. E.; Street-Perrott., F. A.; Lehmann, J.; Joseph, S.; Nature Communications, 2010 , 56 , 1
28
Chapter 2: Lignin-Assisted Water Electrolysis
2.1 Experimental conditions 2.1.1 Materials
A lignin extracted from softwood (Sigma-Aldrich, product number 370959), a lignin extracted from bamboo (Sanuki Kasei Co., Ltd.), and four model compounds of lignin unit (phenol, guaiacol, syringol and catechol of reagent grades) were employed as oxidizable materials. The elemental composition of the lignins, and molecular models of model compounds are shown in Table 2-1 and Figure 2-1, respectively. Table 2-2 shows sample materials list. The solution of softwood and bamboo lignins are hereafter referred to as SWL and BL, respectively. Each oxidizable material was dissolved in aqueous solution of 1 mol/L NaOH at mass concentrations of 5 wt% (SWL and BL) or 2 wt%
(model compounds). Both lignin solutions were subjected to hydrothermal treatment (HT) that uses NaOH as catalyst. Hydrothermal treatment is a typical technique to degrade woody biomass to low-molecular compounds by high temperature and pressure1. The alkaline solution was flowed continuously to a tubular reactor (SUS316, length:
2,710 mm, inner diameter: 2.17 mm). The temperature of the reactor was maintained at 300 °C by thermostatic oven. The pressure is maintained at 12 MPa, flow late was set at 1.5 ml/min, respectively. The estimated residence time of the liquid was 4.76 min. Figure 2-2 shows the apparatus to run a hydrothermal treatment that has past results2 of hydrothermal treatment of lignins.
29
Table 2-1. Elemental composition of lignins
Figure 2-1. Molecular model of model compounds
Table 2-2. Experimental materials list
Element C H N O + S (by dif.)
Unit of content
Softwood lignin 64.6 5.8 0.4 29.2
Bamboo lignin 61.9 5.6 0.3 32.1
wt% on daf basis
Materials NaOH Softwood lignin Bamboo lignin Hydrothermal treatent Phenol, Guaiacol, Syringol, Catechol
NaOH aq. -
SWL
SWL-HT 300 ℃, 12 MPa, 4.76 min
BL -
BL-HT 300 ℃, 12 MPa, 4.76 min
Model compound
solutions (4 types) - - 2 wt%
- 1 mol/L
- -
5 wt%
-
5 wt%
30
Figure 2-2. Apparatus for hydrothermal treatment of lignins
2.1.2 Electrolysis and analysis
A prescribed volume (20 ml) of the solution was subjected to electrochemical experiments in a 35-ml single glass-made cell with three electrodes3; working electrode (WE) made of a straight platinum wire (diameter: 0.5 mm, geometric surface area: 0.565 cm2), counter electrode (CE) made of a coiled platinum wire (geometric surface area: 1.98 cm2), and saturated calomel electrode (SCE) as the reference one. Figure 2-3 shows electrochemical experimental apparatus. All instruments described above were distributed by BAS Co., Ltd. The evolved gas during the electrolysis was monitored intermittently with carrier gas of 100 ml/min nitrogen (N2) by gas chromatography (GC) (Agilent Technologies, model 490). All of the operations were done at operation temperature of 80 °C. The electrolyte was stirred at 200 rpm to keep homogenously temperature distribution. All electrochemical measurements were done with an electrochemical analyzer (BAS, model 611B and 600EA). Electrochemical
Alkaline lignin solution
Pump
Thermostatic oven
Condenser Membrane
filter Back
pressure valve
Tubular reactor
Treated alkaline lignin solution
31
characteristics of electrolysis were investigated by measurements of LSV and continues electrolysis. In LSV measurement, potential of WE was scanned in rate of 10 mV/sec, direction of scanning is positive. The interelectrode potential between WE and CE during operation was measured by data logger (GRAPHTEC, model GL220).
Figure 2-3. Electrochemical experimental apparatus for lignin-assisted water electrolysis
In continuous electrolysis measurement, the lignin solution before and after electrolysis were analyzed to investigate a mechanism of electrochemical oxidation of lignin in alkaline solution. Total charge amount of the electrolysis was targeted to oxidize 50%
(for absorbance spectroscopy) and 25% (for analysis other than absorbance spectroscopy) of carbon that included in lignin, and it is assumed that the oxidation is carried out in molar ratio of carbon:electron = 1:4 that referees the reaction of Equation 1-5. The electrolysis was carried out in constant WE potential of 1.0 V, and the experiment took about 12 hours.
Reference electrode Working electrode
Counter electrode
Electrolyte (20 ml)
Electrochemical analyzer Carrier gas (N2)
Micro GC
Stirring (200 rpm)
32
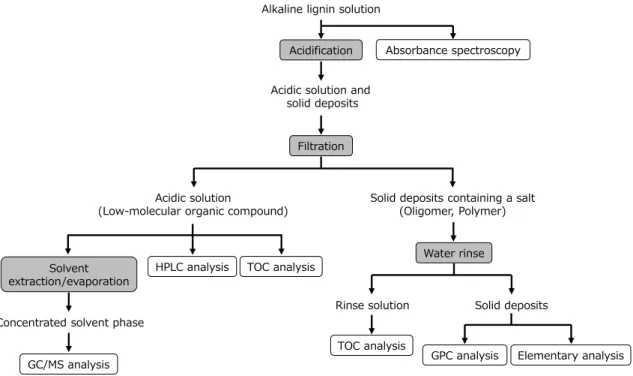
The solutions after continuous electrolysis were separated into solid and liquid as preliminary steps of each analysis. The flow of process is illustrated in Figure 2-4. Details of each operation are described below.
Acidification: 2 mol/L hydrochloric acid solution was added to alkaline lignin solution to control the pH into range of 1.0 ± 0.2.
Filtration: Acidic solution and solid deposits were separated by vacuum filtration. The pore size of filter is 0.45 μm.
Solvent extraction: A part of acidic solution was subjected to solvent extraction. The solvents were dichloromethane (DCM) and methyl ethyl ketone (MEK), solution/solvent ratio was 1:1 both, and extraction time was three hours. The solution/solvent mixture was separated via separatory funnel or pipette after three hours extraction.
Solvent evaporation: A solvent phase was concentrated by evaporation. The conditions of evaporation were set in 25 °C-170 mbar for DCM, and 40 °C-140 mbar for MEK. 2 ml of same solvent was added to residue after evaporation to make concentrated solvent phase.
Water rinse: Solid deposits were rinsed by distilled water to remove a salt. Solid deposits and water were put in beaker and stirred by magnetic stirrer for 15 min. Ratio of deposit/water was approximately 100 mg/50 ml. The deposit/water mixture was subjected to vacuum filtration again after rinsing. Removal of salt could be confirmed by addition of silver nitrate.
33
Figure 2-4. Flow chart of solid-liquid separation and analysis process of alkaline lignin solution
Yields of organic carbon of rinse solution and acidic solution were measured by total organic carbon analyzer (SHIMADZU, model TOC-V CPH). The amount of organic carbon of solid deposit was calculated from result of elemental analysis. The molecular weight of solid deposit was measured by gel permeation chromatography (detector:
SHIMADZU, model RID-10A, column: Shodex, model KF-802 and K-G). Qualitative analysis of low-molecular weight compounds in acidic solution was carried out by high performance liquid chromatography (detector: SHIMADZU, model SPD-M20A, column:
Phenomenex, model Synergi 2.5 µm Hydro-RP 100 Å) and gas chromatography–mass spectrometry (GC/MS: PerkinElmer, model Clarus SQ8S and Clarus 680, column: GL science, model TC-1701). The absorbance of alkaline lignin solution before/after electrolysis was measured by spectrophotometer (PerkinElmer, model Lambda 25).
Acidification Alkaline lignin solution
Acidic solution and solid deposits
Filtration
Solid deposits containing a salt (Oligomer, Polymer) Acidic solution
(Low-molecular organic compound)
Elementary analysis TOC analysis
GPC analysis GC/MS analysis
HPLC analysis Solvent
extraction/evaporation Concentrated solvent phase
Water rinse
Rinse solution Solid deposits TOC analysis
Absorbance spectroscopy
34
2.2 Evaluation of potential of lignin and model compounds of lignin unit as oxidizable material by LSV
A preliminary experiment of LSV was done to investigate a potential of lignins and model compounds as oxidizable material. Figure 2-5 shows LSV profiles of lignin solutions and NaOH solution. The horizontal axis indicates the potential between WE and reference electrode that has specific potential of SCE, 0.21 V4 at 80 °C. The vertical axis indicates the current density that current divided by electrode area. Current density means reaction rate directly in electrolysis reaction because the reaction progresses with electron transfer. All lignin solutions show the peak of current density that means oxidation of lignins at a range of potential from -0.5 V (SWL-HT) to -0.25 V (BL) of SCE, which corresponds to 0.45–0.7 V of interelectrode potential. These potentials are significantly lower than the standard potential of 1.23 V that enables to split water into H2 and O2 in water electrolysis. On the other hand, the fall of current density due to H2 generation is observed at potential under -1.0 V in the both case of lignin solutions and NaOH aq. It proves that the electrolysis reaction obeys Equation 1-5 in electrolysis lignin solution. It means that anode reaction of alkaline water electrolysis, in other words, O2 generation reaction can be substitute with oxidation of lignin. In principle, it can reduce the necessary potential for H2 production of alkaline water electrolysis.
The HT shifts the beginning potential of rise of peak (onset-potential) and increases the peak value of current density, respectively, compared to non-treated lignin solution.
It is expected that the improvements are caused by increase of electrochemical reactivity of lignin with functional group conversion and increase of reactant (lignin or lignin derivative) feed rate with decrease of molecular weight. The increase of reactivity can
35
reduce an activation overpotential, and the increase of reactant feed rate can resolve a problem of transport limitation. In fact, it is strongly believed that the HT can improve the performance of electrolysis of alkaline lignin solution.
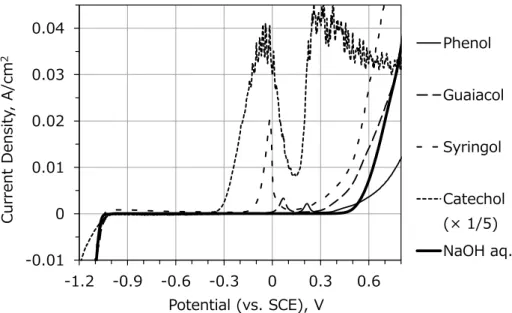
Figure 2-6 shows LSV profiles of model compound solutions and NaOH solution. The current density of catechol is reduced five times from its original value. In the presence of phenol, guaiacol and syringol, which are typical and abundant monomers from the hydrothermal treatment of lignin from bamboo and other herbaceous biomass5, 6, there is similar behavior of onset-potential to lignin solutions. Catechol solution shows significant performance in terms of onset potential and peak current density compared to other model compound solutions. It proves that the functional group of oxidizable material gives effect to onset potential and peak current density. Catechol can be produced by hydrolysis of lignin5 although normally less abundant than the other three types of monomers. Figure 2-7 shows GC/MS chromatogram of compounds extracted from SWL-HT. The extraction was carried out with solvent of dichloromethane. Main component of low-molecular compounds is phenolic compound that is produced by hydrolytic degradation of lignin.
This result supports solidly the performance improvement of electrolysis caused by HT of lignin solutions. However, even though there is no catechol in SWL-HT, the onset- potential of SWL-HT is as low as that of catechol solution. It means that SWL-HT contains compounds that have high-electrochemical reactivity other than catechol. This result can motivate a further study about searching of other reactive compounds.
36
Figure 2-5. LSV profile of lignin solutions and NaOH solution
Figure 2-6. LSV profile of model compound solutions and NaOH solution -0.002
0 0.002 0.004 0.006 0.008 0.01
-1.2 -0.9 -0.6 -0.3 0 0.3 0.6
Current Density, A/cm2
Potential (vs. SCE), V
SWL SWL-HT BL BL-HT NaOH aq.
-0.01 0 0.01 0.02 0.03 0.04
-1.2 -0.9 -0.6 -0.3 0 0.3 0.6
Current Density, A/cm2
Potential (vs. SCE), V
Phenol
Guaiacol
Syringol
Catechol (× 1/5) NaOH aq.
37
Figure 2-7. GC/MS chromatogram of SWL-HT (dichloromethane-soluble compounds)
From above results of LSV, onset-potentials, peak-potential (the potential corresponding to maximum point of current density in oxidation peak), interelectrode potentials and corresponding efficiencies of electrolysis are summarized in Table 2-3.
The onset-potential is here temporarily defined as that at which the current density reaches 1 mA/cm2. In water electrolysis, the efficiency η can be defined as the ratio of chemical energy (LHV; 241.82 kJ/mol) of H2 formed to the input of electricity:
η = ∆Hc/2FE Equation 2-1.
where ∆Hc and E are the chemical energy of H2 and interelectrode potential (V), respectively. F is Faraday’s constant (96485 C/mol). It can be confirmed repeatedly that the efficiency of electrolysis is as a function of interelectrode potential. The calculated results shows that HT-SWL has about 2.5 times the efficiency of NaOH aq., in other words, applying of softwood lignin with pretreatment of HT can reduce the input-
25 30 35 40 45
CH3
OCH3 OH
OCH3 OCH3
OCH3 OH
C2H5
OCH3 OH
OCH3 OH
CH3 1
2
3
4
5 CH3
Retention time, min
38
electricity of alkaline water electrolysis by 60% ideally. However, in fact, the efficiency of electrolysis decrease almost certainly in a continuous operation because of overpotential7, 8, 9. Therefore the performance of electrolysis of alkaline lignin solution should be also confirmed in continuous operation.
Table 2-3. Summarization of onset-potentials, peak-potential, interelectrode potentials and corresponding efficiencies of electrolysis
EWE-onset, V
(vs. SCE) EInt-onset, V Efficiency(η)-onset
Phenol 0.19 1.25 1.00
Guaiacol 0.03 1.09 1.15
Syringol -0.13 0.93 1.35
Catechol -0.39 0.67 1.87
SWL -0.23 0.83 1.51
BL -0.11 0.95 1.32
SWL-HT -0.43 0.63 1.99
BL-HT -0.23 0.83 1.51
NaOH aq. 0.5 1.56 0.80
EWE-peak, V
(vs. SCE) EInt-peak, V Efficiency(η)-peak
Phenol 0.22 1.28 0.98
Guaiacol 0.07 1.13 1.11
Syringol -0.02 1.11 1.13
Catechol -0.04 1.23 1.02
SWL -0.14 0.95 1.32
BL 0.02 1.1 1.14
SWL-HT -0.17 0.96 1.31
BL-HT -0.02 1.1 1.14
NaOH aq. - - -
39
2.3 Evaluation of continuous electrolysis
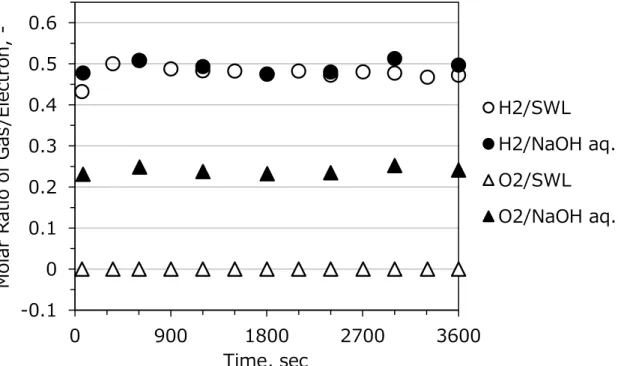
An evolved gas analysis was done primarily for electrolysis of alkaline lignin solution before investigation of an electrolysis performance in continuous operation. Figure 2-8 shows a result example of evolved gas analysis during continuous electrolysis of SWL and NaOH aq. The horizontal axis indicates the time since beginning of the electrolysis.
The vertical axis indicated the molar ratio of H2 and O2 to electrons during continuous electrolysis. The ratio was calculated from current value and generation rate of gas that is measured by GC. The ratio of H2/e is 1/2 in both electrolysis. This molar ratio is consistent with the stoichiometric formula of alkaline water electrolysis, Equation 1-1.
On the other hand, the ratios of O2/e are 1/4 (NaOH aq.) and 0 (SWL), respectively. It means that softwood lignin was not reduced at the cathode, in addition, lignin oxidation occurred at the anode instead of O2 evolution. The result is consistent with the stoichiometric formula of electrolysis of alkaline lignin solution that was predicted as shown in Equation 1-5. Here, it is noted that CO2 evolution cannot be confirmed by GC because evolved CO2 gas can dissolve completely in the alkaline solution.
However, the molecular ration changes if the electrolysis continues for a long time as shown in Figure 2-9. Amount of evolved H2 decreases and that of evolved O2 increases with time. In that case, it is considered that the original anode reaction of alkaline water electrolysis (O2 evolution) began to occur because of concentration reduction of lignin.
It is also considered that a part of electrons was used for reduction of products of lignin oxidation instead of H2 evolution at cathode. The undesirable result indicates that electrolysis of alkaline lignin solution is process suitable for flow reactor because the reactor can control the change of solution composition.
40
Figure 2-8. H2/electron and O2/electron molar ratio during 3600 sec-continuous electrolysis of NaOH aq. and a SWL solution
Figure 2-9. H2/electron and O2/electron molar ratio during 44000 sec-continuous electrolysis of NaOH aq. and a SWL solution
-0.1 0 0.1 0.2 0.3 0.4 0.5 0.6
0 900 1800 2700 3600
Molar Ratio of Gas/Electron, -
Time, sec
H2/SWL H2/NaOH aq.
O2/SWL O2/NaOH aq.
-0.1 0 0.1 0.2 0.3 0.4 0.5 0.6
0 8000 16000 24000 32000 40000
Molar Ratio of Gas/Electron, -
Time, sec
H2/SWL O2/SWL
41
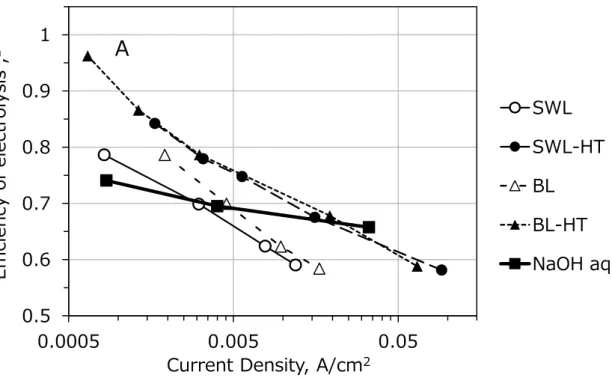
Figure 2-10 shows the results of continuous electrolysis in constant-potential of alkaline lignin solutions and NaOH aq. The efficiency of electrolysis that was calculated from measured interelectrode potential is plotted against logarithmic current density in the graph. Each plot means a result of one continuous electrolysis, for example, the first plot of BL-HT, plot of ‘A’ was obtained from continuous electrolysis at WE potential of 0.3 V (vs. SCE). Figure 2-11 shows the data of continuous electrolysis that equal to plot of ‘A’. The current density and interelectrode potential were measured after current density become stable. The efficiency of SWL and BL is higher than that of NaOH aq. at low current density range, and HT increases the performance clearly. The efficiency of alkaline water electrolysis is increased from 74 % to maximum of 97 % by presence of hydrothermally bamboo lignin. However, the efficiencies decrease drastically with increase of current density. Unfortunately, presence of hydrothermally lignins decreases the efficiency of alkaline water electrolysis at range over 0.02 A/cm2. It is considered that the performance degradation is caused by two factors. First factor is large activation energy of functional group that is oxidized in this electrolysis. It is anticipated that the activation energy of lignin oxidation is larger than that of O2 evolution. The anticipation is supported by principle of overpotential as shown in Figure 1-6. Incidentally, diffusion overpotential have little or no effect on the performance degradation because current density increases with increase of interelectrode potential. Current density cannot be increased by applying of potential if the lignin oxidation is diffusion-controlling process.
Second factor is activation energy of further reactive sites of lignins. It is considered that a number of reactive sites of lignin increases with increase of WE potential, in other words, current density. As a result, large electrical energy was consumed at range of high current density in electrolysis of alkaline lignin solutions. This principle is introduces from result
42
of electrolysis of alkaline glucose and methanol solution that was reported by Danaee et al.10, 11 Therefore, It is concluded that decrease of activation energy of lignin oxidation and lignin derivatives that have simple molecular construction are needed to improve the performance of lignin solution electrolysis.
Figure 2-12 shows the results of continuous electrolysis in constant-potential of model compound solutions and NaOH aq. All model compound solutions, especially catechol solution shows clearly high efficiency compared to lignin solutions and NaOH aq., even at range of high current density. The result means that functional group of oxidizable material has drastically effect on increase of the efficiency. On the other hand, catechol solution results higher efficiency than SWL-HT, even though catechol solution has similar onset-potential to SWL-HT as shown in Table 2-3. This gap describes that molecular size of oxidizable material has significant effect on efficiency. The result of catechol can also describe that, HT has the promise effectiveness for efficiency improvement because yield of catechol can be controlled partly5, 11 by change of HT condition, temperature, pressure, reaction time and concentration of alkali. It is concluded that further study about optimization of HT conditions is needed to improve the efficiency of electrolysis of alkaline lignin solution.