INVITED PAPER
Special Section on Electronic DisplaysFast Spectral BRDF & BTDF Measurements for Characterization of Displays and Components
Pierre BOHER†a), Thierry LEROUX†, V´eronique COLLOMB-PATTON†,andThibault BIGNON†,Nonmembers
SUMMARY In the present paper we show how to obtain rapidly the spectral BRDF and BTDF of different display components or transparent displays using Fourier optics system under different illumination configura- tions. Results can be used to simulate the entire structure of a LCD display or to predict transparent display performances under various illuminations.
key words: BRDF, BTDF, multispectral, diffusor, BEF, transparent display
1. Introduction
Emissive properties of LCD displays have significantly im- proved these last years due to many efforts spend at all the levels of the manufacturing. The improvement of the films used inside the LCD structure can be noticed[1]. To go fur- ther and meet the new needs like auto-stereoscopic 3D, fu- ture structures will become more and more complex and re- alistic computer simulations will become mandatory. LED lighting applications are also using many different types of films whose specifications become critical[2]. Simulations using theoretical reflective and transmission properties do not lead generally to realistic results. Consequently, it be- comes necessary to measure accurately the optical proper- ties of all the optical components, including light diffusion and scattering, as a function of angles but also wavelengths.
Measurement of simple optical components can be made us- ing standard spectrophotometers or reflectometers. Obtain- ing realistic results in the simulation of complex films pro- ducing diffusion or diffraction requires measuring the trans- mittance and the reflectance as a function of angle with a good resolution and not only in specular configuration.
On the other hand, transparent displays are just in their starting phase with many developments and improvements of the performances[3]. Characterization of transparent dis- plays has not been much studied up to now. Blurring due to diffusion inside the display structure has been measured by imaging luminance meter[4]. Transmittance and reflec- tive properties of transparent displays have also been mea- sured on axis but the angular behavior has not been inves- tigated[5]. Here also the characterization of such displays must be made versus angle and wavelength with a high an- gular resolution.
Standard gonio-spectrophotometers generally used to measure BRDF and BTDF can be extremely time consum-
Manuscript received March 7, 2016.
Manuscript revised May 23, 2016.
†The authors are with ELDIM, 1185 rue d’Epron, 14200 H´erouville St. Clair, France.
a) E-mail: [email protected] DOI: 10.1587/transele.E99.C.1255
ing when medium angular resolution is required. The aim of this paper is to introduce multispectral Fourier optics view- ing angle instruments applied to accurate and rapid mea- surements of the reflection and transmission properties of display components or transparent displays with high angu- lar resolution. This technique has first been introduced for the viewing angle measurement of displays by ELDIM in 1993[6]. A theoretical comparison of the different view- ing angle measurement techniques has been published in 2009[7]. Standard goniometers and hemisphere base im- agers[8]were also investigated. The main drawback of the last technique is clearly the parasitic light that prohibits any high dynamic measurement. More recently, for BRDF mea- surements, techniques using different types of mirrors in dif- ferent configurations has been proposed in the literature[9]–
[12]. Davis[9],[10] has patented a device using an ellip- soidal mirror to collect the reflected light using a CCD sen- sor, but the change of incidence for the illumination beam is not easy and spectral measurements are not possible.
Dana[11]has constructed a system using a paraboloid mir- ror that has comparable problems. Mukaigawa[12]presents another system including an ellipsoidal mirror and a pro- jector were the incidence beam can be changed easily but the use of a camera allows only color measurements. For all these mirror based techniques the major problem lays always in the parasitic light that cannot be suppressed com- pletely and prohibits any high dynamic range measurements which are required for glossy samples. Rarely mentioned but very important is the tradeoffalways existing between the angular resolution and the measurement spot size. In- deed the angular resolution is driven by the size of the mirror and the resolution of the camera. It is maximal only when the spot size is zero due to simple geometric considerations.
In practice, glossy sample measurements are not possible except using very large instruments.
In the following, experimental details on the multi- spectral Fourier optics measurement system and on the way to measure spectral BRDF and BTDF under full diffuse or collimated beam illumination are reported in the first part. Measurements on various display components and on a transparent LCD display are discussed in a second part to il- lustrate the different measurement modes and the capability of the method.
Copyright c2016 The Institute of Electronics, Information and Communication Engineers
one (cf. Fig. 1 (a)). Compared to standard goniometers, the main interest of this kind of system is to allow full viewing angle map recording in only one measurement. Each light beam emitted from the sample surface is collected by the optics and refocused on a Fourier plane at a position pro- portional to the incidence and azimuth angles. This Fourier plane is reimaged on a CCD detector. In between the first Fourier plane and the detector there is a position that is in direct view of the sample surface. One iris located at this po- sition defines the normal incidence spot size on the sample (cf. Fig. 1). So, the angular aperture and resolution and the spot size are defined independently in this very specific op- tical setup avoiding the tradeoffmentioned above for mirror based systems. Another main interest of the optical setup is the light collection efficiency even at high angles since the spot size is increasing with the angle (in 1/cosθlike for a standard goniometer). The correspondence between pixels and angles is calibrated using a reference goniometer with a collimated source.
The multispectral viewing angle system EZCon- trastMS based on Fourier optics has been introduced in 2008 to measure the spectral emission of displays[13]. The sys- tem measures the full viewing angle up to 88◦versus wave- length thanks to 31 band-pass filters regularly distributed in the visible range (every 10 nm). One spectral measure- ment needs 31 images and the angular resolution is excellent (around 0.2◦for the EZContrastMS system with 880×880 pixels angular images). This system is also capable to mea- sure the polarization state and was used to characterize po-
Fig. 1 Schematic diagram (left) and photograph (b) of a Fourier optics viewing angle system with reflective option.
The white light is injected on the illumination Fourier plane using a small optical fiber. Because of the optical setup, the size of the fiber defines the divergence of the illumination beam independently of the size of illumination spot on the sample. For the BRDF measurements, a 50μm optical fiber is used that gives a divergence lower than 0.3◦ on the sam- ple surface. The system has been used to measure different type of surfaces and e-papers[15], and to evaluate the out- door properties of displays[16]. This system is also capable to illuminate and to measure exactly at the same angle al- lowing backscattering investigation of cosmetic foundations for example[17].
Full characterization of the reflective properties of a surface requires measurements at different incidence angles if the surface is isotropic. In the anisotropic case, different incidence and azimuth angles have to be measured. For each incident beam the spectral BRDF is given by:
BRDF(θi, ϕi, θr, ϕr, λ)=dLr(θi, ϕi, θr, ϕr, λ)
dEi(θi, ϕi, λ) (1) (θi, ϕi) and (θr, ϕr) are the polar coordinates of the incidence light beam and detection direction respectively. The radi- ance dLr(θi, ϕi, θr, ϕr, λ) diffused by the surface is directly measured by the instrument.
The irradiance of the sampledEi(θi, ϕi, λ) is obtained using a further measurement of one Spectralon sample using the same illumination conditions. Spectralon, a registered trademark of Labsphere Inc. is a fluoropolymer with high diffuse reflectance generally used as a reference standard for calibration of spectrophotometers. The irradiance is given by the Eq. (2):
dEi(θi, ϕi, λ)
=
2πRw(θr, λ)LW(θi, ϕi, θr, ϕr, λ) cos(θr)dΩr (2) LW(θi, ϕi, θr, ϕr, λ) is the radiance measured on the spec- tralon sample andRW(θr, λ) the reflection coefficient of the spectralon. In Eq. (2) the light is integrated on the total an- gular aperture of the instrument. On the contrary of conven- tional goniometer systems, the Fourier optics instrument al- lows calibrating correctly the illumination without assuming that Spectralon surface is perfectly Lambertian. Different BRDF measurements made with variable incidence angles on a Spectralon surface are reported in Fig. 2. In agreement with previous studies[18], the surface becomes quite spec- ular at high incidence angles.
2.3 BTDF Measurements
BTDF measurements require illumination across the sam-
Fig. 2 BRDF measurements on a Spectralon sample at 600 nm and vari- ous incidence angles and along the incident plane.
Fig. 3 Photograph of the goniometer option for BTDF measurements.
ple with a collimated beam at an adjustable incidence and azimuth. This can be obtained using the BTDF option that includes a two axis goniometer and a collimated and stabi- lized white LED source (cf. Fig. 3). The software allows au- tomatic correction from the misalignment between the view- ing angle system and the goniometer axis. Automatic mea- surements versus incidence and azimuth angles can be per- formed. The BTDF and BRDF options makes possible to measure the spectral BRDF and spectral BTDF of any op- tical component at all incidence and azimuth angles with an excellent angular resolution in reasonable measurement times.
3. Characterization of Backlight Components
3.1 Structure & Components
In the following we present results obtained on diffusion
Fig. 4 Schematic diagram of the backlight.
Fig. 5 Transmittance of the backlight in full diffuse illumination at 537 nm for all the angles (a) and along different azimuths (b).
layers and brightness enhancement film (BEF) involved in a simple backlight as shown in Fig. 4.
3.2 Full Diffuse Transmittance of the Backlight
The full diffusion transmittance of the backlight structure is reported in Fig. 5. It is measured using a near Lambertian lamp and gives an overall idea of the properties of the full system. The effect of light refocus near normal incidence of the BEF film is seen clearly but this type of measurement
Fig. 6 BTDF measured at 537 nm on the diffusor plate 2 for a collimated beam illumination at 30◦(a) and horizontal cross sections for different in- cidence angles (b).
does not give information on the behavior of each light beam crossing the structure. In this respect, BTDF measurements using collimated beam at different incidences and azimuths are required.
3.3 BTDF of the Diffuser Plates
Diffuser plates that are made from transparent resin usually contain some fine particles known as light diffuser agents in order to obtain sufficient diffusivity. This diffusivity largely depends on the difference in refractive index between the particle and the matrix, and on the diameter of the light dif- fuser agent. A first approach of the diffusing properties can be obtained using Mie scattering theory. However, since the density of diffusing particles is high, the effect of multiple scattering must be considered. Moreover the distribution of size must be also taken into account. Therefore, accurately predicting the light scattering characteristics for simple ob- ject like diffuser plates is quite difficult and measurement are mandatory to take into account correctly their diffusing properties.
We have measured the spectral BTDF of the two dif-
Fig. 7 BTDF measured at 537 nm on the diffusor plate 2 (bold) and dif- fusor plate 3 (dash) for 0◦, 10◦, 20◦and 30◦.
Fig. 8 Schematic view of the cross section of a BEF film prismatic struc- ture.
fusing plates (diffuser 2 and 3 in Fig. 4) at various incident angles. Diffusion pattern obtained at 537 nm on the diffuser plate 2 for an incidence angle of 30◦is reported in Fig. 6 (a).
Horizontal cross sections for various incident angles are also reported in Fig. 6 (b). We can observe two very well de- fined haze components for the angles below 40◦ and only one above 40◦. The sharpest haze component related to the transmitted peak is reduced by the increase of thickness to cross when increasing the angle. The comparison with dif- fuser plate 3 is reported in Fig. 7. The main difference is in the amplitude of the transmitted peak probably due to a different thickness of the diffuser plate.
3.4 BTDF of BEF Film
BEF are prismatic films that manage the angular output of light from the backlight. They use refraction to compress the backlights output towards an on-axis viewer as schemat- ically reported in Fig. 8. If the incidence is far from on axis, the light beam is refracted inside the prismatic struc-
Fig. 9 BTDF at different incidence angles along azimuth 0◦ (a) and transmitted beam angles compared to theoretical positions (b): optical in- dex 1.53, prism angle 44.5◦.
ture and reoriented near normal incidence or recycled inside the backlight.
It is easy to express the angle of the transmitted beam in the plane perpendicular to the prismatic structure. Ifθi
is the incidence angle,αthe prism angle andN the optical index of the film, we can write the Eqs. (3), (4) and (5):
sinθi=N sinθr (3)
N sin(α−θr)=sinθf (4)
θe=α−θf (5)
They can be used to predict the angular position of the trans- mitted beam across the BEF film (6) as schematically repre- sented in Fig. 8:
θe=α−sin−1
N sin(α−sin−1 sinθi
N
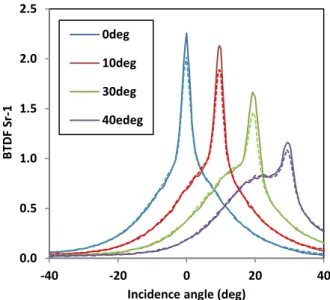
(6) We have measured several BTDF patterns at various inci- dence angles in the plane perpendicular to the prisms (az- imuth 0◦). Combination of several BTDF patterns measured at 609 nm are reported in Fig. 9 (a). The incidence angle of the measured transmitted beam is compared to its theoreti- cal values computed for an optical index valueN=1.53 and
Fig. 10 BTDF at different incidence angles along azimuth 45◦(a) and azimuth 90◦(b).
a prism angle of 44.5◦ are reported in Fig. 9 (b). The haze around each transmitted beam is due to the imperfections of the prismatic structure (roughness and slope distribution) and cannot be predicted theoretically.
For BTDF measurements outside of the plane perpen- dicular to the prim, the light behavior is more complex.
Measurements obtained with incident beams in the plane at 45◦ or along the prisms are reported in Figs. 10 (a) and 10 (b) respectively. At 45◦, the diffusion remains limited.
Along the prism edges, the diffusion plays the key role as shown in Fig. 10 (b).
4. Characterization of Transparent LCD Display Results reported in this part have been obtained on a One ODHitec transparent LCD. This model OD121S1LG-TAS is a 12.1” display with 800×600 resolution which is generally used in show cases and indoor applications.
Fig. 11 Normal incidence transmittance measured in full diffuse illumi- nation configuration for different states of the display.
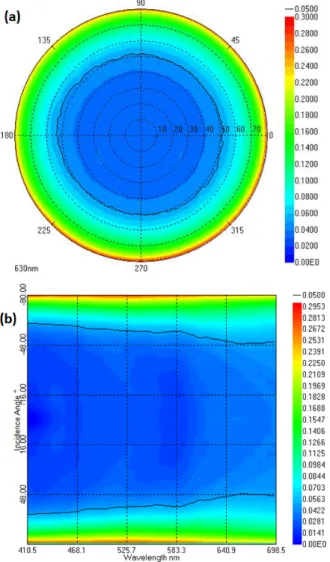
Fig. 12 Full diffuse spectral transmittance in % of white state versus an- gles at 630 nm (a) and versus incidence along horizontal and wavelength (b).
Fig. 13 Color simulation of white state (top) and black state (bottom) using full diffuse transmittance for a 100 cd/m2D65 illuminant: color pat- terns (left) and luminance patterns (right) are reported in each case.
Fig. 14 Color simulation of Red, Green and Blue states and gamut ratio to sRGB using full diffuse transmittance for a 100 cd/m2D65 illuminant.
4.1 Full Diffuse Spectral Transmittance
We have measured the full diffuse transmittance of the white, black, red, green and blue states (W, K, R, G, B) of the display. The transmission coefficients measured at normal incidence versus wavelength are reported in Fig. 11.
The transmission coefficient of the black state is two orders of magnitude lower than the others meaning we can for ex- ample neglect the contribution of R and G switched of pixels in the blue transmittance. The transmission coefficients are
Fig. 15 Full diffuse reflectance of white state versus angles at 630 nm (a) and versus incidence and wavelength (b).
in line with the announced specifications: there are in the range 6-10% for the different sub-pixels.
The angular dependence of the white state is reported in Fig. 12. Interference fringes can be detected in the angu- lar pattern at 630 nm (cf. Fig. 12 (a)) and versus wavelength in the red region (cf. Fig. 12 (b)). The black state is quite good with very low transmittance at all the wavelengths for incidence angles lower than 40◦.
Using the spectral transmittance data the performances of the display can be computed for any type of illuminant used as backlight for the display. Simulation of white and black states using a 100 cd/m2 D65 illuminant are reported in Fig. 13. In spite of a limited luminance of the white state (due to a low white transmittance), the luminance contrast is comparable to standard LCD displays. The simulated color patterns for red, green and blue states are reported in Figs. 14 (a), 14 (b) and 14 (c) respectively. Parasitic light along horizontal and vertical directions for incidence angles higher than 40◦appear clearly. Finally, the color gamut be- havior can be deduced (cf. Fig. 14 (d)).
Fig. 16 Diffracted pattern measured in transmittance at 669 nm at normal incidence (a) and horizontal cross section of the same data (b).
4.2 Full Diffuse Spectral Reflectance
To measure full diffuse reflectance the sample is illuminated across the Fourier optics system with an integration sphere whose exit is located at the illumination Fourier plane (cf.
Fig. 1 (a)). A light trap is positioned on the other side of the transparent display in order to avoid external parasitic reflections. The reflection pattern reported in Fig. 15 (a) is characteristic of a air/ glass interface reflection with some additional modulations due to the liquid crystal cell. This small modulation depends on the state of the transparent dis- play but differences between white and black states do not exceed few percents.
4.3 Collimated Beam Spectral BTDF
Since the display is intended to be transparent for the viewer, its diffusion must be minimized otherwise the image seen across will be blurred. Therefore measurements under col- limated beam are useful. Light diffraction has already been observed on such displays[10], but a high resolution angular
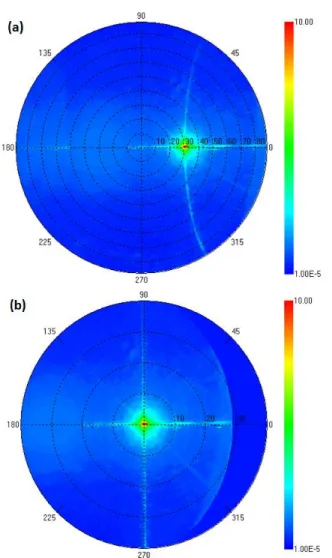
Fig. 17 Diffracted pattern measured in reflection at 630 nm and 30◦of incidence (a) and same data in the BRDF space (b).
measurement has not been made. We have made such a mea- surement on our display. The diffraction pattern obtained at 669 nm is reported in Fig. 16 (a). The complexity of the pat- tern results certainly of the geometry of the transparent and not transparent structure of the display. The diffusion contri- bution is always less than 0.1% of the incoming light beam but extends in all the angular aperture up to 88◦as shown in the horizontal cross sections reported in Fig. 16 (b).
4.4 Collimated Beam Spectral BRDF
One example of collimated beam BRDF measurement for white state at 630 nm is reported in Fig. 17 (a). In addition to the specular contribution, diffusion patterns are clearly visible along two particular directions. The amplitude of the diffusion is small with regards to the specular reflection but can be seen easily if the display is illuminated with a bright punctual source. One way to understand the origin of this diffusion is to report the same data in the BRDF space that removes the distortions due to the Fourier space[20](cf.
Fig. 17 (b)). The diffusion takes place now along horizon- tal and vertical showing that the diffusion is probably due
In the literature, the characterization of the optical compo- nents of LCD displays or LED lighting systems is gener- ally made under full diffusion illumination. An overall char- acteristic of the component is obtained but those data can- not be used in a ray tracing software. On the contrary, real BRDF and BTDF data can be introduced easily in such soft- ware. Concerning BEF films it is possible to simulate the basic on axis compression effect with a perfect model like discussed in Ref.[22], but the introduction of imperfections is mandatory to obtain a realistic simulation. The use of spectral BTDF measurements can make more realistic ray tracing simulations taking into account only one light beam at a time. The ultimate purpose of such work is to pro- vide ray tracing software using real accurate experimental spectral BRDF and BTDF data in order to simulate complex stacks efficiently.
A transparent LCD display has also been optically characterized in details. Full diffuse transmittance measure- ments allow to predict the color and luminance of the dis- play under any full diffuse illumination and the main char- acteristics of the display can be deduced for all the angular aperture. Luminance contrast and color gamut behavior of the studied display are closed to those of a standard LCD display. The overall transmittance of the display is quite low due to the liquid crystal cell and the polarizers. Since the display is intended to allow the observer to see objects across it, the light diffusion should be quite limited. We have validated it using a collimated beam illumination across the display. Some diffraction is nevertheless occurring that ex- tend over the entire viewing angle but the light level is below 0.1% of the specular contribution.
Parasitic reflection contributions have also been evalu- ated using full diffuse and collimated beam illuminations.
The reflection properties are driven by the top interface air/glass with a small modulation of the crystal cell. Diffrac- tion in reflection mode is also occurring but only along the horizontal and vertical directions and with a low level com- parable to what was observed in transmission mode.
References
[1] K. Kusama, T. Ishinabe, B. Katagiri, T. Orui, S. Shoshi, and H.
Fujikake, “Design of Light Diffusion Film with Bent Structure for Reflective Displays,” SID, San Jose, USA, June, P-183, vol.46, no.1, pp.1629–1632, 2015.
[2] W.F. Edmonds, J. Wheatley, K.J.L. Geisler, D.G. Freier, and R.L.
Brott, “Display Technologies for LED Lighting, Part I: Opti- cal Components,” SID, San Jose, USA, June, 44.3, vol.46, no.1, pp.667–669, 2015.
[3] C.-W. Kuo, Y.-Y. Liao, B.-S. Tseng, C.-H. Lin, Y.-H. Lai, C.-T.
Chuang, C.-N. Yeh, and N. Sugiura, “A Novel Flat-Type Transpar- ent Liquid Crystal Display,” SID, San Jose, USA, June, 52.2, vol.46,
no.1, pp.813–816, 2015.
[4] X.-L. Ma, Z.-Y. Zhang, H.-S. Choi, and Y.-S. Im, “Optical Measure- ment Method for Transparent LCDs,” SID, San Jose, USA, June, 48.3, vol.46, no.1, pp.724–726, 2015.
[5] J. Penczek, E.F. Kelley, and P.A. Boynton, “Optical Measuring Methods for Transparent Displays,” SID, San Jose, USA, June, 48.5, vol.46, no.1, pp.731–734, 2015.
[6] T. Leroux, “Fast contrast vs. viewing angle measurements for LCDs,” Proc. 13th Int. Display Research Conference (Eurodisplay 93), 447, 1993.
[7] V. Collomb-Patton, P. Boher, and T. Leroux, “Comprehensive Sur- vey on Viewing Angle Measurement Devices: A Theoretical Study,”
SID, San Antonio, USA, June 2-5, 17.4, vol.40, no.1, pp.220–223, 2009.
[8] R. Yeo, R. Rykowski, D. Kreysar, and K. Chittim, “The imaging sphere – the first appearance meter ?,” NPL/CORM, 5th Oxford Conference, June 2006.
[9] K.J. Davis and D.C. Rawlings, “Directional reflectometer for measuring optical bidirectional reflectance,” United States Patent 5637873, June 1997.
[10] P.R. Mattison, M.S. Dombrowski, J.M. Lorenz, K.J. Davis, H.C.
Mann, P. Johnson, and B. Foos, “Handheld directional reflectome- ter: an angular imaging device to measure BRDF and HDR in real time,” Proc. SPIE, vol.3426, pp.240–251, 1998.
[11] K.J. Dana, “BRDF/BTF Measurement Device,” Proc. International Conference on Computer Vision (ICCV2001), vol.2, pp.460–466, 2001.
[12] Y. Mukaigawa, K. Sumino, and Y. Yagi, “High-Speed Measurement of BRDF using an Ellipsoidal Mirror and a Projector,” IEEE Com- puter Society Conference on Computer Vision and Pattern Recogni- tion, pp.1–8, June 2007.
[13] P. Boher, T. Leroux, T. Bignon, and D. Glinel, “New multispectral Fourier optics viewing angle instrument for full characterization of LCDs and their components,” SID, Los Angeles, USA, May 18-23, P89, vol.39, no.1, pp.1517–1519, 2008.
[14] P. Boher, T. Leroux, T. Bignon, and V. Collomb-Patton, “Multispec- tral polarization viewing angle analysis of circular polarized stereo- scopic 3D displays,” Electronic Imaging, SPIE, San Jose, USA, Jan.
2010.
[15] P. Boher, T. Leroux, and T. Bignon, “Spectral BRDF of color shifting paints and e-papers using multispectral Fourier optics instrument,”
Eurodisplay, 7.4, 2011.
[16] P. Boher, T. Leroux, T. Bignon, and V. Leroux, “Optical measure- ments for comparison of displays under ambient illumination and simulation of physico-realistic rendering,” Dearborn, Michigan, Oct.
2011.
[17] P. Boher, T. Leroux, L. Cav´e, L. Blain, and V. Boulier, “Fast Spec- tral Reflectance & BRDF Measurements of Cosmetic Foundations and their Components,” Pigment & Color Science Forum, Montreal, Canada, Oct. 2014.
[18] A. Ferrero, A.M. Rabal, J. Campos, A. Pons, and M.L. Hernanz,
“Spectral and geometrical variation of the bidirectional reflectance distribution function of diffuse reflectance standards,” Appl. Optics, vol.51, no.36, pp.8535–8540, 2012.
[19] K.L. Lo, Y.H. Tsai, W.Y. Cheng, W.-D. Jeng, and O.-Y. Mang,
“Evaluation of image quality through the transparent display,” 1406, P-161L, SID, vol.46, no.1, pp.1406–1409, 2015.
[20] L. Simonot and G. Obein, “Geometrical considerations in analyzing isotropic or anisotropic surface reflections,” Applied Optics, vol.46, no.14, pp.2615–2623, 2007.
[21] P. Boher, T. Leroux, T. Bignon, V. Collomb-Patton, P. Blanc, and E.
Sandr´e-Chardonnal, “Emissive and reflective properties of curved displays in relation to image quality,” SPIE Opto Conference, San Francisco, USA, 2016.
[22] http://www.zemax.com/support/resource-center/
knowledgebase/how-to-model-brightness-enhancement-film
Pierre Boher earned an Engineer degree at ECP, “ ´Ecole Centrale des Arts et Manufactures”
in 1982, a Ph.D. in material sciences in 1984 and ability to research management in 1991. He worked in the French Philips Laboratories dur- ing nine years on the deposition and characteri- zation of very thin films and multilayers. R&D manager at SOPRA between 1995 and 2002, he developed different metrology tools for non- destructive characterization mainly for micro- electronics. He joined ELDIM as R&D manager in 2003.
Thierry Leroux earned an Engineer de- gree at ENSERG ( ´Ecole Nationale Sup´erieure d’Electronique et de Radio´electricit´e de Greno- ble) in 1982. He obtained his Ph.D. in solid state physics in 1984 at University Joseph Fourier in Grenoble. He then worked during 10 years at CEA-LETI in Grenoble on various flat panel displays technologies before founding his com- pany ELDIM in 1991. Since this date he is CEO of the company which is focusing on innovative photometric and colorimetric equipment for dis- play characterization and other applications.
V´eronique Collomb-Patton obtained her engineer degree in Instrumentation and her PhD in image processing in 2001 with a study on super-resolution applied to CCD defect detec- tion. She then joined the R&D Team of EL- DIM where she has worked on various themes:
MURA defect, BRDF, 3D display characteri- zation, radiotherapy, diffraction, color measure- ment accuracy, display rendering.
Thibault Bignon earned an Engineer de- gree at the ´Ecole Centrale de Marseille in 2002.
He joined ELDIM in 2004 as application engi- neer and R&D engineer to develop new metrol- ogy solutions and new instruments.