Application to become a member of
International Safe Community Network
December 2011
Greetings from the City Mayor
Toshima City has many historical and cultural assets which have been
handed down from our ancestors. This is our home where we continue to
generate energy for tomorrow.
We have been promoting urban planning unique to each community
while focusing on welfare and education. Toshima City has been
developing as a city of cultural promotion, environment friendly,
life-long health in the subcenter of Ikebukuro and surrounding areas. As
we plan for the future and create a “City people want to live in and visit”,
it is absolutely vital that we focus on “safety”.
As home to around 270,000 people in a 13.01km
2area, Toshima City is
a compact high-density urban area with Japan’s highest population density. Being a city where
various people interact, Toshima City is a fertile ground where daily activities can create new values.
On the other hand, we face challenges unique to a high-density urban area.
Our first challenge is safety.
The daytime population of Toshima City, including workers and students who come from outside the
city, is around 380,000 people. Every day 2.54 million people pass through Ikebukuro Station, one of
Tokyo’s bustling commerce areas, as they visit the city for shopping and other events. Crime and
accidents increase when the density of people increases. In addition, Toshima City has many dense
residential areas, so if an earthquake occurs directly below us, as has been predicted, we anticipate
major damage. While our regional characteristics differ, we learned many things from the East Japan
Great Earthquakes which occurred in March 2011.
Another challenge we are facing is local communities, especially the bond
[
絆(
KIZUNA
)
] among
residents at in the local communities and neighborhood levels.
The birthrate in Toshima City is dwindling, while the population is aging, and the rate of
single-person households is on the increase. The rate for ages 65 and older is 20.8% and 37.7% of
senior citizen are single-person households. The rate of residents under the age of 14 is 8.6%. In
communities with fewer children, young mothers tend to feel more isolated. In addition, about
22,000 people move in and out each year. These population characteristics pose a challenge in
community development.
Although these challenges in “safety” and “community” make Toshima City unique and energetic,
they are basic problems which must be tackled for urban grown.
“Safe Community”, promoted by the WHO Collaborating Centre on Community Safety Promotion,
is a valuable program which focuses on these two themes at the same time.
In March 2010, Toshima City was registered as a “city in preparation stages”. Various preparations
have been set in motion to increase lateral cooperation between communities. These include setting a
committee which will act as the nucleus, conducting social surveys on children and senior citizens,
analyzing communities based on various data, etc., setting priority themes for high-risk groups and
environments, reinforcing the safety functions of “community plazas (Kumin-Hiroba in Japanese)”
set up at each elementary school zone, and setting task forces to enhance the effect of these preventive
actions.
“People are a relay runner in history.” These are the words of James Miki, a playwright of the play
“Ikebukuro Our Town” performed in 2008. We are responsible for passing on a worthy city to the
children of the future. The most important value for Toshima City is indisputably “Safety”.
Acquiring the internationally-recognized “Safe Community” designation is the pride of all city
residents. This pride in one’s home place is the driving force for creating a safe city.
The “Safe Community” designation is just a relay point as Toshima City continues its long run.
However, it is a big step which will always lead to the future.
December 2011
Yukio Takano
Table of Contents
Chapter1 Overview of Toshima City ··· 1
1 Land Use, Urban Functions ··· 3
(1) Location and Area
(2) Land use
(3) Education and Culture
(4) Medicine
(5) Industry
2 Population and Households ··· 5
(1) Transitions in Population
(2) Demographics
(3) Daytime population
(4) Aging population and lower birthrate
(5) Household composition
Chapter2 Approach to Safe Community ··· 9
1 Significance of Toshima’s Action ··· 11
(1) “Safety” and “Community” the essence of high-density urban areas
(2) Increasing “safety” supported by a rich community force
(3) Reducing medical and care-giving costs, etc.
2 Progress of Actions and Programs ··· 12
Chapter3 Mortality and Morbidity in Toshima City ··· 13
1 Circumstances of Deaths ··· 15
(1) Causes of death including illness
(2) Trend of death by unintentional accidents and suicides
(3) Circumstances of unintentional or suicide death according to age group
(4) Situation of unintentional death in elderly persons
2 Circumstance of Injuries ··· 19
(1) Statistics of resident injuries
(2) Circumstances of emergency transport due to injury
(3) Children’s Injuries
(4) Elderly’s Injuries
(5) Injury by disabled people
(6) Injuries from traffic accidents
(7) Occupational injury
(8) Injury caused by sports activities
(9) Estimated injury from earthquake disaster
(10) Injury from assault
(11) Self-inflicted injuries
(12) Medical Expenses for injury covered by National Health Insurance
Chapter4 Setting Challenges Based on Community Diagnosis ··· 37
Chapter5 Efforts for Safety Promotion and Injury Prevention Based on the Six Indicators ··· 41
Indicator1: an infrastructure based on partnership and collaborations, governed by a cross- sectional
group that is responsible for safety promotion in their community ··· 43
(1) Organization of the Safe Community Programs
(2) Safe Community Steering Committee
(3) Safe Community Promotion Headquarters (Organization in the Government Office)
(4) Taskforce Committees
(5) Specialist’ Committee
(6) Injury Surveillance Committee
Indicator2:
long-term, sustainable programs covering genders and all ages, environments, and
situations
··· 49
(1) The overview of the Safety Promotion
(2) Major Endeavors for Prevention
Indicator3: programs that target high-risk groups and environments, and programs that promotes safety
for vulnerable groups
··· 55
(1) Prevention of injuries and accidents of children
(2) Safety of the seniors
(3) Safety of the physically disabled
(4) Bicycle Safety
(5) Safety in commercial and entertainment district (downtown)
(6) School safety
(7-1) Prevention and preparedness of earthquake disasters
(Community Development with Residents Participation)(7-2) Prevention and preparedness of earthquake disasters
(Disaster Preventing Activities by Residents)(8) Prevention of child abuse
(9) Prevention of domestic violence
(10) Prevention of suicide and depression
(11)
Programs for Other High risk groups
Indicator4: programs that document the frequency and causes of injuries ··· 80
(1) Injury surveillance committee
(2) Injury surveillance at glance
(3) Data sources
(4) Future plan of sustainable injury surveillance/data collection
(5) Overview of injury surveillance committee
Indicator5:
evaluation measures to assess their programs, processes and the effects of change ··· 85
1 Ongoing Management of the Safe Community Programs ··· 85
2 Assessment of Each Prioritized Challenges ··· 86
(1) Prevention of injuries and accidents of children
(2) Safety of the seniors
(3) Safety of the physically disabled
(4) Bicycle Safety
(5) Safety in commercial and entertainment district (downtown)
(6) School safety
(7-1) Prevention and preparedness of earthquake disasters
(Community Development with Residents Participation)(7-2) Prevention and preparedness of earthquake disasters
(Disaster Preventing Activities by Residents)(8) Prevention of child abuse
(9) Prevention of domestic violence
(10) Prevention of suicide and depression
Indicator6:
ongoing participation in national and international Safe Communities network ··· 93
(1) Participation in the domestic network
(2) Participation in the international networks
Chapter6 Long-term Perspective of Toshima City Safe Community ··· 97
1 Long-term Goals ··· 99
(1) Sharing the basic concept of Safe Community
(2) Comprehensive efforts for health and safety
(3) Enliveneding activities at community plazas (Kumin-Hiroba)
2 Programs for ensuring long-term activities ··· 100
(1) Positioning in the Basic Ordinance Related to Promoting Autonomy in Toshima City
1
Chapter 1
3
(1) Location and Area
Toshima City is located in the northeastern Part as one of 23 cities in Metropolitan Tokyo (MT)
and has an area of 13.01km², making it the 18th largest city in Tokyo. Shaped like a “bird
spreading its wings”, Toshima City extends 6,720 meters to the east and west, and 3,660 meters to
the north and south. Using Tokyo Bay as the average sea level, the city has a plateau shape which
reaches 36 meters at the highest point and 8 meters at the lowest point.
(2) Land Use
Categorized according to use, 47.7% of the city’s land is for residential use, 10.3% for public use,
7.9% for business use and 2.3% for industrial use. Twelve railway lines, from five companies,
pass through Toshima City. Tokyo’s only streetcar, the Arakawa Line, also passes through the
city. Commercial and business buildings, including department stores and Sunshine City, are
located around Ikebukuro Station, situated in the center of the city, thus forming a sub-center area.
On the average, approximately 2.54 million people commute through Ikebukuro Station each day
making it second only to Shinjuku Station. Commerce thrives around the railway stations
including Otsuka, Sugamo, Komagome and Mejiro. Sugamo is famous for the Jizo-Dori shopping
street, also known as Grandma’s Harajuku which is a popular spot for fashion among young
generation.
Fig. 1-1 State of Land Use
Toshima City
Metropolitan Tokyo’s 23 cities
Public area 10.3%
Commersial/ business
7.9%
Residence 47.7% Industry
2.3% Parks
etc. 6.7%
Road/Rail road 22.4%
Others 2.7%
13.01
㎢
Chihaya
Mejir Kanamecho
Minami- nagasaki
Nagasaki Senkawa
Takamatsu
Takada
Kami- Ikebukuro
Nishi- sugam
Komagome Sugamo Otsuka
Higashi- ikebukuro Zoshigaya
Rikkyo University
Nishi- ikebukuro
Ikebukuro honcho
Teikyo Heisei University
Gukushuin University Tokyo College
of Music
Taisho University
Ikebuku
Land Use, Urban Functions
4
(3) Education and Culture
Toshima City is home to universities such as Rikkyo, Gakushuin, Taisho, Tokyo College of
Music, Kagawa Education Institute of Nutrition, as well as about 130 educational facilities
including high schools, junior high school, elementary schools and kindergartens. The city
features culture facilities such as theaters, cinemas, historical museums, variety theaters and art
museums. Many individuals and community organizations are active in artistic and cultural
programs. Toshima City’s rich culture and artistic history includes the “Tokiwa-so”, an apartment
building where legends of manga Osamu Tezuka and Fujio Akatsuka created the culture of
manga.
Toshima City is also known as the cradle land of the “Someiyoshino Sakura”, the blossoms which
represent Japan.
Table 1-1 Educational institutions
Kinder-
Gardens
Elementary
schools
Jr. High
schools
High
Schools
Vocational
schools
Junior
colleges
Universities
Total
19
25
17
16
49
2
6
134
(4) Medicine
Toshima City has 16 hospitals and 411 clinics.
Table 1-2 Medical institutions and number of beds
(Ministry of Health Medical Institution Survey: as of October 1, 2010)
Hospitals
Clinics
Total
No. of
facilities
No. of beds
No. of
facilities
No. of
hospital
beds
No. of
facilities
No. of
beds
With beds
Without
beds
16
1,790
411
28
383
151
427
1,941
(5) Industry
Employment ranks highest in the “Service Industry” followed by “Wholesale, Retail Sales” and
“Food and Hotel Business”. Secondary industries such as “Construction” and “Manufacturing”
account for 10% of Toshima’s industry, and tertiary industries account for 90%.
Fig. 1-2 Employment according to industry
35 0
12,500 14,353 581
25,744 6,641
48,743 17,857
12,503
34,469 13,700
16,879 507
71,465 3,713
0 10,000 20,000 30,000 40,000 50,000 60,000 70,000 80,000 Agriculture, Forestry and Fisheries
Mining Building Manufacturing Electricity, gas, heat supply and water industry
Information-communication Transport Wholesale and retail trade
Finance and insurance
Real estate
Restaurant and lodging Medical welfare Education Composition services Service business Public affairs
(person)
5
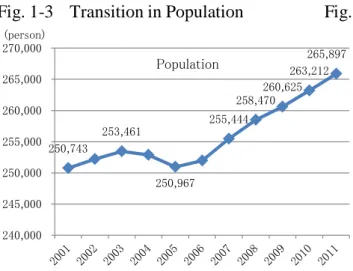
(1) Transitions in Population
As of January 1, 2011, the population of Toshima City was 265,897 people. As a result of increase
of 2,000 a year since fiscal 2006, the population density is 20,438 persons per km
2, making
Toshima the highest density urban area in Japan. The number of registered foreigners has also
increased since fiscal 2008, with 19,868 persons (4,081 permanent residents) registered as of
January 1, 2011.
Fig. 1-3 Transition in Population Fig. 1-4 Transition in number of registered foreigners
Table 1-3 Top five countries of registered foreigners
Fig. 1-5 Transition in population density
Country
No. of registered
persons
1
China
11,785
2
South Korea,
North Korea
3,543
3
Myanmar
940
4
Nepal
482
5
Philippines
428
19,273 19,482 19,290 19,634
20,033 20,438
13,335 13,572 13,746
13,989 14,255 14,424 12,000
14,000 16,000 18,000 20,000 22,000
(person/㎢)
Basic Resident Register and registered foreigners Toshima City
Avarage of MT's 23 cities
Population and Households
2
250,743
253,461
250,967
255,444 258,470
260,625 263,212
265,897
240,000 245,000 250,000 255,000 260,000 265,000 270,000 (person)
Basic Resident Register and registered foreigners Population
14,781
16,364
15,610
15,169 15,913
17,163 18,575
19,868
10,000 12,000 14,000 16,000 18,000 20,000 22,000 (person)
6
(2) Demographics
The population of Toshima shifts by about 20,000 persons each year because of move-in and out.
Move- in surpass move-out by about 3,000 people leading to a continued increase in population.
Looking at births and deaths, there are about 2,300 deaths per year compared to about 1,800 births.
Both births and deaths are increasing.
Fig. 1-6 Trend of move-in and out Fig. 1-7 Trend of births and deaths
(3) Daytime population
According to the National Census conducted in fiscal 2005, the daytime population of Toshima
City is 380,000 people including workers and students. This greatly surpasses the nighttime
population. In age groups, the difference of daytime and nighttime population is large in all age
groups excluding 0 to 14 years and 65 years and older. In the younger groups of 15 to 19 and 20 to
24, the daytime population is double the nighttime population.
Fig. 1-8 Comparison of daytime and nighttime population according to age groups.
0 10,000 20,000 30,000 40,000 50,000 0~14
15~19
20~24
25~29
30~34
35~39
40~44
45~49
50~54
55~59
60~64
65~74
74yrs <
(person) night population
day population
(National Census) 21,853
20,898
24,802
22,273
23,057
20,371 20,360
18,825 19,300
19,796
16,000 18,000 20,000 22,000 24,000 26,000 (person)
(Basic Resident Register) Move in Move out
1,974 1,994
2,145 2,106 2,144 2,103 2,096 2,181 2,172 2,286
1,463 1,551 1,455 1,459 1,474
1,570 1,657 1,644
1,796 1,793
0 500 1,000 1,500 2,000 2,500
(person)
(Basic Resident Register) Death
7
(4) Aging population and lower birthrate
As of January 1, 2011, the 65 year and older
population in Toshima City was 20.8%, and
the 14 year and younger population was 8.6%.
The aging population combined with the
diminishing number of children is the most
pronounced of all of Tokyo’s 23 cities.
(5) Household composition
Looking at household composition, in 1965
parent-child households accounted for almost
half of the city’s households. In 2005, this
number had halved to 23.6%. On the contrary,
the number of single-person households has
increased reaching 60% in fiscal 2005. When
Tokyo’s 23 cities are compared, it is apparent
that the ratio of single-person households is
especially high
in Toshima.
The percent of senior citizens living alone is
also high. According to the Basic Resident
Register of January 1, 2011, 19,546 people or 38.2% of all senior citizens were living alone.
Fig. 1-10 Composition of households in
Toshima City
16% 17% 18% 19% 20% 21% 22% 23% 24% 25%8% 9% 10% 11% 12% 13% 14% 15%
← O lde r popul at ion
Younger population→
(Basic Resident Register)
Chuou Taito Kita Itabashi Ota Meguro Minato Shinagawa Setagaya Shinjuku Nakano Suginami Toshima Bunkyo Katsushika Adachi Nerima Edogawa Arakawa Sumida Koto Chiyoda Shibuya
(1- jan-11)
Fig. 1-9 Comparison of senior citizens and
youth in 23 citys
Fig. 1-11 Comparison of parent-children
households and single-person
households in 23 cities in MT
30% 35% 40% 45% 50% 55% 60% 65%
20% 25% 30% 35% 40% 45%
← S in g le -pe rs on hous e hol ds
Parent-chiildren households →
(National Census)
Chuou
Chiyoda Taito
Kita Itabashi Ota Meguro
Minato
Shinagawa
Setagaya Shinjuku Nakano
Suginami Shibuya Toshima Bunkyo Katsushika Adachi Nerima Edogawa Arakawa Sumida Koto Toshima city
Parent-children household 23.6% Single-person household 59.4% 46.9% 42.0% 38.0% 36.7% 35.0% 32.5% 29.5% 26.0% 23.6% 14% 12% 12% 11% 13% 13% 14% 14% 13% 29.3% 37.8% 44.2% 47.0% 47.7% 49.7% 52.3% 56.2% 59.4% 10% 8% 6% 5% 5% 5% 4% 4% 4%
0% 20% 40% 60% 80% 100%
9
Chapter 2
11
(1) “Safety” and “Community” the essence of high-density urban areas
Toshima City has Japan’s largest
high-density urban area. Various
functions including culture, commerce,
business, residence and education are
integrated into a compact area.
Toshima is home to a diverse range of
people who generate vitality through
their actions.
At the same time, Toshima has one of
Tokyo’s busiest commerce areas
around Ikebukuro Station, where 2.54
million people pass through each day.
The city is disabled with safety
concerns unique to a high-density
urban area. These include crime
prevention, environmental cleanup,
traffic, and ensuring safety in dense
residential areas which are vulnerable
to earthquake damage.
With move- in and out exceeding
20,000 people a year, single-person
households accounting for 60% of households, a high proportion of elderly people living alone
and a low birth rate are all characteristics of Toshima City, these factors are also a challenge for
development of communities and bonds between people.
(2) Increasing “safety” supported by a rich community force
Challenges to “safety” and “community” are basic issues which Toshima City constantly faces.
These are also the foundation for creating pillars of strategic growth including cultural policies,
environmental policies and urban regeneration.
We feel truly “safe” only when “safety” and “community” enrich our daily lives.
The Safe Community activities ensure a safe living environment, and aim to improve the quality
of safety and health by creating connections which extend beyond a rich community and
organizations. This is the model of Toshima’s policy for basic challenges.
By expanding these Safe Community activities, we hope to use “safety” as the starting point to
extend the bond of people within the community and through that promote a development of a
“safe” community supported by high ability of community.
Various programs to protect safety of our communities are carried out in Toshima City. These
programs will be referred to the six standards indicated by the WHO Collaborating Centre on
Community Safety, Promotion to evaluate the influences from a scientific perspective and gain
new ideas and methods. Through this, we hope to significantly improve programs for “Health”
and “Safety” promotion.
Big number of visitors
Most high-densed
population Large commercial
and entertainment area”Ikebukuro”
Crowded urban areas Little nature
Accumulation of a commercial function Numerousness
of the daytime populations
One-person household 60%
Aging society population of elderly takes21%
Senior citizens living alone
3 %
Co-existence with foreigners
People moving in and out exceeding 20,000 annually
Total fertility rate 0.88
Fewer children (14 yrs and younger takes
only 8% Challenges to
safety
Challenges to community Highly-dense urban community
Significance of Toshima’s Actions
12
(3) Reducing medical and care-giving costs, etc.
As Japan enters an unprecedented aging society, it is expected that medical care costs will further
increase. It is essential that the Safe Community activities prevent and reduce unintentional
injuries and suicides. In addition, we hope that these activities will lead to an overall reduction in
medical and health care costs by preventing the elderly injuries by falls and residents who require
medical care.
2009
Research on Safe Community started
2010
February:
Safe Community Program declared
March:
Registered as “City in preparation stages” with WHO Collaborating Centre
on Community Safety Promotion
May:
Toshima City Safe Community Steering Committee set up
Community diagnosis
October:
Residents Meeting for Safe Community (1,500 participants)
November:
“Basic Policy for Safe Community Certification” enacted
December:
Task forces committees set for prioritizes themes
2011
January:
Injury Surveillance Task Force formed
March: The East Japan Great Earthquakes
June:
Disaster prevention forum (1,000 participants)
Preliminary review by SC Asian Certifying Center (Korea)
Reports from task force committees presented for preliminary review
“Toshima Safety Festival” held
(co-sponsor: Nihon Shimin Anzen Gakkai)
December:
Application report for designation submitted to
SC Asian Certifying Center
2012
February:
Field review by SC Asian Certifying Center (scheduled)
Progress of Actions and Programs
2
13
Chapter 3
14
Legend
“Demographics Statistics” “Ministry of Health, Labor and Welfare”
Emergency Medical Service (Emergency transport data) “Tokyo Metropolitan Fire Department”
“Metropolitan Police Department Statistics” “Metropolitan Police Department”
“City Citizen Awareness& Awareness Survey” Refer to Chapter 5 Index 4 for details
“Survey on Injuries and Accidents by Children” Refer to Chapter 5 Index 4 for details
“Survey on Injuries and Accidents by Senior Citizens”
Refer to Chapter 5 Index 4 for details
“Survey on Injuries and Accidents by Disabled Persons”
Refer to Chapter 5 Index 4 for details
Composition
(1) When compared with national or metropolitan statistics, indicated as
Per 100,000 people
(2) Rate of occurrence in Toshima City indicated as percentage
Real numbers
Data for fiscal 2010
5-year average for 2006 to 2010
Demographics
Children Survey City Resident Survey
Rate of occurrence EMS
Composition
Real numbers
Disabled Persons Survey Police statistics
Senior Citizen Survey
15
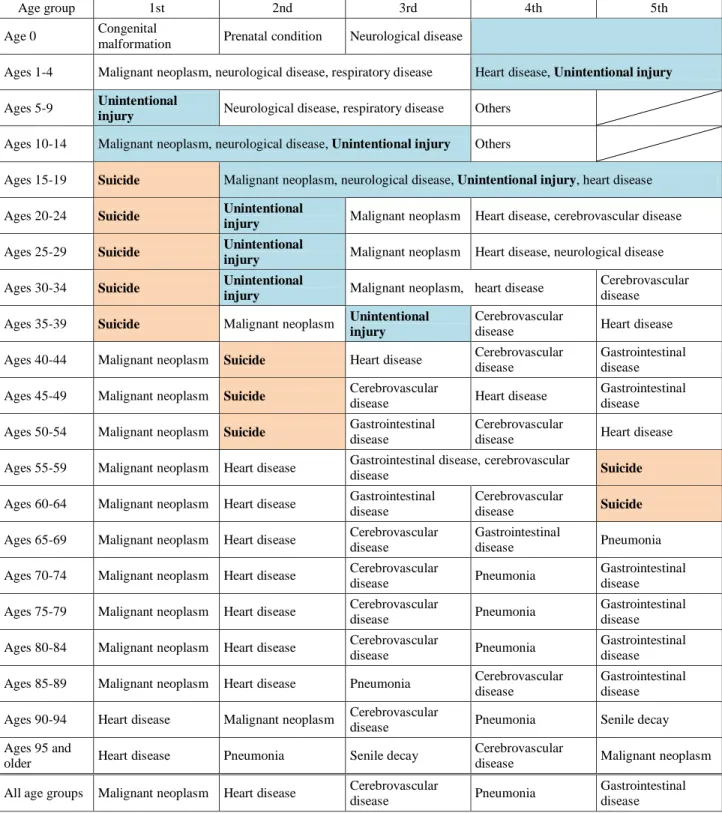
(1) Causes of death including illness
2,000 or more people die in Toshima City every year. Looking at the age groups in the past ten
years, death by “unintentional causes” is in the top five causes in the 0 to 39 age group. “Suicide”
is one of the five top causes of death in the 15 to 64 age group, posing a challenge to the city.
Table 3-1 Ranking causes of death by age group (Average for ten years from 2001)
Age group 1st 2nd 3rd 4th 5th
Age 0 Congenital
malformation Prenatal condition Neurological disease
Ages 1-4 Malignant neoplasm, neurological disease, respiratory disease Heart disease, Unintentional injury
Ages 5-9 Unintentional
injury Neurological disease, respiratory disease Others
Ages 10-14 Malignant neoplasm, neurological disease, Unintentional injury Others
Ages 15-19 Suicide Malignant neoplasm, neurological disease, Unintentional injury, heart disease
Ages 20-24 Suicide Unintentional
injury Malignant neoplasm Heart disease, cerebrovascular disease
Ages 25-29 Suicide Unintentional
injury Malignant neoplasm Heart disease, neurological disease
Ages 30-34 Suicide Unintentional
injury Malignant neoplasm, heart disease
Cerebrovascular disease
Ages 35-39 Suicide Malignant neoplasm Unintentional
injury
Cerebrovascular
disease Heart disease
Ages 40-44 Malignant neoplasm Suicide Heart disease Cerebrovascular
disease
Gastrointestinal disease
Ages 45-49 Malignant neoplasm Suicide Cerebrovascular
disease Heart disease
Gastrointestinal disease
Ages 50-54 Malignant neoplasm Suicide Gastrointestinal
disease
Cerebrovascular
disease Heart disease
Ages 55-59 Malignant neoplasm Heart disease Gastrointestinal disease, cerebrovascular
disease Suicide
Ages 60-64 Malignant neoplasm Heart disease Gastrointestinal disease
Cerebrovascular
disease Suicide
Ages 65-69 Malignant neoplasm Heart disease Cerebrovascular
disease
Gastrointestinal
disease Pneumonia
Ages 70-74 Malignant neoplasm Heart disease Cerebrovascular
disease Pneumonia
Gastrointestinal disease
Ages 75-79 Malignant neoplasm Heart disease Cerebrovascular
disease Pneumonia
Gastrointestinal disease
Ages 80-84 Malignant neoplasm Heart disease Cerebrovascular
disease Pneumonia
Gastrointestinal disease
Ages 85-89 Malignant neoplasm Heart disease Pneumonia Cerebrovascular
disease
Gastrointestinal disease
Ages 90-94 Heart disease Malignant neoplasm Cerebrovascular
disease Pneumonia Senile decay
Ages 95 and
older Heart disease Pneumonia Senile decay
Cerebrovascular
disease Malignant neoplasm
All age groups Malignant neoplasm Heart disease Cerebrovascular
disease Pneumonia
Gastrointestinal disease
Demographics
Circumstances of Deaths
16
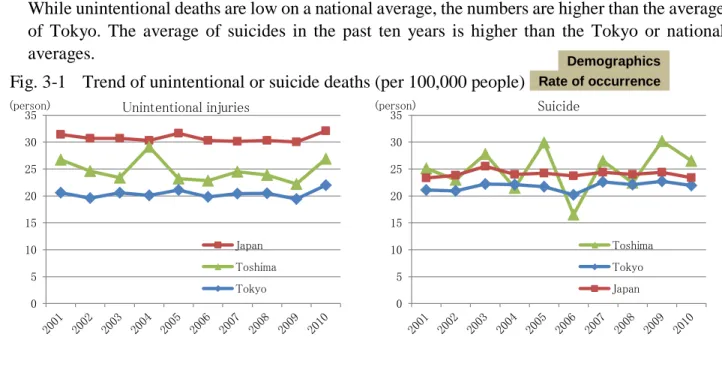
(2) Trend of death by unintentional accidents and suicides
While unintentional deaths are low on a national average, the numbers are higher than the average
of Tokyo. The average of suicides in the past ten years is higher than the Tokyo or national
averages.
Fig. 3-1 Trend of unintentional or suicide deaths (per 100,000 people)
(3) Circumstances of unintentional or suicide death according to age group
About 60 people die unintentionally each year. The unintentional deaths of elderly people are
increasing yearly. The main causes are tripping/falling, drowning or suffocation. About 60 people
die each year by suicide, with the numbers increasing in the 20 to 60 age groups.
Fig. 3-2 Number of unintentional deaths according to age group and cause
(Annual average for five years from 2006 to 2010)
traffic
accident,
13.4, 21.9%
exposure to
fire and
smoke, 11.6,
19.0%
poisoning,
10.6, 17.3%
other, 6.2,
10.1%
, 3.6, 5.9%
, 3.4, 5.6%
, 12.4, 20.3%
composition of
cause of death
(
all age
)
0.4 0.2 0.2 1.0
0.4 0.2 0.4 0.2 0.8 1.0 0.6 0.2 0.4 0.2
0.2 0.2 0.2 0.2 0.2
1.4 0.6
0.2 1.8
1.0 2.4 2.0
1.4 1.6
0.2
0.2 0.2 0.6 0.2 0.6 1.0 0.6 1.8 2.4 2.2 0.6
0.2 0.6 0.4 0.2 0.6
1.0 0.2
1.2 1.4
1.4 2.2
1.0 1.2 0.2
0.2 0.2
0.4 0.8 0.4 0.6 0.8 0.4 0.4
0.2 0.8 0.4 0.2 0.6 0.2 0.2 0.4 0.8 0.6 0.4 0.8 1.8 0.8 2.2 1.6 1.6 1.2 0.2 0 1 2 3 4 5 6 7 8 9 10
(person)
(years old)
other poisoning
exposure to fire and smoke suffocation
drowning fall
traffic accident
thre ere no death by unintentional
injuries fat 0-14 years lod for the last ten years
0 5 10 15 20 25 30 35
(person) Suicide
Toshima Tokyo Japan 0 5 10 15 20 25 30 35
(person) Unintentional injuries
Japan Toshima Tokyo
Demographics
Demographics Real numbers Rate of occurrence
traffic accident, 13.4, 21.9% exposure to fire and smoke, 11.6, 19.0% poisoning, 10.6, 17.3% other, 6.2, 10.1% exposure to fire and smoke, 3.6, 5.9% poisoning, 3.4, 5.6% other, 12.4, 20.3% composition cause of
17
Fig. 3-3 Number of deaths by suicide according to age group
Table 3-2 Trend of deaths by injury
Cause of death
Number of deaths (Persons, 65 and older shown in parentheses)
2006
2007
2008
2009
2010
Unintentional injury
56(37)
63 (43)
60 (42)
56 (40)
71(50)
Traffic accident
8 (4)
7 (5)
6 (3)
4 (3)
6 (1)
Tripping/falling
14 (9)
13 (10)
13 (11)
17 (13)
10 (9)
Drowning or
submersion
14 (9)
9 (7)
9 (9)
9 (7)
12 (11)
Suffocation
6 (5)
16 (11)
12 (8)
11 (9)
13 (10)
Exposure to smoke or
fire
1 (1)
3 (2)
5 (2)
4 (2)
5 (2)
Poisoning from
harmful substance
2 (0)
4 (0)
2 (0)
4 (1)
5 (1)
Other Unintentional
injury
11 (9)
11 (8)
13 (9)
7 (5)
20 (16)
Suicide
42 (12)
67 (10)
58 (14)
79 (13)
70 (13)
Murder
1 (0)
0 (0)
0 (0)
0 (0)
0 (0)
Total
99(37)
130(43)
118(42)
135(40)
141(50)
* Toshima City has had no deaths caused by unintentional injury, suicide or murder in the 0 to 14 age group in
the past ten years.
Demographics Real numbers
Demographics Real numbers
2006 to 10
- - 0.2 3.0
3.8
2.0 2.0 1.8
1.4 1.0 1.2 1.2 1.0 1.2 1.4
0.4 0.4 - 0.2 - -
0.4 1.2
3.8
4.2 3.6
3.4 3.0
4.8 4.6 4.2
2.8 2.8 1.2
0.4 0.4
0.2 - 0
1 2 3 4 5 6 7 8
(person)
(years old)
18
(4) Situation of unintentional death in elderly persons
When looking at the cause of unintentional deaths in elderly persons, while traffic accidents are
on the decline, death by tripping/falling, suffocation and drowning are on the increase.
Fig. 3-4 Causes of unintentional deaths in elderly persons
9
10
11
13
9
5
11
8
9
10 9
7
9
7
11
4
5
3 3
1
2 2 2 2
0 0
2 4 6 8 10 12 14
2006 2007 2008 2009 2010
(person)
fall
suffocation drowning traffic accident
exposure to fire or smoke poisoning
Demographics Real numbers
Rate of occurrence
In Toshima City which is aging quickly, the number of elderly persons living alone is
increasing. At the same time, the number of “solitary deaths” where a person isolated from the
local society dies is also increasing.
Fig. 3-5 Trend of solitary deaths (per 100,000 persons)
* Number of unnatural deaths by elderly persons age 65 or older living alone which were autopsied by the Tokyo Metropolitan Medical Examiner to determine the cause of death
20.1 18.6
26.7 28.3
31.6
49.5
15.0 16.4
19.8 22.1
25.3
32.5
0 10 20 30 40 50 60
00 01 02 03 04 05 06 07 08 09 10
(person)
Toshima 23 Cities of MT
19
Column Overview of deaths and injuries in Toshima City based on survey results
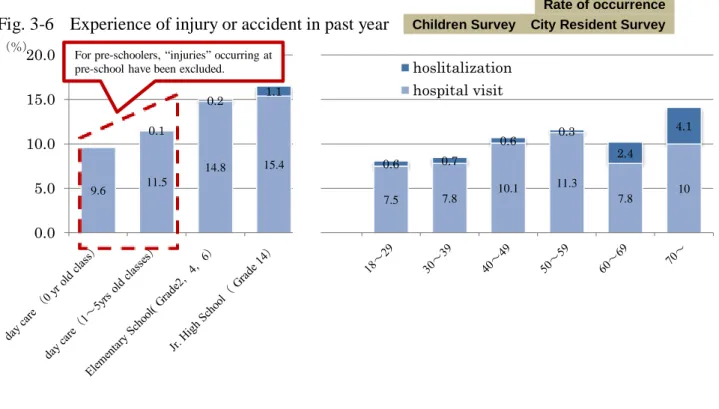
(1) Statistics of resident injuries
Analyzed experience of injury from the results of questionnaire survey, around 10% at the age
group of 0-5 years old and around 15% among school children has experienced injuries. As for the
age group over 18 years old, the rate of experience in being injured tends to be higher as age goes
up, and especially residents have high tend to be hospitalized from injury when they become 60
years old or over.
Fig. 3-6 Experience of injury or accident in past year
When the numbers are tabulated, the numbers for all city residents over the age of 18 shows that
for every death the number of hospitalizations is approx. 65-fold and the number of outpatient
cases is approx. 340-fold.
Fig. 3-7 Overview of deaths and injuries (Tabulated from demographics survey and city
resident survey)
* The number of hospitalizations, outpatient cases and close-call accidents is based on the “number of injuries and accidents in the past year”. The values have been converted for the population (244,637 people) and population of the age of 70 (36,594 people) registered in the Basic Resident Register as of January 1, 2011.
9.6 11.5
14.8 15.4
7.5 7.8 10.1
11.3
7.8 10
0.1
0.2 1.1
0.6 0.7
0.6 0.3
2.4
4.1
0.0
5.0
10.0
15.0
20.0
(%)hoslitalization
hospital visit
For pre-schoolers, “injuries” occurring at pre-school have been excluded.
Hospital visit 3,660(10.0%)
Hospitalization 1,500(4.1%)
70years< Deaths 63
Hospital visit 24,220(9.9%)
Hospitalization 4,650(1.9%)
18years< Deaths 71
Children Survey City Resident Survey Rate of occurrence
Circumstances of Injuries
2
(person)
20
(2) Circumstances of emergency transport due to injury
In 2010, there were 4,581 transportations to hospitals by ambulance due to injuries and accidents
in the city. Calculated incidence rate at each age group adjusted based on day time population, the
incident rate inside home is higher than outside and children under 5 years old and the elderly
have higher rate than other age groups.
Fig. 3-8 Rate of accidents resulting in emergency transport
Analyzing cases of injuries sent to hospital by ambulance, as a whole generation, fall takes 42.3%
as the highest followed by traffic accident of 25.0%. As other causes, assault takes 5.9%,
self-harm as 2.9%, sports injury and occupational injury take around 2% each. As for elderly at 65
years old and over, fall takes about 70% and among children under 15 years old, the rate of
general injuries except fall and sport injury tend to higher compared to other age groups.
Fig. 3-9 Types of accidents
All ages
Ages 0 to 14 Ages 65 and older
Total 4,581 289 (100.0%) 1,465 (100.0%)
General injuries
(fall) 1,937 107 (37.0%) 1,051 (71.7%)
General injuries
(except fall) 865 93 (32.2%) 203 (13.9%)
Traffic accidents 1,145 71 (24.6%) 163 (11.1%)
Assaults 268 4 (1.4%) 15 (1.0%)
Self-harm 132 1 (0.3%) 9 (0.6%)
Sport injury 100 13 (4.5%) 4 (0.3%)
Occupational injuries 97 0 (0.0%) 11 (0.8%)
Fire 26 0 (0.0%) 6 (0.4%)
Drowning 10 0 (0.0%) 2 (0.1%)
Natural disaster 1 0 (0.0%) 1 (0.1%)
General injury
(fall)
42.3%
General injury
(except
fall)
18.9% Traffic
accident 25.0% Assault
6.0% Self-harm
2.9% Sport Injury 2.2%
Occupation al injuries 2.1%
Fire
0.6% Drowning
0.2%
National disaster 0.0%
4,581 cases
0.0 0.5 1.0 1.5 2.0 2.5 3.0 3.5 4.0 4.5 5.0
(%)
(years old) Indoor Outdoor
EMS 2010 Rate of occurrence
21
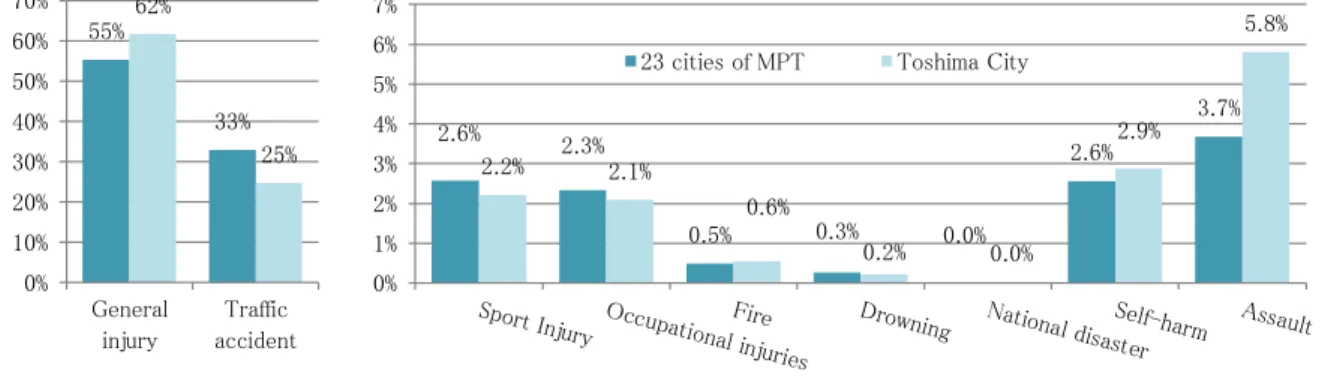
Comparing the type of accidents occurring in Toshima City compared to the 23-city of MT
average, traffic accidents, sports accidents and labor accidents were low in Toshima, but general
injuries, fire accidents, self-inflicted injuries and assault were higher.
Fig. 3-10 Comparison of Toshima City and 23 city of MT accident type component ratio
When looking at the place where emergency transport originated, general roads was highest at
40%, followed by residents and stations. For children and elderly people, injuries occurred at
home more often than on general roads.
Fig. 3-11 Place of injuries occurred
All ages
Ages 0 to 14 Ages 65 and older
Total 4,581 289 (100.0%) 1,465 (100.0%)
Roads 1,879 82 (28.4%) 513 (35.0%)
Residences 1,250 97 (33.6%) 576 (39.3%)
Stations 438 14 (4.8%) 154 (10.5%)
Restaurant 216 5 (1.7%) 32 (2.2%)
sales facility 210 26 (9.0%) 67 (4.6%)
School 80 23 (8.0%) 1 (0.1%)
Accommodation 52 3 (1.0%) 10 (0.7%)
Others 456 39 (13.5%) 112 (7.6%)
Roads 41.0%
Residence 27.3% Station
9.6%
Restaurant 4.7%
sales facility
4.6% School
1.7%
accommoda tion 1.1%
Others 10.0%
4,581 cases
2.6% 2.3%
0.5% 0.3% 0.0%
2.6%
3.7%
2.2% 2.1%
0.6%
0.2% 0.0%
2.9%
5.8%
0% 1% 2% 3% 4% 5% 6% 7%
23 cities of MPT Toshima City 55%
33% 62%
25%
0% 10% 20% 30% 40% 50% 60% 70%
General injury
Traffic accident
EMS 2010 Composition
22
The most frequent cause of emergency transport from injury was falling at 37.5%. Injuries
resulting from a bicycle, automobile, motorcycle or while walking totaled approx 25%. The ratio
of falling was high for elderly people.
Fig. 3-12 Cause of injury
When looking at the type of injury and sickness which required emergency transport, blows and
bruises were highest at 60%. This was followed by fractures at 13.8%.
Fig. 3-13 Names of injury and sickness
All ages
Ages 0 to 14 Ages 65 and older
Total 4,581 289 (100.0%) 1,465 (100.0%)
Fall 1,650 78 (27.0%) 958 (65.4%)
Fall (From High level) 335 48 (16.6%) 105 (7.2%)
Injured with bicycle 433 33 (11.4%) 77 (5.3%)
Injured with automobile 240 8 (2.8%) 23 (1.6%)
Injured with motorcycle 235 0 (0.0%) 15 (1.0%)
Injured while walking 196 26 (9.0%) 40 (2.7%)
Beaten, kicked 194 3 (1.0%) 9 (0.6%)
Collision 180 29 (10.0%) 24 (1.6%)
Cut with edged tool 111 3 (1.0%) 10 (0.7%)
Sleeping medication,
painkiller, tranquilizer 89 0 (0.0%) 0 (0.0%)
Others 741 61 (21.1%) 204 (13.9%)
All ages
Ages 0 to 14 Ages 65 and older
Total 4,446 289 (100.0%) 1,465 (100.0
%)
Contusion 2,623 193 (66.8%) 840 (57.3%)
Bone fracture 608 23 (8.0%) 359 (24.5%)
Open wound 406 31 (10.7%) 119 (8.1%)
Dislocation, sprain 269 12 (4.2%) 44 (3.0%)
Poisoning 151 1 (0.3%) 10 (0.7%)
Suffocation 48 10 (3.5%) 21 (1.4%)
Burn 47 10 (3.5%) 10 (0.7%)
Others 252 9 (3.1%) 62 (4.2%)
Fall 36.7%
Fall(from high level)
7.4% Injured
with bicycle
9.8% Injured
with automobile
5.3% Injury with motorcycle
5.2% Injured
while walking
4.3% Beaten・
kicked 4.3% Collision
4.0% Cut with edged tools
2.5%
Sleeping medicine etc.
2.4% Others 18.4%
4,581 cases
EMS 2010 Composition
EMS 2010 Composition
Contusion 57.3% Bone
fracture 13.3% Open wound 8.9% Dislocation
・sprain
5.9% Poisoning
3.3% sufforcation
1.0%
Burn 1.0%
Others 9.4%
23
Seeing causes of injuries among foreign visitors/travelers, fall is the most frequent cause which
takes 40 % of all injuries.
Fig. 3-14
Cause of injuries which was sent to hospital by ambulance
(3) Children’s Injuries
When the rate of emergency transport from indoor injuries for children between the ages of 0 to 4
is looked at, ages 0 to 1 were highest at 3.3%. The rate of injury occurrence declined as the child’s
age increased. Half of the injuries were caused by tripping, falling or slipping. “Drowning” is
listed as a cause in the statistics, but there have been no drowning in Toshima City.
Fig. 3-15 Cause of indoor injuries by children under the age of 4
A
A A A
B
B
B
B C
C
C
C
D
D
D E
F
F
F G
G
G H
H
H
H 3.3
2.3
1.8
0.9
0.0 0.5 1.0 1.5 2.0 2.5 3.0 3.5
0~1 2 3 4
(%)
(years old)
H Others G Dragged F Foreign object E High heat・fire
D Caught・pinched
C Collision
B Fall (from high level) A Fall
Fall 42.3%
Beaten,kicke d 19.2% Traffic
accident 11.5%
Fire 3.8% Self-harm
3.8%
Other general injury
19.2%
26 cases
EMS 2010 Composition
24
Most injuries, when looked at by type of injury and sickness, are the result of blows and bruises.
Suffocation and accidental ingestion have occurred in ages 0 to 3, and burns have occurred only in
ages 0 to 1.
Fig. 3-16 Indoor injuries by children under the age of 4
When the place of injury or accident by elementary or junior high school children was surveyed,
the rate of occurrence was highest at school followed by injuries at sports related facilities.
Fig. 3-17 Place of injury occurred
A
A
A
A
B
B
B
B C
C
C
D E
E
E F
H
H 3.3
2.3
1.8
0.9
0.0 0.5 1.0 1.5 2.0 2.5 3.0 3.5
0~1 2 3 4
(%)
(years old)
Indoor
H.Other injureis
G.Poisoning
F.Bone fracture
E.Dislocation・sprain
D.Burn
C.Supporcation
B.Open wound
A.Contusion
Children survey Composition
Home
Home Roads
Roads
Park/square
Park/square
Other public places
Schools
Schools
Sports facilities
Sports facilities Others
Others
0% 10% 20% 30% 40% 50% 60% 70% 80% 90% 100%
Elementary School
Jr. High School
Home Roads Park/square Other public places Stores Schools Sports facilities Others
25
(4) Elderly’s Injuries
When the cause of death by unintentional injuries in elderly people is looked at, the three main
causes are fall, drowning and suffocation. With examination of the circumstances of indoor
injuries among elderly people with the emergency transport data, fall takes 71.0% of all injuries,
while suffocation and drowning are lower.
Fig. 3-18 Causes of unintentional deaths in Fig. 3-19 Cause of emergency transport for injury
elderly people by elderly people
When the causes are studied based on a survey, 17.6% respondents had fallen at home, 0.8% had
almost drowned during taking a bath, and 12.9% had choked on food. Of those who had fallen,
19% had broken bones. In other words, 3% of all respondents had broken bones from falling.
Fig. 3-20 Experience of injury or accident by elderly people
Fig. 3-21 Circumstances of injury from falling
Bone fracture 18.9% Contusio n 30.2% abrasion・ incisure 23.7% No injury 27.2% 2,208 cases Traffic accident 7.5% Fall 24.5% Drowning 20.3% Suffocation 20.3% Exposured to smoke, fire 4.2% Poisoning 0.9% Other 22.2% 212 cases 81.4% 95.9% 84.0% 91.5% 17.6% 0.8% 12.9% 5.1%
0% 20% 40% 60% 80% 100%
自宅で転んだ経験 入浴中におぼれそうになっ
た経験 食べ物がのどに詰まりそうに
なった経験 火傷をした経験
ない ある 無回答
EMS 2010 Demographics 2006 to 10 Composition
Senior Citizen Survey Composition
Composition Composition Fall 64.0% Fall from hgher level 7.0% Injured while biking 5.1% Injured while walking 2.6% Collision 1.6% Injured while driving 1.5% Action with no contact with person/obj ect 1.5% Suffocatio n 0.9% Drowning 0.7% Other 15.1% 1,522 cases
Senior Citizen Survey
17.6% 0.8% 12.9% 5.1% 81.4% 95.9% 84.0% 91.5%
0% 10% 20% 30% 40% 50% 60% 70% 80% 90% 100%
Experience of fall at home
About to be drown during taking bath
About to suffocate with food
Experience of burn
26
When cases that elderly people were transported to hospitals due to tripping/falling indoors are
looked at, it is apparent that the rate of being transported increases as with age. The rate of bone
fracture also increases with age.
Fig. 3-22 Rate of emergency transport from elderly people tripping/falling (indoors) and name of
injury/sickness
(5) Injury by disabled people
In the city resident survey, 11.0% of city residents above the age of 18 had experienced injuries.
However, the rate of injury experienced by disabled people was higher than the city resident
average. The rate for visually-disabled people was especially high at 34.9%, which is as three
times high as the typical city resident average.
Fig. 3-23 Experience of outdoor injury by type of disability
34.9
14.7
19.4
15.3
9.0
15.0
11.0
57.1
82.7
70.6
78.6
77.1
79.0
82.4
7.9
2.7
10.0
6.1
14.0
6.0
6.6
0% 20% 40% 60% 80% 100%
visually challenged
hearing challenged
physically challenged
internal impediment
mentally challenged
mental illness
Survey on awereness and attitude of citizens(over 18 yesrs old)
Yes
No
N/A
骨折
骨折
骨折
骨折 打撲・挫傷
打撲・挫傷
打撲・挫傷
打撲・挫傷
M/標準
M/標準
M/標準
M/標準
0.0! 0.5! 1.0! 1.5! 2.0! 2.5! 3.0! 3.5!
高齢者全体 65_74 75_84 85_
(%)
(歳) その他 開放創・離断 打撲・挫傷 骨折
EMS 2010 Rate of occurrence
Bone fracture
Bone fracture
Bone fracture Contusion
Contusion
Contusion
Contusion
1.3
0.7
1.5
3.2
0.0 0.5 1.0 1.5 2.0 2.5 3.0 3.5
65yrs< 65_74 75_84 85_
(%)
(year)
Others
Open wound
Contusion
Bone fracture
27
(6) Injuries from traffic accidents
Traffic accidents in 2010 had dropped to 953, almost half compared to the peak of 1,885 accidents
in fiscal 2001. Serious injuries had also dropped to one-tenth of those in 2001. The occurrence rate
in Toshima City has dropped in recent years compared to the national and Tokyo statistics for
population of 100,000.
Fig. 3-24 Trend of traffic accidents
Fig. 3-25 Trend of traffic accidents
(Per population of 100,000)
While the total number of traffic accidents has been on a decline, the number of accidents
involving bicycles has stayed the same. The percent of accidents involving bicycles has increased
up to 47%.
Fig. 3-26 Trend of bicycle accidents
5 6 5 5 7 4 4
1 1 7 40
22 20
15 12
17
11 15
8 4 1,885
1,801 1,792 1,765 1,620
1,480
1,138
975 958 953
0 5 10 15 20 25 30 35 40 45 50
0 400 800 1,200 1,600 2,000
(person) (case)
no. of death
no. of severely injured no. of RTA
Police Statistics
Rate of occurrence Real numbers
Real numbers Police Statistics
Police Statistics
747
710 708 700 643
580
441
374 364 362
0 100 200 300 400 500 600 700 800
(case)
Japan
Tokyo
Toshima
689 662
595
571 591 554
441 378
454 444 37% 37%
33% 32%
36% 37%
39% 39%
47% 47%
0% 10% 20% 30% 40% 50%
0 400 800
2001 2002 2003 2004 2005 2006 2007 2008 2009 2010 (cases)
28
When we analyze the situations of traffic accident occurrences by generation, the ratios of
accidents of children and seniors are high while they are riding a bicycle.
Fig.3-27 Situations of Traffic Accidents by Generation
28.6%
51.7%
45.7%
37.3%
32.4%
43.1% 47.7% 47.4%
31.4%
27.4%
22.2% 5.9%
8.4% 8.8%
28.6%
6.9%
5.7%
20.9%
28.3%
29.4% 15.9%
10.5% 35.7% 36.2%
11.4%
13.4%
14.6% 19.6%
23.4%
26.3%
0% 10% 20% 30% 40% 50% 60% 70% 80% 90% 100%
~4 5~14 15~19 20~39 40~59 60~64 65~74 75~
(years old)
Others
Injured while walking
Injured while automobile
Injured while motorcycle
29
(7) Occupational injury
There were 97 cases of emergency transport because of occupational accidents in 2010. In age
groups, the 20s and 30s had the most accidents, followed by the 60s. The place of occurrence
reflects Toshima City’s industrial structure, with approx. 40% of accidents occurring at business
or commercial places such as stores, restaurants and offices. Approx. 20% of accidents occurred
at construction sites or factories. 60% of injuries were minor, 26.8% were moderate, and 10%
were serious or critical. 10.3% of injuries were fractures.
Fig. 3-28 Age groups Fig. 3-29 Place of occurrence
Fig. 3-30 Severity of injury
Fig. 3-31 Name of injury
According to the report on morbidity and mortality regarding to work places from Ikebukuro
Labor Standards Office in 2010, there were 261 cases of injury which result in 4 days or more
leave from work. Most frequent cause is fall which brings on a fourth of injuries.
Fig. 3-32 Injuries at work place in Toshima City
Outlet store; 15.5% Restaurant; 14.4% Company office; 12.4% Constructio n site; 12.4% Factory・ workshop; 9.3% Road; 10.3% Residence; 7.2% Lodging; 4.1% Station; 3.1% Police office/Polic e Box; 2.1% Others; 9.3% Occipational Injury 97 cases/year
3 6 5 2 4 3
1 18
18
11 7 15 3 1 0 5 10 15 20 25 30
0_9 10's 20's 30's 40's 50's 60's 70's 80's 90's
Male Female 2010 (case) 97case s/year EMS Real numbers Minor; 62.9% moderate; 26.8% severe; 9.3% serious; 1.0% Occipational Injury 97 cases/year Contusion; 37.1% Open wound; 30.9% Bone fracture; 10.3% Dislocation ・sprain; 6.2% Burn; 5.2% Others; 10.3% Occipational Injury 97 cases/year Composition 2010 EMS Composition 2010 EMS Composition 2010 EMS Composition 2010 Fall 26.1% unreasonable movement 15.7% Fall from diferrent level 13.4% RTA 9.2% Cut /rubbed 9.2% Ppinched in or
30
(8) Injury caused by sports activities
In 2010, there were 100 cases of emergency transport caused by sports or athletic competition
activities. In age groups, the 10s and 20s made up 60%, with 80% of the accidents by males.
Injuries as sports fields, gymnasiums and school facilities made up 70% of the injuries. 60% of the
injuries were minor, with fractures accounting for 21.0% of all injuries.
Fig. 3-33 Age groups Fig. 3-34 Place of occurrence
Fig. 3-35 Severity of injury Fig. 3-36 Name of injury
7
4 2 4 3
1 1
28
21
14 9
4 2
0 5 10 15 20 25 30 35 40
0_9 10's 20's 30's 40's 50's 60's 70's
(case)
Male
Female 100
cases
/ year
2010 EMS Real numbers
Gym/ Sport yard; 41.0%
Education al facility; 31.0%
Facility belongs to
Sport clubs ;
8.0% Other sports facility; 7.0%
Others; 13.0%
Sports Injuries
100 cases/year
Composition 2010
EMS
Minor; 64.0% moderate;
36.0% Sports
Injuries 100 cases/year
Contusion; 30.0%
Dislocation ・sprain;
26.0%
Bone fracture;
21.0% Tear of the
Achilles ten don; 7.0%
Open wound; 9.0%
Others; 7.0%
Sports Injuries
100 cases/year
Composition 2010 EMS
31
(9) Estimated Injury from earthquake disaster
In South Kanto Area, it is speculated that there is a 70% chance that a Class 7 magnitude
earthquake will occur in the next 30 years. In this event, it is estimated that the human casualties
will reach 77 deaths and 4602 injuries in Toshima. Compared to the average of MT’s 23 cities,
the effect of falling debris and block walls is high, and the effect of fires resulting from the
earthquake is low.
Fig. 3-37 Estimated casualties from epicentral earthquakes (deaths)
Fig. 3-38 Estimated casualties from epicentral earthquakes (injuries)
* Reference: "Estimated damage from epicentral earthquakes in Tokyo" (May 2006, Government of Tokyo)
Number of building per hectare in Toshima City is 4.01 buildings, which is largest among the 23
cities of MT. This situation may expand damages in case that fire is caused at multiple places at
the same time by big earthquakes.
Fig. 3-39
Density of building in 23 cities of MT
(
Survey on the use of land 2008
)
Collapsed buildings, 1716
Collapsed buildings, 38
slides of steep sloping land, 144
slide of steep sloping land, 2
Fire result from earthquackes,
3483
Fire result from earthquackes, 7
Collapsed brick fences, 400
Collapsed brick fences, 30
0% 20% 40% 60% 80% 100%
23 cities of MT Toshima
City
Shake/damaged building etc.,
70420 Shake/damaged
building etc., 2308
Object in house, 51770 Object in house,
1630
Fire result from earthquakes,
16002 Fire result from earthquakes, 210
Damaged by collapsed bricks,
6811 Damaged by collapsed bricks,
454
0% 20% 40% 60% 80% 100%
23 cities of MT Toshima
City
Number of deaths in Toshima City
77 persons
(0.06 persons per 1ha)
Number of deaths in MT 23 cities
5,743 persons
(0.09 persons per 1ha)
Number of casualties in Toshima City
4,602 persons
(3.54 persons per 1ha)
Number of casualties in MT 23 cities
145,003 persons
(2.35 persons per 1ha)
40.1
0 5 10 15 20 25 30 35 40 45
32
(10) Injury from assault
There were 268 cases of injury from assault in 2010. Injuries occurring around Ikebukuro Station
were highest at 58%, in the 20 to 30 age group. The highest cause was “beating/kicking” at 69%.
Fig. 3-40 Age of injuries
Fig. 3-41 Place of occurrence
Fig. 3-42 Cause of injury
Incidence rate of consultation child abuse is higher compared to the average of 23 cities of MT in
2010.
Fig.3-43 rate of consultation on child
abuse
for population of the age 0-17 years old
6.5% 2.2%
0% 2% 4% 6% 8%
Toshima City 23 Cities of MT
Beaten・ kicked; 68.7%
Fall; 6.3% Cut by
edged tools; 4.1% Collision;
3.4% Ccompressi
on; 3.0% Hit by dropped objects; 2.6%
Scratched; 2.6%
Others; 9.3%
injury by assault(Emergent
transport by amburance) 268cases/year
Around Ikebuk
uro Station ; 57.8% Other
areas; 42.2%
injury by assault(Emergent
transport by amburance) 268cases/year
2 10
89
64
42 32
19
5 3 1 0
10 20 30 40 50 60 70 80 90 100
(case)
2010 EMS
Real numbers Composition
2010 EMS
Composition 2010
EMS
33
The crime rate in Toshima City has dropped annually from the peak in 2003. Half of the crimes
occurring in Toshima City occur around Ikebukuro Station.
Fig. 3-44 Trend of crime cases
Fig. 3-45 Place of occurrence
According to the results of survey on the awareness and attitude for/of the gender-equal society,
around 20 % of respondents answered that they have experience in being suffered by violence of
their partners. The number of consultation on domestic violence has been increasing year by year
and as a result, it is as 4.2 times as it was in 5 year ago. It can be the result of enhancement of
consultation desks and publication to citizens.
Fig. 3-46 Experience in being suffered by Fig. 3-47
Number of consultation on DV
violence from partners
Around Ikebuku ro Station 46% Others 54%
Recorded crimes
7,162 cases
92 102 95
50 68 48 55 47 50 35 356
351 412
486
441 482 459
381 388 340 10,721 11,259
11,589 10,739
9,676 9,145
8,676
7,817 7,855 7,162 0 100 200 300 400 500 600 700 800 900 1,000 0 2,000 4,000 6,000 8,000 10,000 12,000
2001 2002 2003 2004 2005 2006 2007 2008 2009 2010 (cases) (cases) vicious crime violent crime no. reported cases(left) 18.3% 14.3% 20.3% 70.4% 73.2% 66.1% 11.3% 12.5% 13.6%
0% 20% 40% 60% 80% 100%
2009 2005 1998
(男女共同参画社会に関する住民意識調査)
暴力を受けた経験あり 暴力を受けた経験なし 無回答
43 44
65 84 180 0 20 40 60 80 100 120 140 160 180 200
2006 2007 2008 2009 2010
(case) Police statistics Real numbers Police statistics Composition 2010 20.3% 14.3% 18.3% 66.1% 73.2% 70.4% 13.6% 12.5% 11.3%
0% 20% 40% 60% 80% 100%
Dec.1998(n=560) Aug.2005(n=646) Aug.2009(n=591)
34
(11) Self-inflicted injuries
In 2010, there were a total of 132 emergency transports for self-inflected injuries (attempted
suicides). In age groups, cases in the 20s and 30s were highest, with high rates of women. The
severity of injury was relatively minor for the 20s to 30s, but tended to be severe in age groups
over 50.
The highest cause was ingestion of sleeping aids, etc., at 31.8%, followed by cutting with knives
at 29.5%. The name of injury reflects the cause with poisoning at the highest at 32.6% followed by
open wounds at 20.5%.
Fig. 3-48 Number of cases according to age Fig. 3-49 Severity of injury according to age
group group
Fig. 3-50 Cause
Fig. 3-51 Name of injury/sickness
5 35
17 9
5 8 4 2 1 3
11
8
8
9 6
1 0 5 10 15 20 25 30 35 40 45 50
10's 20's 30's 40's 50's 60's 70's 80's 90's (case)
(years old) Male
Female
EMS 2010
132 cases/
year
Real numbers EMS 2010 Real numbers
5 22
11 6
3 1 2 13 8 3 4 3 2 9 5 4 3 2 1 2 1 4
4 5
1 3 2
1 1 1 0 5 10 15 20 25 30 35 40 45 50
10's 20's 30's 40's 50's 60's 70's 80's 90's (case) (years old) Death Serious Sever Moderate Minor Poisoning; 32.6% Open wound; 20.5% Other injuries; 12.9% Contusion ; 11.4% Bone fracture; 2.3% Suffocatio n; 2.3% Nervous system disorder; 2.3% Others; 7.6% Unknown; 8.3% Self-harm (Emergent Transport by Ambulance) 132cases/year Hypnotic; 31.8% Knife/edg ed tools; 29.5% Hanging; 10.6% Leap; 9.1% Other drugs; 9.1% Other; 6.1% Unknown; 3.8% Self-harm (Emergent Transport by Ambulance) 132cases/year Composition 2010