Article
1. INTRODUCTION
Broadcasting services with higher resolution (i.e., 4K/8K) than HDTV (high definition television) have started in recent years [1], and images of super high definition, wide color gamut, and high dynamic range are becoming at hand. On the other hand, images on the Internet have a variety of resolutions depending on physical constraints such as network speeds or image size of display devices. Therefore, it is desirable for 4K/8K images that
the image resolution obtained from a compressed codestream is scalable according to network and display device environments. For example, JPEG 2000 for still images and scalable extension of H.264/HEVC (SHVC) for moving images [2] can realize the spatial resolution scalability.
In such circumstances where various resolution images exist in the same realm, we have proposed new image compression scheme with a premise that high-resolution images are more valuable assets than low-resolution ones [3], [4]. The
Steganographic Image Compression Method with Adaptive Enhancement Code
Embedding and Its Performance Evaluation on 4K Standard Test Images
Isao FURUKAWA* and Junji SUZUKI**
(Received Oct. 31, 2020) Abstract
We have studied a steganographic image compression algorithm that embeds special codes (i.e., enhancement codes) in the encoder, and extracts these codes in the decoder to reconstruct full-resolution image. The compressed codestream from the encoder also can be decoded by standard JPEG decoder even though the resolution of reconstructed image decreases by half, so that this encoder has backward compatibility with JPEG. In embedding enhancement codes into lower DCT coefficients, there is an upper limit for the amount of codes (i.e., payload) in order to make the distortion by bit-embedding as small as possible. Although the conventional algorithm employs the constant number of scans of higher DCT coefficients to create the enhancement codes, it appears to be a bottleneck for DCT blocks that allow enough room in the payload. We propose an adaptive determination method of the enhancement codes based on the payload of each DCT block while conforming to the specifications of JPEG. This method effectively utilizes the payload in all the DCT blocks, so the quality improvement of the reconstructed image is expected. Moreover, we propose an HVS-based order rather than zigzag scan order for embedding the enhancement codes in hope of alleviating the distortion due to bit-replacement. As a result of evaluation with four 4K standard test images, the adaptive method can increase the amount of enhancement codes, and this leads to SNR improvement in comparison to the conventional constant method. Some decoded examples of both 4K/2K images are also shown. Key Words: steganography, image enhancement, JPEG, entropy coding, HVS, 4K image
* Department of Computer Science, Faculty of Applied Information Science, Hiroshima Institute of Technology ** School of Information Science and Technology, Aichi Prefectural University (retired)
proposed method offers a mechanism to embed secret codes into lower DCT coefficients, and only special parties knowing the fact can recover full-resolution images, while others decode low- resolution images by using standard JPEG decoder. We call the scheme image enhancement method with steganographic data embedding (shortly, steganographic coding or steganographic encoder/ decoder). This steganographic encoder uses JPEG as a basic coding configuration, and embeds run-length Huffman codes created from 16×16 higher DCT coefficients into 8×8 lower DCT coefficients. These codes for augmenting visual resolution are called enhancement codes, and the output codestream including the secret codes conforms to JPEG specifications, so that the steganographic encoder has backward compatibility with JPEG decoder. At the steganographic decoder, the enhancement codes can be extracted from lower DCT coefficients to reconstruct higher DCT coefficients. As a result, the steganographic decoder obtains high-resolution images, while standard JPEG decoder obtains only low-resolution images (1/2 lower resolution in horizontal and vertical directions).
As the distortion due to steganographic coding should be as low as possible, the amount of enhancement codes embeddable to lower DCT coefficients has an upper limit called payload. The conventional method determines the number of higher DCT coefficients for creating enhancement codes in advance not to exceed the payload: this determination method uses the constant number of scans for higher DCT coefficients in all the blocks. However, it cannot utilize the inherent payload efficiently because the constant number of scans must be determined at the most severe DCT block in regard to the total length of enhancement codes in that block. Moreover, the permissible number of scans can vary among images, and this number needs to be transmitted to the decoder by a certain way. If the number of higher DCT coefficients embedded into lower DCT ones can change adaptively for every DCT block to make full use of the payload without needing side information to the decoder, it will be expected that the quality
of reconstructed high-resolution images improves, and also that the additional side information needs not to be transmitted from encoder to decoder.
The proposed adaptive steganographic encoder controls the amount of run-length Huffman codes created from higher DCT coefficients in such a way that the total length of enhancement codes becomes smaller than the payload while conforming to JPEG specification. In Section 2, we outline the basic system configurations to realize the steganographic encoder and decoder described above. Adaptive method to terminate the enhancement codes is described in Section 3. For embedding the enhancement codes into LSBs (least significant bits) of lower DCT coefficients, embedding order that is expected to reduce visual distortion of the reconstructed image is explained in Section 4. The performance evaluation on 4K standard test images is demonstrated in Section 5, and conclusions are given in Section 6.
2. SYSTEM CONFIGURATION
Figure 1 shows the basic configurations of steganographic encoder and decoder that adaptively determines run-length Huffman codes from higher DCT coefficients according to the payload constraint of lower DCT coefficients while conforming to JPEG specification. The steganographic encoder embeds the enhancement codes into LSBs of 8×8 lower frequency quantized DCT coefficients, and the steganographic decoder extracts the codes from LSBs of the lower DCT coefficients to reconstruct high-resolution images. Standard JPEG decoder also can recover output images in spite of half the resolution of those from the steganographic decoder. Therefore, this steganographic image compression method has backward compatibility with JPEG. The building blocks, numbered (1) to (5), in this figure perform the following tasks.
(1) Compute 16×16 DCT coefficients of high-resolution original input image.
(2) Quantize 8×8 lower DCT coefficients with a quality factor QF1, and then compute payload PL from the quantized DCT coefficients. (3) Quantize 16×16 higher DCT coefficients with
a quality factor QF2.
(4) Extract 16×16 higher DCT coefficients according to the maximum number of scans SC, and adaptively create enhancement codes based on the payload PL from part (2).
(5) Embed the enhancement codes into 8×8 lower DCT coefficients, and encode the DCT coefficients according to JPEG entropy coding. In this image compression algorithm, there are three parameters that mainly control the quality of decoded images: quality factors QF1 and QF2 for quantizing lower and higher DCT coefficients, respectively, and the number of scans SC for higher DCT coefficients using L-shaped scan (as shown in figure 2). If the initial step size of the quantizer for DCT coefficients is Bi, actual step
size of the quantizer, Ai, is determined by the
quality factor QF (QF1 or QF2), and it is given by
where
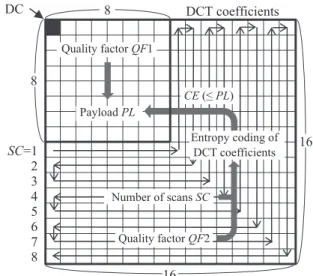
A larger QF creates smaller step size, so this leads to smaller quantization distortion. Hence, the payload PL is determined by the quality factor QF1 of lower DCT coefficients, and PL increases for larger QF1. Figure 2 schematically shows how the determination and embedding of enhancement codes relate to these three parameters that play an important role in controlling image quality. Here, the DC component in lower DCT coefficients is
Fig. 2 Enhancement code creation and LSB embedding. Fig. 1 Steganographic image encoder/decoder configurations with adaptive determination of enhancement codes.
disregarded form the payload computation because the bit-embedding into DC component yields significantly large image quality degradation.
In implementing this processing, there are several key points that must be taken into consideration. These points relate the fact that the JPEG codestream has two special run-length Huffman codes: one is 4-bit EOB (end of block) code that indicates the end of entropy codes for a DCT block, and another is 11-bit ZRL (zero run-length) code that indicates 16 consecutive zeroes. Firstly, there is a special case that EOB code is regarded to exist implicitly by comparing the amount of enhancement codes and the payload, even though EOB code is not actually embedded. Secondly, it is necessary to truncate run-length Huffman codes when the total length of the codes is greater than the payload. The enhancement codes after truncation must conform to the rule defined by the run-length Huffman coding of JPEG as if this encoding process is terminated before arriving at the payload limit. For example, an EOB code just after ZRL is not allowed by the rule of run-length Huffman coding.
Now we consider necessary conditions whether enhancement codes are embeddable or not for a given set of quantized DCT coefficients, enhancement codes, and the payload. The adaptive method to truncate the enhancement codes will be described in Section 3. The conditions that allow bypassing from enhancement code determination to LSB embedding in the steganographic encoder fall into following three categories [4].
Condition 1: Only DC coefficient exists in lower frequency quantized DCT coefficients, and the length of enhancement codes equals to 4.
Condition 2: Only DC coefficient exists in lower frequency quantized DCT coefficients, and the length of enhancement codes is greater than 4. Condition 3: Non-zero AC coefficients exist in lower frequency quantized DCT coefficients, and the payload is less than 4.
T h e a d a p t i v e m e t h o d t o d e t e r m i n e enhancement codes in the steganographic encoder truncates the codes while the length of enhancement codes is greater than the payload. As
the payload must be greater than or equals to 4 in order to embed the enhancement codes, just only EOB code is also permitted. On the other hand, the steganographic decoder can recognize whether DCT coefficients contain only DC component or not when the payload is computed, and if nothing but DC component exists in the lower frequency quantized DCT coefficients, condition 2 is regarded as condition 1 because it is impossible for the decoder to discriminate between them in this configuration. Therefore, when conditions 1 or 3 are satisfied, the steganographic decoder does not proceed to extract enhancement codes, and reconstructs higher DCT coefficients as if there exists EOB code alone. When both the conditions 1 and 3 are not satisfied, the steganographic decoder extracts enhancement codes and recovers higher DCT coefficients. As explained before, the extracted enhancement codes can be just only EOB code. In such a case, recovered higher DCT coefficients are all zeroes.
Based on the above discussion, the conditions that enable embedding/extraction of enhancement code in encoder/decoder can be tabulated as Table 1 in terms of the lower frequency quantized DCT coefficients and the payload.
3. ADAPTIVE CODE DETERMINATION Adaptive determination of enhancement codes can be realized by shortening the length of codes below the payload of each DCT block. If non-zero AC coefficients exist in lower frequency quantized DCT coefficients, this adaptation starts with, in accordance with the results shown in table 1, categorizing two inevitable cases as follows, where CE is the length of enhancement codes, and PL is
the payload.
・ If PL < 4, encoder does not embed enhancement codes, and decoder reconstructs higher DCT coefficients as if there exists only EOB code. In this case, all the higher DCT coefficients are set
Table 1 Possible processing in encoder and decoder.
Exist only DC coefficient Condition 1 Exist non-zero
AC coefficients
PL < 4 Condition 3
to zeroes.
・ If PL ≥ 4, encoder truncates enhancement codes until the condition of PL ≥ CE is satisfied, and decoder reconstructs higher DCT coefficients according to normal decoding procedure. In this case, enhancement codes after truncation must conform to the rule of JPEG run-length Huffman coding.
The final run-length Huffman code in a block must not be EOB if and only if the last DCT coefficient in the scan order is not zero. Moreover, the enhancement codes after truncation must be terminated using EOB whatever the last code before truncation is, because they are decoded thereafter by JPEG run-length Huffman decoding. Furthermore, the final truncated enhancement code cannot be either ZRL or a code corresponding to a pair of non-zero AC coefficient and zero run-length because the decoder fails to recover the correct number of higher DCT coefficients. Incidentally, when low frequency quantized DCT coefficients contain just only DC component (condition 1), decoding process is completely the same as the process in which non-zero AC coefficients exist and relation of PS < 4 is satisfied (condition 3).
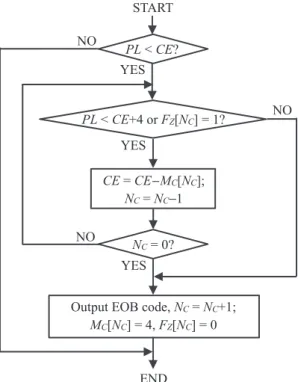
Figure 3 shows a flowchart of the adaptive algorithm for truncating enhancement codes in the
steganographic encoder, where NC is the number of run-length Huffman codes, MC [i] is the length of i-th code, and FZ[i] is a flag for discriminating
whether i-th code is ZRL. If i-th code is ZRL, then FZ[i] = 1, and otherwise FZ[i] = 0. The length of
enhancement codes, CE, is given by
If PL < CE, and further if PL < CE+4 or FZ[NC]
= 1, the last enhancement code with MC[NC] bits
already created at this point is discarded because there is no room for concatenating an EOB code at the end. The resulting valid length and number, CE and NC, of enhancement codes are replaced by
CE-MC[NC] and NC-1, respectively. Then, if NC = 0,
the enhancement code is only EOB because all the codes are exhausted by discarding. It is possible to add EOB code alone, since this truncation process is originally introduced in case of PL ≥ 4. If NC > 0,
the process returns to the start point for judging whether EOB code can be concatenated.
This process repeats while EOB code cannot be concatenated due to the relations among the payload, the length of enhancement codes, and the flag of ZRL code discrimination. If PL ≥ CE +4 and FZ[NC] = 0, the enhancement codes
can be terminated by concatenating an EOB as a final code, and at the same time, the number of enhancement codes, NC, is incremented by 1, then
the length of enhancement codes and the flag of ZRL code discrimination become MC[NC] = 4, FZ[NC]
= 0, respectively, in order to reflect the EOB code concatenation.
4. EMBEDDING ORDER FOR CODE BITS The perceptibility of changes in individual DCT coefficients was studied by Watson [5], and the result has been applied to digital watermarking or steganography in order to reduce the visual distortion by bit-embedding to DCT coefficients. This model controls the visual distortion due to bit-embedding into LSBs of 8×8 DCT coefficients based on a baseline frequency sensitivity threshold tb(i, j) (0 ≤ i, j ≤ 7) derived from contrast sensitivity
as well as luminance masking and contrast masking [6].
Although the baseline contrast sensitivity provides an estimate for the threshold based on HVS (human visual system), it needs to combine several distortion measures into a single perceptual distance using DC component of individual DCT blocks. Embedding enhancement codes, however, is a closed processing in one DCT block, and it is independent of DC components in other DCT blocks. Hence, if the baseline frequency sensitivity threshold tb(i, j) is modified by considering DC
component, the order among magnitudes of the threshold at position (i, j) does not change. This means that the use of baseline frequency sensitivity threshold is sufficient to determine the embedding order as far as magnitude order of the threshold is retained.
Therefore, we will consider a simple method for determining bit-embedding order on the premise that JNDs (just noticeable differences) for the distortion by bit-embedding are basically determined by tb(i, j). In order to discuss more
precisely, the individual DC components should be taken into account to derive the perceptual distance as described above, but the main problem here is to clarify the bit-embedding order rather than the allowable number of least significant bits for embedding. The latter problem will be out of scope in this paper.
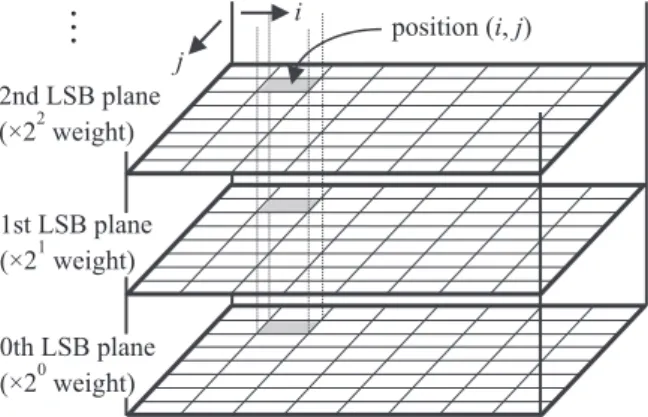
The distortion of DCT coefficients after dequantization in the decoder can be evaluated by the coefficient times quantizer step size Δ(i, j). Figure 4 shows a decomposition of 8×8 quantized DCT coefficients into bit planes (only 0th to 2nd LSB planes are shown). The distortion of quantized DCT coefficients by embedding one bit on n-th
LSB plane is at most ±2n. The distortion added
to reconstructed DCT coefficients is obtained by summing the distortion on LSB planes multiplied by the quantizer step sizes. When this distortion is added to output images, the effect is proportional to the power (squared value) of the distortion from the view point of SNR, but it is not obvious whether the relation holds from the view point of HVS.
We assume that the perceptibility of distortion is proportional to its magnitude raised to the p-th power, where p is some positive constant. If p is 1, then the perceptibility is proportional to the amplitude, and if p is 2, then to the square amplitude. Let dn(i, j) be the perceptibility of
distortion after dequantization at the position (i, j) on n-th LSB plane, and Δ(i, j) be the default quantization step size of JPEG. Then, dn(i, j) is
represented as Δ(i, j)·2n raised to the p-th power.
As a result, visual distortion, vdn(i, j), measured
with JND can be represented after dividing the perceptibility of bit-embedding distortion by the frequency sensitivity threshold:
Hence, if we embed all the enhancement codes in ascending order of vdn(i, j) one by one (i.e., in
ascending order of visual impacts measured by JND), the reconstructed output image is expected to have smaller visual distortion for an appropriate p value.
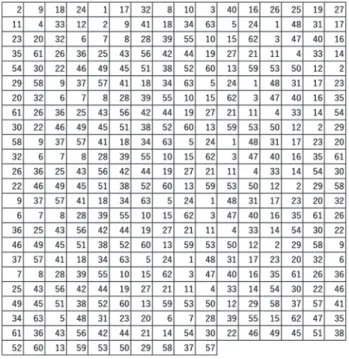
Table 2 shows, substituting default quantization step size for luminance components of JPEG to equation (4), the embedding order of enhancement code bits on 0th to 2nd LSB planes for p = 1 and 2, where 0 is the first and 188 is the last. The DC component at position (0, 0) is excluded from bit-embedding because it leads to large degradation of reconstructed images. It is obvious that the bit-embedding to lower DCT coefficients in 0th LSB plane tends to have higher priority than that to higher DCT coefficients in the same LSB plane in case of p = 2, since visual distortion exponentially increases as the frequency of DCT coefficients and the plane number of LSBs (but this embedding order is different from zigzag scan order).
At position (i, j) of the LSB planes, lower plane is selected prior to higher plane because the perceptual distortion due to bit- embedding, dn
(i, j), always satisfies the relation dn(i, j) < dm(i, j)
for n < m (i.e., the embedding order in lower LSB plane is earlier than that in higher LSB plane at the same position (i, j)). Hence, when we create a table of bit-embedding order, it is not necessary to indicate explicitly which LSB plane the embedding order corresponds to. More specifically, although numbers from 0 to 63 appears several times (the number of LSB planes), firstly appeared number corresponds to the bit on 0th LSB plane, and when the same number appeared again, it corresponds to the bit on 1st LSB plane, and so on. There is no ambiguity in the embedding order sequence.
The LSB planes of quantized DCT coefficients with 10-bit precision consist of 0th to 9th planes, and the number of embeddable bits to each DCT coefficients is determined by the amplitude of the coefficient. In this case, the maximum theoretically embeddable number of bits is nine, but here it is restricted to six considering the image quality degradation.
When the enhancement codes are embedded up to six LSB planes, we must determine the
bit-embedding order for least significant bits from 0th to 5th planes. Then, the total number of candidate bits for embedding enhancement codes is 63× 6 = 378 except for DC component, so we create an array of embedding order consisting of 378 elements. If the position (i, j) on an LSB plane corresponds to a value of i+8j, elements of the array are represented with numbers 1 through 63, where each number appears just six times. For example, Table 3 shows the array for bit-embedding order from 0th to 5th LSB planes with p = 2. In this array, the first and second numbers are ‘2’ and ‘9’, so these numbers correspond to positions (i, j) = (2, 0) and (1, 1), respectively. On the other hand, in table 2 for p = 2, the numbers ‘0’ at position (2, 0) and ‘1’ at position (1, 1) on 0th LSB plane indicate the first and second bits for embedding enhancement codes, respectively, so that there is no contradiction between the numbers of tables 2 and 3in their meanings.
5. PERFORMANCE EVALUATION 5.1 SCANNING METHODS
The conventional steganographic encoder utilizes the constant number of scans for higher DCT coefficients in all the blocks when enhancement codes are created by run-length Huffman encoding, although the proposed steganographic encoder
adaptively changes the number of scans (more precisely, the length of enhancement codes) based on the payload of each DCT block. Moreover, the proposed method employs, for embedding enhancement codes into low frequency quantized DCT coefficients, HVS-based order rather than zigzag scan order to reduce the visual distortion due to bit-embedding. In order to evaluate the performance of the proposed method on 4K standard test images [7], we prepared 4K images obtained from a color gamut conversion from Rec.2020 to Rec.709 followed by bit reduction from 12 to 8 bits. Although the evaluation was carried out against four images of u01_Books, u02_ MusicBox, u03_Moss, and u04_Kimono in the test
sets, the quantitative results for only u01 and u04 images are shown here, and for the rest of the images, u02 and u03, we make some comments if necessary.
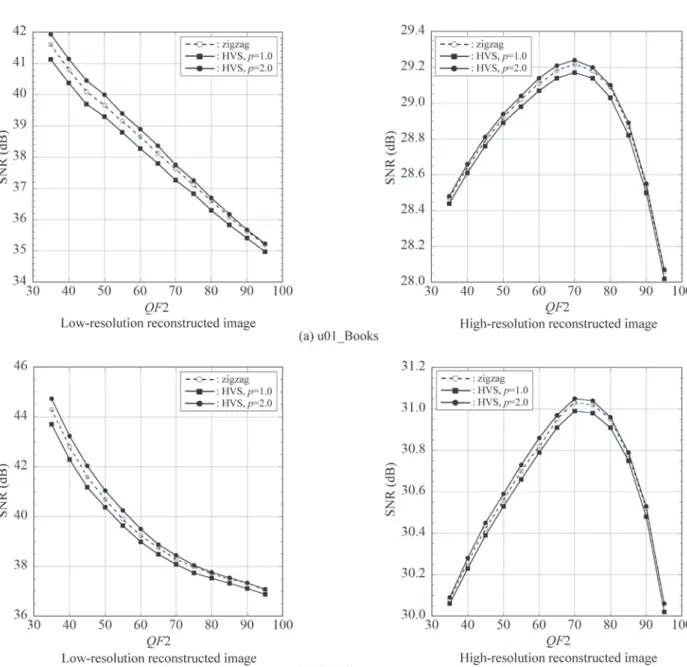
Figure 5 shows SNRs of low- and high-resolution reconstructed images obtained from the steganographic decoder using conventional zigzag scan order and the proposed HVS-based order for bit-embedding. The color decimation format is 4:4:4, and the quality factor QF1 for quantizing lower DCT coefficients is fixed to 95. These results show that the SNRs are higher in the following order for both low-resolution JPEG decoded images and high-resolution enhanced images: HVS-based (p=1.0) < zigzag < HVS-based (p=2.0). In this figure, SNRs of low-resolution JPEG decoded images monotonically
decrease with QF 2 because the amount of enhancement codes increases in lower DCT coefficients and greater amount of codes leads to larger distortion. As for high-resolution enhanced images, SNRs increase with QF2 in smaller QF2 region because the quality of decoded images is determined mainly by the reproducibility of higher DCT coefficients rather than the additional noise in lower DCT coefficients. On the other hand, SNRs decrease with QF2 in larger QF2 region because the distortion due to LSB embedding becomes dominant compared with the quality improvement by high frequency augmentation. As a result, SNR curves of high-resolution enhanced images have convex shapes, and there is an optimum QF2 that makes SNR maximum for a given QF1. In the case of these two images with QF1 of 95, the optimum QF2 is about 70. Incidentally, the optimum QF2 is also about 70 for image u02, while it is about 80 for image u03.
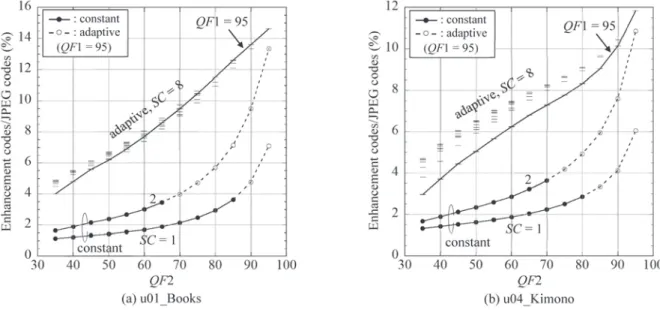
5.2 AMOUNT OF ENHANCEMENT CODES Figure 6 shows the ratio between the amount of enhancement codes and that of JPEG codes with QF1 = 95. In the conventional method with constant number of scans, there always exist inconvenient cases where enhancement codes cannot be embedded by the payload constraint, and the codes can only be embedded for solid lines indicated with ‘constant’ for the combination of
the number of scans SC and the quality factor QF2 used in higher DCT coefficient processing. It is possible for the steganographic encoder to embed more enhancement codes when the adaptive determination method for the codes is incorporated, and the same ratio in this case is shown in the figure by extending the solid lines with broken lines. These results are obtained using the same zigzag scan for bit-embedding as the conventional method. Of course, the conventional method cannot attain the amount of enhancement codes shown with these broken lines.
If the number of scans is increased under the condition of constant method, the steganographic encoder fails to embed enhancement codes when the quality factor QF2 is relatively large. Moreover, if the quality factor QF1 is smaller than 95, the embeddable condition becomes more severe because of payload reduction (not shown here). On the other hand, the symbols ‘-’ in the figure show the ratios for adaptive determination method with QF1 = 50, 55, 60, ..., 95, and of these, only the ratios for QF1 of 95 are connected with a solid line. It is obvious that the adaptive determination method enables to embed much more enhancement codes than the conventional constant method for these images. For mage u03, lower frequency is dominant, and there exists a combination of parameters that can embed the enhancement codes up to 5 scans even for the constant method.
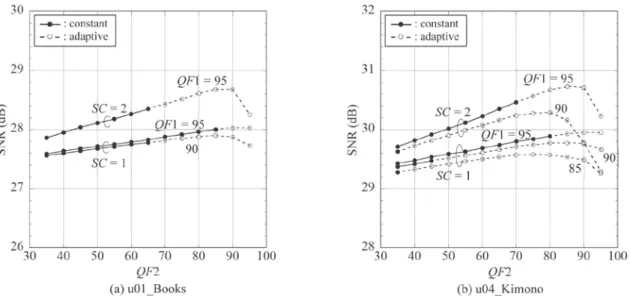
5.3 SNR FOR CONSTANT SCANNING
Figure 7 shows SNRs for high-resolution reconstructed images in the steganographic decoder with constant number of scans by solid lines. SNRs with adaptive number of scans are also shown in the figure by extending the solid lines with broken lines in a similar fashion as figure 6. Although SNR increases as the number of scans SC and the quality factor QF1 increase in almost all cases, the conventional steganographic encoder with constant scanning fails to embed enhancement codes before arriving at the maximum SNR because of the payload constraint. For image u03, however, there is a combination of parameters where the maximum SNR attainable for the conventional constant method is slightly
higher than that for the adaptive scanning method. 5.4 SNR FOR ADAPTIVE SCANNING
Figure 8 shows SNRs for high-resolution reconstructed images with adaptive scanning using QF1 = 50, 55, 60, ..., 95, where the maximum number of scans is set to eight. This means that at most 8 scans are possible according to the payload, and in fact, the number of scans is not always eight mainly because of the payload constraint. (It is possible that the higher frequency quantized DCT coefficients are almost zeroes for relatively flat image regions.)
In general, SNR curves have convex shapes when the low frequency quality factor, QF1, is greater than 80 or 85, and there exists the high
Fig. 7 SNR of high-resolution reconstructed image with constant number of scans.
frequency quality factor, QF 2, that maximizes SNR. These curves are monotonically decreasing with QF 2 when QF 1 is smaller than about 75. These results for QF1 of 95 are already shown in figure 5. For images other than u03, maximum SNRs in figure 8 are higher than that in figure 7 for all parameter combinations. That is, the adaptive scanning can provide higher SNR than the constant scanning. For image u03, however, SNR for the constant scanning with SC =2 is slightly higher than that for the adaptive scanning with setting maximum SC to eight.
5.5 DISTRIBUTION OF ENHANCEMENT CODES Table 4 shows parameter combinations that make the amount of enhancement codes maximum for constant scanning, as well as its maximum value. For making a comparison, this table also includes results for adaptive scanning in the same parameter conditions. The enhancement code bits per block in parenthesis for adaptive scanning are these values before code truncation. Note that the total length of codes is shown in bytes by summing up for 32,400 (i.e., 3840/16 (in horizontal)×2160/16
(in vertical)) DCT blocks. The number of scans that makes SNR maximum for constant scanning is 1 for image u01 and 2 for image u04, and it is impossible to embed any more enhancement codes for these images. The amount of embeddable enhancement codes with adaptive scanning becomes two to three times that with constant scanning, and the adaptive steganographic encoder never fails to embed these codes.
Figure 9 shows the enhancement code bits per DCT block for both constant and adaptive scanning methods as images in monochrome tone,
Fig. 9 Enhancement code bits per DCT block (value of 255 is most highlighted).
Table 4 Amount of enhancement codes at maximum SC. Code bits per block in parenthesis for adaptive scanning are values before truncating these codes.
4K image u01_Books u04_Kimono (QF1, QF2) (95, 85) (95, 70) Constant SC 1 2 Code bits per block Mean Max Min 17.6 73 4 13.8 116 4 Total code bytes 71,232 55,699
Adaptive SC 8 Code bits per block Mean Max Min 61.1 (142.6) 218 (687) 4 (4) 27.5 (43.2) 226 (462) 4 (4) Total code bytes 247,559 111,335
where the value of 255 is most highlighted. This figure clearly indicates that more enhancement codes, which are impossible to be embedded by the constant scanning, become embeddable by the adaptive scanning. Results for images u02 and u03 are analogous to this figure.
5.6 DECODED IMAGES
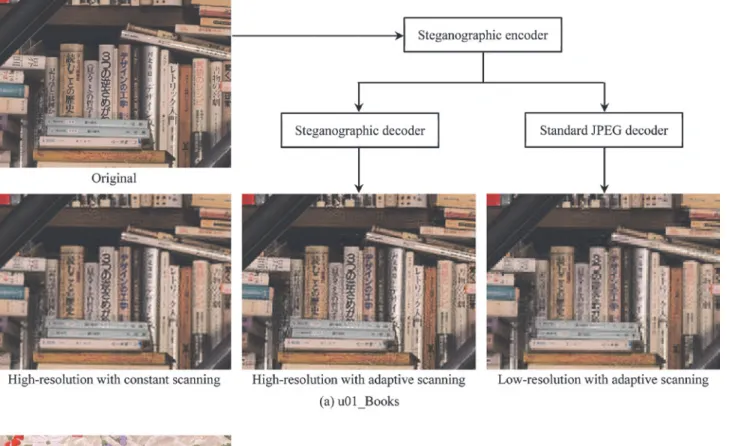
Now we compare the actually decoded images by using both steganographic decoder and JPEG decoder. The steganographic encoder determines enhancement codes by either constant or adaptive scanning methods. These examples are images only obtained using a parameter combination that makes SNR for each scanning method maximum. Here, a small region with 240×180 pixels is clipped from a whole decoded image as a representative, and such regions of images are compared side by side, since the images with entire size are difficult to recognize how much they are distorted. The upper left coordinates of these clipped regions are (1500, 1000) for image u01 and (1650, 1050) for image u04, respectively.
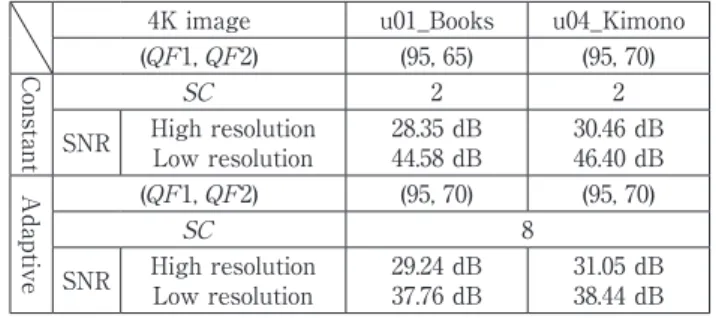
Table 5 shows parameter sets that make SNRs maximum for both constant and adaptive scanning methods, SNRs for high-resolution images from the steganographic decoder, and SNRs for low-resolution images from JPEG decoder. In computing SNRs of low-resolution images, reconstructed images using 8×8 inverse DCT of 8 ×8 DCT coefficients from original high-resolution images are used as reference images.
Figure 10 shows original and decoded images (clipped) together with a simplified encoder/ decoder configuration found in figure 1. Here, the enhancement codes are determined by the proposed adaptive scanning, and then embedded
according to the HVS-based order. High-resolution decoded images obtained from the conventional method with constant scanning are also shown as a reference.
In the following, we make some comments for individual 4K images. The image u01 contains many characters on the spine of books, so high frequency components from these edges yield large distortion. Readability of the characters is higher in the image obtained from the adaptive scanning than that from constant scanning because much of high frequency components are preserved in the former image.
The image u02 is a combination of small regions that contains more high frequency and less high frequency components. Although the adaptive scanning is superior to the constant scanning for most areas in the image, relatively flat regions such as the face of doll contain large low frequency distortion caused by embedding the enhancement codes into lower DCT coefficients. In such cases, the maximum number of scans for higher DCT coefficients or the payload should be restricted appropriately.
The image u03 has smallest high frequency components among the images tested here, so it has large payload for lower DCT coefficients. This image has slightly higher SNR when constant scanning rather than adaptive scanning is employed, but on the contrary, it seems that the visual quality of adaptive scanning is slightly improved compared to that of constant scanning. In this case, the SNR measurement may not be appropriate to evaluate image quality.
T h e i m a g e u 0 4 h a s h i g h e r f r e q u e n c y components in the texture of cloth than the background, and it can be observed that the visual resolution for adaptive scanning is higher than that for the constant scanning. The low frequency distortion found in the case of image u03 is scarcely perceptible in image u04. It is most obvious that the high-resolution images obtained from the steganographic decoder can attain higher visual resolution than low-resolution images from JPEG decoder for all the images tested here.
Table 5 Parameter sets at maximum SNR.
4K image u01_Books u04_Kimono (QF1, QF2) (95, 65) (95, 70)
Constant
SC 2 2
SNR High resolutionLow resolution 28.35 dB44.58 dB 30.46 dB46.40 dB
Adaptive (QF1, QF2) (95, 70) (95, 70)
SC 8
Fig. 10 Comparison of original image, high-resolution images reconstructed with constant and adaptive scanning methods, and
6. CONCLUTION
In JPEG-based image enhancement coding with steganographic data embedding, we proposed adaptive method that can make the amount of enhancement codes maximum based on the payload of low frequency quantized DCT coefficients. We also proposed HVS-based order for embedding enhancement codes into LSBs of lower DCT coefficients. The performance of the adaptive steganographic image compression method was evaluated using four 4K standard test images obtained from transforming Rec.2020 color gamut to Rec.709 together with truncating 12 to 8 bits. Note that these four test images do not correspond to wide color gamut images by nature. For every image, the enhancement codes become embeddable for all the combination of quality factors of low and high frequency quantizers by adaptive termination of enhancement codes, and the proposed adaptive method can obtain perceptually higher resolution images when compared to the conventional constant method.
Although the output codestream from the steganographic encoder can be decoded using standard JPEG decoder, its visual resolution is obviously inferior compared to high-resolution images decoded using the steganographic decoder. Therefore, the enhancement codes embedded in lower DCT coefficients can be regarded as secret information that enhance the value of an image on the premise that the high-resolution image is more valuable than the same image with low resolution. For example, a secret embedding order for the enhancement codes is considered as a simple hiding technique in spite of a little sacrifice in image quality.
The performance evaluations, however, show that relatively flat regions have much low frequency distortions created by embedding enhancement codes of the same block, because the allowable number of scans for high frequency quantized DCT coefficients are always set to maximum value of 8 in the evaluations. In order to reduce the effect, the number of scans for higher DCT coefficients or the payload for lower DCT coefficients should be restricted by some constraints using texture information such as the magnitude of DC component. The allowable
number of scans need not to be a common value in a whole image: the amount of embeddable codes to lower DCT coefficients is determined by the payload together with the amount of enhancement codes, and also a set of the enhancement codes must be terminated with an EOB after truncation so as not to exceed the payload of individual blocks. Hence, the allowable number of scans in a block is a parameter specific to that block, and it need not to be transmitted to the steganographic decoder.
Our future topic is to clarify the relation between image contents and the allowable number of scans for enhancement codes in the steganographic encoder.
REFERENCES
[1] T. Tokuma, S. Hara, A. Hanada, and K. Takizawa, “Development of the 4K8K test broadcast system,” Journal of ITE, Vol. 73, No. 3, pp. 587-594, 2019.
[2] J. M. Boyce, Y. Ye, J. Chen, and A. K. Ramasubramonian, “Overview of SHVC: Scalable extensions of the high efficiency video coding standard,” IEEE Trans. on Circuits and Systems for Video Technology, Vol. 26, Issue 1, pp. 20-34, Jan. 2016.
[3] I. Furukawa and J. Suzuki, “A novel approach of image enhancement using steganographic data embedding and JPEG scheme,” Bull. Hiroshima Inst. Tech. Research, Vol. 48, pp. 93-103, 2014.
[4] I. Furukawa and J. Suzuki, “JPEG-based image enhancement method with steganographic data embedding and its performance evaluation,” Bull. Hiroshima Inst. Tech. Research, Vol. 49, pp. 97-108, 2015.
[5] A. B. Watson, “DCT quantization matrices optimized for individual images,” Human Vision, Visual Processing, and Digital Display IV, SPIE-1913, pp. 202-216, 1993.
[6] A. J. Ahumada and H. A. Peterson, “Luminance- model-based DCT quantization for color image compression,” Proceedings of the SPIE, 1666, pp. 365-374, 1992.
[7] I. Matsuda, K. Masaoka, and H. Ikegawa, “Ultra-high definition/wide-color-gamut standard test images,” Journal of ITE, Vol. 68, No. 8, pp. 643-647, 2014.