Carbohydrate control of nitrogen dynamics in decomposing leaf litter of temperate tree species
著者(英) Balram K. Bhatta, Takashi Osono, Hiroshi Takeda
journal or
publication title
The Harris science review of Doshisha University
volume 58
number 3
page range 118‑125
year 2017‑10‑31
権利(英) Harris Science Research Institute of Doshisha University
URL http://doi.org/10.14988/pa.2017.0000016819
*Division of Environmental Science and Technology, Graduate School of Agriculture, Kyoto University, Kyoto, 606-8502, Japan
** Department of Environmental Systems Science, Faculty of Science and Engineering, Doshisha University, Kyoto, 610-0394, Japan
Telephone:+81-774-65-6688, E-mail:[email protected]
Carbohydrate Control of Nitrogen Dynamics in Decomposing Leaf Litter of Temperate Tree Species
Balram K. BHATTA*, Takashi OSONO** and Hiroshi TAKEDA**
(Received June 5, 2017)
Nitrogen (N) dynamics in decomposing leaf litter were elucidated for nine tree species over an 18-month period in a cool temperate forest and the effect of carbohydrate content on the N dynamics was evaluated. The pattern of changes in N was quantified in terms of the relative change of N content with respect to the accumulated mass loss of litter (known as Nitrogen Content Increase Rate or NCIR). The remaining mass of leaf litter of the nine tree species declined exponentially during the decomposition, and 2.4%
to 40.7% of the original mass remained at the end of the 18-month period. Decomposition rate (as Olson’s k) ranged from 0.74 to 2.45 year-1. The remaining mass of N in leaf litter generally decreased with the decomposition, whereas the relative N content of leaf litter generally increased linearly with the accumulated mass loss of litter (i.e., NCIR values were positive). The NCIR of leaf litter was significantly and positively correlated with initial total carbohydrate content of litter, suggesting that carbohydrates served as a major energy source for decomposer fungi to retain N in decomposing litter.
Key words:decomposition, forest, leaves, lignin, nitrogen
1.Introduction
Decomposition of leaf litter and the accompanying accumulation and release of essential nutrients is an important aspect of ecosystem function in forest soils1,2). Nitrogen (N) is a major macro-nutrient potentially limiting the primary productivity of forests and litter decomposition3). The dynamics of N in decomposing litter in temperate forests are often characterized by an initial phase of leaching, followed by accumulation (net immobilization) and later by a release (net mobilization) phase4,5).
Some studies have examined the relationship between the accumulation and release of N and the decomposition of recalcitrant compounds, such as lignin.
For example, Aber and Mellilo6) reported that the amount of N immobilized in litter was positively correlated to initial lignin content. Berg and McClaugherty7) found that N mobilization began when the amount of lignin started to decrease. Similarly, Osono and Takeda5) reviewed previous literature and proposed lignin to N ratio as an indicator of N dynamics for predicting the onset of net N release from decomposing litter.
In contrast, little is known about the role of polymer carbohydrates in N dynamics during leaf litter decomposition. Previous studies have noted that fungi play central roles in lignin decomposition8) and that fungal decomposition of lignin depends on the availability of carbon energy sources other than lignin,
Nitrogen Dynamics in Decomposing Litter
such as polymer carbohydrates9). It is thus hypothesized that availability of carbohydrates in litter can influence lignin decomposition and N dynamics. To the knowledge of the authors, however, there have been few studies that demonstrated carbohydrate control of N dynamics in decomposing litter.
The purposes of the present study were (i) to elucidate N dynamics during an 18-month decomposition of leaf litter for nine tree species in a cool temperate forest and (ii) to evaluate the effect of carbohydrate contents on the N dynamics. Patterns of changes in N were quantified in terms of the relative changes in N content during decomposition and the amount of N remaining at the end of the study period.
These relationships between parameters of N dynamics and the initial contents of total carbohydrates were examined to explore possible roles of carbohydrate components in N dynamics.
2. Materials and Methods
2.1 Study area
This study was carried out in a cool temperate deciduous forest dominated by Fagus crenata and Quercus crispula in the Ashiu Experimental Forest of Kyoto University (35°18'N, 135°43'E) in Kyoto, central Japan. The mean annual temperature is 11.7°C and the mean annual precipitation is 2353 mm at the office of Ashiu Experimental Forest, approximately 5 km from the study site. The study area was covered with snow during the winter period from December to April. A study plot of 20 m × 10 m area was laid out in the study area, and there was no replicate plot. The plot was divided into 10 subplots of 4 m × 5 m. Further details of climatic conditions, vegetation, and humus form of the study site were described previously10,11).
2.2 Litterbag experiment
A litterbag experiment was performed in the study plot using litter bags (15 cm × 15 cm) made of polypropylene shade cloth with a mesh size of
approximately 2 mm. Litter types used included nine tree species: Deutzia crenata, Swida controversa, Clerodendrum trichotomum, Mallotus japonicus, Symplocos chinensis, Pterostyrax hispida, Paulownia tomentosa, Hydrangea hirta, and Acanthopanax sciadophylloides (Table 1). Nomenclature follows Satake et al.12). Freshly fallen leaves were collected from the forest floor in the study area in November 2000 during the peak period of litterfall. The leaves were taken to the laboratory and oven-dried at 40°C to a constant mass. Two grams of the litter were enclosed in each litterbag, and a total of 630 bags were prepared (70 bags per tree species). Approximately 10 g of initial samples were preserved for chemical analyses.
The decomposition experiment covered an 18-month period from November 2000 to May 2002.
Litterbags were placed on the litter layer in November 2000 (63 bags per subplot). The bags were attached to the forest floor by metal pins to prevent movement and to ensure good contact between the bags and the litter layer. Sampling of the bags took place seven times, at 5 (April 2001), 7 (June 2001), 9 (August 2001), 11 (November 2001), 12 (December 2011), 17 (April 2002), and 18 months (May 2002) after the placement. On each sampling occasion, a maximum of 90 bags were retrieved from the 10 subplots (one bag per subplot and tree species), placed in vinyl bags, and taken to the laboratory. Data are missing for S. chinensis, P. hispida, and H. hirta at 11 months due to accidental loss of litterbags in the field.
Foreign plant remains attached to the outside of the bags were carefully removed with forceps. The dry mass was determined after drying the samples to a constant mass at 40°C and mean values of remaining mass were calculated for each sampling.
2.3 Chemical analyses
The samples from 10 subplots were then combined, ground in a laboratory mill to pass through a 0.5 mm screen, and used for chemical analyses. The amount of acid-unhydrolyzable residue (AUR) in the
119
Table 1. Initial content (mg g-1) of acid-unhydrolyzable residue (AUR), total carbohydrates (TCH), nitrogen (N), lignocellulose index (LCI), and AUR/N ratio of leaf litter of nine tree species.
Tree species AUR TCH N LCI AUR/N ratio
Deutzia crenata 354 230 23.8 0.39 14.9
Swida controversa 193 262 11.1 0.58 17.4
Clerodendrum trichotomum 296 292 24.7 0.50 12.0
Malotus japonicus 124 313 11.1 0.72 11.1
Symplocos chinensis 235 328 20.2 0.58 11.6
Pterostyrax hispida 137 349 21.9 0.72 6.2
Paulownia tomentosa 227 353 16.8 0.61 13.5
Hydrangea hirta 113 403 12.5 0.78 9.0
Acanthopanax sciadophylloides 259 415 10.4 0.62 24.9
Table 2. Decomposition rate (k, year-1) and its coefficients of determination, litter mass remaining at 18 months (LMR18, % of the original mass), nitrogen content increase rate (NCIR) and its coefficients of determination, and nitrogen mass remaining at 18 months (NMR18, % of the original mass) for leaf litter of nine tree species. Coefficients of determination (R2) are given in parentheses.
Tree species n k LMR18 NCIR NMR18
Deutzia crenata 8 1.19 (0.94) 16.9 -0.014 (0.04) 16.1
Swida controversa 8 1.93 (0.94) 3.3 0.088 (0.89) 5.7
Clerodendrum trichotomum 8 1.52 (0.99) 10.8 0.134 (0.86) 15.8
Malotus japonicus 8 2.45 (0.98) 3.1 0.135 (0.97) 6.6
Symplocos chinensis 7 1.55 (0.97) 2.4 0.099 (0.47) 3.4
Pterostyrax hispida 7 1.01 (0.95) 27.6 0.163 (0.65) 42.1
Paulownia tomentosa 8 0.74 (0.89) 40.7 0.181 (0.81) 68.2
Hydrangea hirta 7 1.22 (0.93) 23.5 0.185 (0.96) 47.2
Acanthopanax sciadophylloides 8 1.19 (0.97) 14.8 0.179 (0.94) 34.4
Nitrogen Dynamics in Decomposing Litter
samples was estimated by means of gravimetry as acid-insoluble residue, using hot sulfuric acid digestion13). Samples were extracted with alcohol-benzene at room temperature (15-20°C) to subtract extractives (soluble polyphenols, hydrocarbons, and pigments), and the residue was treated with 72%
sulfuric acid (v/v) for 2 h at room temperature with occasional stirring. The mixture was diluted with distilled water to make a 2.5% sulfuric acid solution and autoclaved at 120°C for 60 min. After cooling, the residue was filtered and washed with water through a porous crucible (G4), dried at 105°C and weighed as acid-insoluble residue. This AUR fraction contains a mixture of organic compounds in various proportions, including condensed tannins, phenolic and carboxylic compounds, alkyl compounds such as cutins, and true lignin14).
The filtrate (autoclaved sulfuric acid solution) was used for total carbohydrate (TCH) analysis. The TCH contents were measured by a phenol-sulfuric acid method15). One ml of 5% phenol (v/v) and five ml of 98% sulfuric acid (v/v) were added to the filtrate derived from the AUR analysis. The optical density of the solution was measured to determine TCH content using a spectrophotometer at 490 nm, using known concentrations of D-glucose as standards. Total N content was measured by automatic gas chromatography (NC analyzer SUMIGRAPH NC-900, Sumitomo Chemical Co., Osaka, Japan). The concentrations were expressed in mg g-1 dry litter.
2.4 Data analysis
Litter mass remaining at the end of the study period (i.e., 18 months) was denoted as LMR18 and expressed as the percentage of the original litter mass.
Decomposition rates of leaf litter over the 18-month period were calculated as Olson’s k according to the following equation16):
Wt = W0 × exp (-kt) (1)
where Wt is the litter mass after a given period, W0 is the original litter mass, t is time in years and k is the decomposition rate.
The lignocellulose index (LCI) and AUR to N (AUR/N) ratio are useful indices of litter chemical quality5) and were calculated according to the following equations:
LCI = TCH content / (AUR content + TCH content) (2) AUR/N ratio = AUR content / N content (3)
Linear relationships between the N content and the accumulated mass loss of litter were examined according to the following equation:
Content = a + b × (accumulated mass loss of litter) (4)
Intercepts (a) and slopes (b) of Eq. (4) were calculated for the linear relationships using least-square regression.
The slope (b) of Eq. (4) describing N dynamics is called the N concentration increase rate (NCIR)17). Nitrogen mass remaining at the end of the study period (i.e., 18 months) was denoted as NMR18 and expressed as the percentage of the original N mass.
Pearson’s correlation coefficient was calculated for the linear relationship between initial contents of chemical components and NCIR and NMR18 for leaf litter of the nine tree species.
3. Results and discussion
3.1 Initial chemical properties and decomposition rate Initial AUR content of leaf litter of the nine tree species examined ranged from 113 to 354 mg g-1, TCH content from 230 to 415 mg g-1, and N content from 10.4 to 24.7 mg g-1 (Table 1). Initial LCI of leaf litter ranged from 0.39 to 0.78 and AUR/N ratio ranged from 6.2 to 24.9 (Table 1). Initial LCI was significantly and 121
negatively correlated with AUR content (Pearson's R=-0.952, n=9, Probability<0.001) and significantly and positively with TCH content (Pearson's R=0.712, n=9, Probability <0.05).
The remaining mass of leaf litter of the nine tree species declined exponentially during the decomposition (Fig. 1), reaching 2.4% to 40.7% of the original mass at the end of the 18-month period (LMR18, Table 2). The decomposition rate (as Olson’s k) ranged from 0.74 to 2.45 year-1, with coefficients of determination between 0.89 and 0.99 (Table 1). Neither decomposition rate nor LMR18 was significantly correlated with the initial contents of AUR, TCH, or N, or with LCI, or AUR/N ratio (n=9, Probability>0.05).
The initial AUR content was generally lower and N content was generally higher for leaf litter used in the present study (Table 1) than for the leaf litter used in previous decomposition studies conducted at the same study site5). This can explain the generally faster decomposition rate of leaf litter in the present study (Table 2). In addition, a negative relationship between the decomposition rate of leaf litter and initial AUR content was found in several previous studies5,18,19), but this was not the case in the present study. The lower AUR content of leaf litter used in the present study again can account for the lack of such a relationship between decomposition rate and AUR content of leaf litter.
3.2. Nitrogen dynamics
Nitrogen content of leaf litter of eight tree species (all those examined except Deutzia crenata) increased linearly with the accumulated mass loss of litter (Fig. 2), with NCIR ranging from 0.088 to 0.185 and coefficients of determination between 0.47 and 0.97 (Table 2). In contrast, N content of D. crenata was variable over the study period (Fig. 2), and the coefficient of determination for NCIR was low (i.e., R2=0.04, Table 2).
Remaining mass of N in leaf litter of the nine tree species generally decreased with the decomposition,
Fig. 1. Changes in remaining mass of leaf litter during decomposition. Bars indicate standard errors.
Exponential function of Olson was fitted to the data to calculate the decay constant (k, year-1) for each tree species (Table 2). Upper panel: open boxes, Deutzia crenata; gray circles, Swida controversa; black triangles, Clerodendrum trichotomum. Middle panel: open boxes, Mallotus japonicus; gray circles, Symplocos chinensis;
black triangles, Pterostyrax hispida. Lower panel: open boxes, Paulownia tomentosa; gray circles, Hydrangea hirta; black triangles, Acanthopanax sciadophylloides.
0 50 100
0 50 100
Litter remaining mass (% original mass)
0 50 100
0 0.5 1 1.5
Time (years)
Nitrogen Dynamics in Decomposing Litter
Fig. 2. Changes in nitrogen content in leaf litter as a function of accumulated mass loss of litter. A linear function was fitted to the data to calculate nitrogen content increase rate (NCIR) for each tree species (Table 2). The symbols are the same as in Fig. 1.
Fig. 3. Changes in remaining mass of nitrogen in leaf litter during decomposition. The symbols are the same as in Fig. 1.
0 10 20 30 40
0 10 20 30 40
Nitrogen content (mg/g)
0 10 20 30 40
0 25 50 75 100
Accumulated mass loss of litter (%)
0 50 100
0 50 100
Nitrogen remaining mass (% original mass)
0 50 100
0 0.5 1 1.5
Time (years)
123
with temporary net increases for a few litter types during the initial six months (Fig. 3). Remaining mass of N reached 3.4% to 68.2% of the original mass at the end of the 18-month period (NMR18, Table 2). The NMR18 was significantly and positively correlated with LMR18 (Pearson's R =0.959, n=9, Probability<0.001).
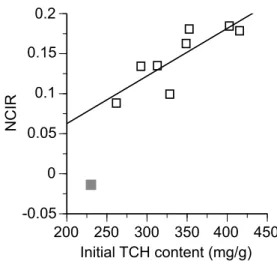
The NCIR was significantly and positively correlated with the initial TCH content for leaf litter of eight tree species (all the species other than D. crenata) (Pearson's R=0.831, n=8, Probability<0.01) (Fig. 4). The correlation between NCIR and TCH content was still significant when the datum of D. crenata (gray box in Fig. 4) was incorporated in the analysis (Pearson's R=0.866, n=9, Probability<0.01). The NMR18 was not significantly correlated with initial contents of AUR, TCH, or N, or with the initial LCI or AUR/N ratio (n=9, Probability >0.05).
The two-phase N dynamics of initial phase net immobilization followed by the phase of net release (Fig.
3) was consistent with previous studies of leaf litter decomposition5). The rapid release of N starting from the onset of decomposition (without net N immobilization) was due to the initially low AUR/N ratio of the litter5). The positive relationship between NCIR and initial TCH content contrasts with the previous finding reporting a positive relationship between NCIR and initial AUR content for needle litter of coniferous trees17). This discrepancy is possibly attributable to the use of low AUR litter of broad-leaved tree species in the present study. The 'total carbohydrate (TCH)' fraction consists mainly of polymer carbohydrates, such as cellulose and hemicellulose, with soluble carbohydrates in a minor proportion. The generally low AUR contents of the leaf litter indicate low degrees of lignification of polymer carbohydrate components in the cell wall9). This suggests that these non-lignified carbohydrates were relatively readily available to decomposer fungi and served as a major energy source for their hyphae to grow and retain N in in decomposing litter. This could result in a higher rate
Fig. 4. Nitrogen content increase rate (NCIR) as a function of initial content of total carbohydrates (TCH) for leaf litter of nine tree species. Gray box, Deutzia crenata that had low coefficient of determination for NCIR (Table 2); open box, the other eight litter types.
The regression line was for the eight litter types indicated as open boxes.
of relative N increase with respect to the unit mass loss (i.e., higher NCIR) in leaf litter with higher TCH content (Fig. 4). Further studies are needed to test the general validity of our finding and verify the role of carbohydrates in N dynamics of decomposing leaf litter.
We thank Dr. H. Barclay and Dr. E. Nakajima for critical reading of the manuscript, and the members of the Laboratory of Forest Ecology, Kyoto University and staffs of Ashiu Experimental Forest, Kyoto University for help in fieldwork and useful discussions. This study received partial financial support from the Ministry of Education, Culture, Sports, Science, and Technology of Japan (MEXT) (No. 15K07480).
References
1) M. J. Swift, O. W. Heal, and J. M. Anderson, Decomposition in Terrestrial Ecosystems, (Blackwell, Oxford, 1979), p. 372.
2) B. Berg, and C. McClaugherty, Plant Litter, -0.05
0 0.05 0.1 0.15 0.2
200 250 300 350 400 450
NCIR
Initial TCH content (mg/g)
Nitrogen Dynamics in Decomposing Litter
Decomposition, Humus Formation, Carbon Sequestration, (Springer, Berlin, 2003), p. 286.
3) B. Berg, "Nutrient Release from Litter and Humus in Coniferous Forest Soils – a Mini Review", Scand. J. For.
Res., 1, 359-369 (1986).
4) H. Staaf, and B. Berg, "Accumulation and Release of Plant Nutrients in Decomposing Scots Pine Needle Litter.
Long-term Decomposition in a Scots Pine Forest. II", Can.
J. Bot., 60, 1561-1568 (1982).
5) T. Osono, and H. Takeda, "Accumulation and Release of Nitrogen and Phosphorus in Relation to Lignin Decomposition in Leaf Litter of 14 Tree Species in a Cool Temperate Forest", Ecol. Res., 19, 593-602 (2004).
6) J. D. Aber, and J. M. Mellilo, "Nitrogen Immobilization in Secaying Hardwood Leaf Litter as a Function of Initial Nitrogen and Lignin Content", Can. J. Bot., 60, 2263-2269 (1982).
7) B. Berg, and C. A. McClaugherty, "Nitrogen and Phosphorus Release from Decomposing Litter in Relation to the Disappearance of Lignin", Can. J. Bot., 67, 1148-1156 (1989).
8) K. E. L. Eriksson, R. A. Blanchette, and P. Ander, Microbial and Enzymatic Degradation of Wood and Wood Components, (Springer, Berlin, 1990), p. 420.
9) T. Osono, and H. Takeda, "Effects of Organic Chemical Quality and Mineral Nitrogen Addition on Lignin and Holocellulose Decomposition of Beech Leaf Litter by Xylaria sp.", Eur. J. Soil Biol., 37, 17-23 (2001).
10) T. Osono, "Diversity, Resource Utilization, and Phenology of Fruiting Bodies of Litter-decomposing Macrofungi in Subtropical, Temperate, and Subalpine Forests", J. For. Res., 20, 60-68 (2015).
11) T. Osono, "Hyphal Length in the Forest Floor and Soil of Subtropical, Temperate, and Subalpine Forests", J. For.
Res., 20, 69-76 (2015).
12) Y. Satake, H. Hara, S. Watari, and T. Tominari, Wild Flowers of Japan. Woody Plants, (Heibonsha, Tokyo, 1989), p. 219. (in Japanese)
13) H. G. C. King, and G. W. Heath, "The Chemical Analysis of Small Samples of Leaf Material and the Relationship between the Disappearance and Composition of Leaves", Pedobiologia, 7, 192-197 (1967).
14) C. M. Preston, J. A. Trofymow, B. G. Sayer, and J. Niu
"13C Nuclear Magnetic Resonance Spectroscopy with Cross-polarization and Magic-angle Spinning Investigation of the Proximate-analysis Fractions Used to Assess Litter Quality in Decomposition Studies", Can. J.
Bot., 75, 1601-1613 (1997).
15) M. Dubois, K. A. Gilles, J. K. Hamilton, P. A. Rebers, and F. Smith, "Colorimetric Method for Determination of Sugars and Related Substrates", Anal. Chem., 28, 350-356 (1956).
16) J. S. Olson, "Energy Storage and the Balance of Producers and Decomposers in Biological Systems", Ecology, 44, 322-331 (1963).
17) B. Berg, C. McClaugherty, and M. B. Johansson, Chemical Changes in Decomposing Litter Can Be Systemized with Respect to the Initial Chemical Composition of the Litter, (Swedish University of Agriculture Sciences report 74, Uppsala, 1997), p. 103.
18) K. L. Murphy, J. M. Klopatek, and C. C. Klopatek, "The Effects of Litter Quality and Climate on Decomposition along an Elevational Gradient", Ecol. Appl., 8, 1061-1071 (1998).
19) L. M. Stump, and D. Binkley, "Relationships between Litter Quality and Nitrogen Availability in Rocky Mountain Forests", Can. J. For. Res., 23, 492-502 (1993).
125