The Emission of Electromagnetic Waves during The Coalescence of Two Parallel Current Loops in Solar Flares
Laboratory for Plasma Astrophysics, Faculty of Engineering Shinji Saito and Jun-ichi Sakai [email protected] We investigate the emission process of electromagnetic waves during the coalescence of two
parallel current loops with counter-helicity. It is shown that the jet-like electrons accelerated during the coalescence process excite the electron Bernstein waves due to the interaction be- tween the energetic electrons and the magnetic fields surrounding two current loops. In the interaction region there appears a thin density gap, from which region the electromagnetic waves propagate perpendicular to the magnetic field as extraordinary electromagnetic waves (X-mode). We found that the electron Bernstein waves in the high density plasma are con- verted to the X-mode in the low density plasma through the linear mode conversion process due to the density inhomogeneity.
Keywords : electromagnetic wave emission, solar flare
1 Introduction
Current loops interaction is one of the important concepts to understand the complicated solar flare events. The solar flares not only convert the mag- netic field energy to the particle kinetic or thermal energy, but also emit the several waves, such as the γ ray, the X ray, as well as the radio waves. F´arn´ık et al. (2003) observed the pulsations in radio waves during the onset phase of a burst emitted from the flare. They concluded that the process of current loops interaction is the most likely interpretation for the observed pulsations. Kundu et al. (2004) studied the source configuration of four simple short- duration 17 and 34 GHz bursts. They inferred that two bursts of them originate from the interaction of two sets of loops. From these observational results, we infer that the emission of electromagnetic waves in radio frequency could be related to the current loops interaction.
To understand the emission processes of the elec- tromagnetic waves during the impulsive phase of solar flares, we investigate the emission process of electromagnetic waves during two parallel current loops interaction by using a particle-in-cell code. We found from the simulation results that when two cur- rent loops with counter-helicity collide, the acceler- ated electrons are injected from the magnetic neutral sheet to the outer region. The accelerated electrons interact with the magnetic field surrounding the two current loops. Then, the electrostatic fields associ- ated with the electron Bernstein waves are generated near the interaction region, and simultaneously the electromagnetic waves are emitted from that region.
The generated electromagnetic waves propagate nor- mal to the magnetic field as the extraordinary mode (X-mode). The conversion process that we present here is the linear mode conversion process (Budden 1961, Stix 1992) in non-uniform plasmas.
The present paper is organized as follows. In §2 the simulation model and the parameters used in the simulations are presented. In §3 we show from the simulation results that the generation process of electromagnetic waves (X-mode) is due to the linear mode conversion from the electron Bernstein waves.
In §4 we summarize our results.
2 Simulation Model
We use 2D3V, the fully relativistic electromagnetic PIC code, modified from the 3D3V TRISTAN code (Buneman 1993). The system size is L
x= L
y= 900∆, where ∆(= 1) is a grid size. The free bound- ary conditions for both x- and y- directions are im- posed on particles and electromagnetic fields. Each current loop satisfies the force-free equilibrium con- dition. The magnetic field configuration produced by two current loops with counter-helicity in the whole system is given in the form,
B
θ= B
0r
1/a
1 + (r
1/a)
2+ B
0r
2/a
1 + (r
2/a)
2(1) B
z= B
01 + (r
1/a)
2− B
01 + (r
2/a)
2(2) where r
1and r
2are the distance from the each loop center, a is the loop radius, and B
0is the magnetic field strength in the loop center. The subscript ”1”
富山大学総合情報基盤センター広報 vol.2 (2005) 76-79頁.
- 76 -
and ”2” mean the first and second loop. The centers of each loop are located at (x
1, y
1) = (300∆, 300∆) and (x
2, y
2) = (600∆, 600∆). The radius, a, of both loops is 100∆. There are about 80 million uniformly distributed electron-ion pairs in the system, which satisfy ∇ · E = 0 in the initial condition. The av- erage number of electron-ion pairs in a cell is about 100. Ion temperature is equal to the electron tem- perature. Electrons are drifted as electric current of the loops. Other parameters are as follows: the time step ω
pet = 0.05, mass ratio m
i/m
e= 16.0, Debye length v
th,e/ω
pe= 1.0∆, and the collisionless skin depth c/ω
pe= 10.0∆. The physical quantities re- lated to the magnetic field B
0, such as the ratio of ω
ceto ω
pe, plasma beta β, electron Larmor radius ρ
e, and ion Larmor radius ρ
i, are ω
ce/ω
pe= 0.8, β = 0.015, ρ
e= 1.25∆, and ρ
i= 5.0∆, respectively.
3 Simulation Results
First of all we show the wave emission during the co- alescence process of two parallel current loops. Fig- ures 1(a) and (b) show the vector plot ( ˜ B
x,y) of the magnetic field normalized by B
0and the intensity ( ˜ E
z) of the electric field E
znormalized by cB
0with gray scale in the whole system at ω
pet = 250. Fig- ures 1(c.1) and 1(c.2) are the spacial distribution of E ˜
zwith gray scale at ω
pet = 250 and ω
pet = 260, which figures are expanded from the solid square re- gion in figure 1(b). Two current loops approach each other by an attraction of magnetic force and col- lide as seen in Fig.1(a). Then a thin reverse current sheet is produced between two current loops where the magnetic reconnection occurs. At this time, as seen in Fig.1(b), we observe the propagation of the E
zwaves emitted from the loops coalescence region.
As seen in Figs.1(c.1) and 1(c.2), both directions of the wave oscillation (E
z) and the wave vector are normal to the local magnetic field, and the waves propagate with light velocity. The characteristics of such waves clearly indicate the property of extraordi- nary mode (X-mode) of high frequency branch. The emission of the X-mode continues until the current sheet is broken at about ω
pet = 400. The X-mode source exists only at the lower right edge of the gen- erated reverse current sheet. In the next figures we show the reason why there appears such an asym- metry associated with the wave emission. Figures 2 shows the axial magnetic field ˜ B
z(gray scale) and the electron averaged velocity (vector) at ω
pet = 200.
The region shown here is zoomed in from the cen- tral part in the whole system. The axial magnetic field with positive polarity and that with negative polarity create electric current J
x,yalong the mag- netic neutral sheet between them. The electric cur-
= 1.0
X Y
200 400 600 800 800
600 400 200
200 400 600 800 (a) ω
pet = 250 (b)
-0.04 -0.02 0.00 0.02 0.04
B ˜
xyE ˜
z(c.1) (c.2)
650 750
250
150
650 750
ω
pet = 260 ω
pet = 250
X
X Y
-0.006 -0.003 0.000 0.003
X
E ˜
zFigure 1: (a): The vector plot of magnetic field B
x,ynormalized by B
0and (b): the electric field E
znormal- ized by cB
0in the whole system at ω
pet = 250. (c.1)- (c.2): the electric field E
znormalized by cB
0in the magnified region from solid square part in Fig.1(b) at ω
pet = 250 and ω
pet = 260.
rent J
x,ymainly is carrying the electrons as seen in Fig.2, because the ions heavier than electrons can- not respond to the rapid generation of the electric current in the neutral sheet. The electrons carrying J
x,yare accelerated due to the compression of the axial magnetic fields into lower right region. The ac- celerated electrons interact with the magnetic field surrounding the current loops and cause the elec- tromagnetic wave emission. Before we explain Fig-
-1.2 -0.6 0.0 0.6 1.2
B ˜
z350 400 450 500 550 550
500 450 400 350
X Y
Figure 2: The axial magnetic field ˜ B
z(gray scale) and the electron averaged velocity (vector) at ω
pet = 200.
ure 3, we define the line ’r’ which has a origin at (x, y) = (450∆, 450∆) and leans with an angle of
−π/4 [rad] to the x direction. The ’r’ line is parallel to the magnetic neutral sheet seen in Fig.2(a.2), and
富山大学総合情報基盤センター広報 vol.2 (2005) 76-79頁.- 77 -
the origin of ’r’ line is the center of the neutral sheet.
Figure 3 shows the one dimensional plots of the sev- eral physical quantities on the r line; (a.1)-(a.3) are the phase spaces of the electrons, (b.1)-(b.3) the magnetic field intensity | B ˜
x,y| = √
B ˜
x2+ ˜ B
y2, (c.1)- (c.3) the electric field intensity ˜ E
r, and (d.1)-(d.3) the electric field intensity ˜ E
z. Here, ˜ v
r,eis the r component of the electron velocity normalized by the light speed. These are plotted at ω
pet = 200, 225, and 250. The electrons are accelerated in the magnetic neutral sheet as seen in Fig.3(a.1). Around r = 140∆ the accelerated electrons interact with the magnetic field surrounding the two current loops, as seen in Fig.3(b.1). The magnetic field is normal to the velocity of accelerated electrons, so that the electrons are accumulated around r = 140∆, seen in Fig.3(a.1)-(a.3). The accumulated electrons com- press the magnetic field as seen in Fig.3(b.2) and 3(b.3). Therefore, there appears the density gap around r = 140∆. The velocity of electrons which interact with the magnetic field changes rapidly by the Larmor motion as seen in Fig.3(a.2), where the number of electrons with the negative velocity in- crease around the density gap region. At this time, ω
pet = 225, the electrostatic field E
rchanges around the density gap as seen in Fig.3(c.2). The line plot in the solid square in Fig.3(c.2) is expanded from the dashed square in the figure. At the same time, the electric fields E
zalso change near the same region, as seen in Fig.3(d.2). The line plot in solid square in Fig.3(d.2) is expanded from the dashed square in the figure. Near the density gap region, the wave length of the electric field E
zcorresponds to the wave length of the electrostatic field. After the change of both electrostatic and electromagnetic waves, the electromagnetic waves with the light velocity propa- gate toward the outer region. We can clearly see the waves in the solid square in Fig.3(d.3), which is ex- panded from the dashed square. The wave length is about λ ∼ 30∆ which corresponds to ck/ω
pe= 2.1, where ω
peis determined by the electron density in the initial condition. We estimated the frequency as ω/ω
pe= 2.3 from the dispersion relation of X- mode. We expect from these results that the gen- erated electrostatic field near the density gap seen in Fig.3(c.2) is deeply related to the emission of the electromagnetic waves as X-mode. The generated electrostatic field is normal to the magnetic field, so that we expect that the generated electrostatic waves are the electron Bernstein mode. Almost si- multaneously, the electromagnetic waves (X mode) are excited and propagate to the outer region. We expect that the generation mechanism of the elec- tromagnetic waves is due to the linear mode conver- sion from the Bernstein waves. The process of the
v ˜
r, e(b.3)
B ˜
xyωpet=
225
ωpet=
200
ωpet=250(a.1) (a.2) (a.3)
(b.1) 0.9
0.6 0.3 0.0
(b.2) -0.70
-0.35 0.00 0.35 0.70
(c.2)
-0.10 -0.05 0.00 0.05
-0.05 -0.03 -0.01 0.01
350 250 150
50 50 150 250 350
(d.2)
350 250 150 50
(c.1) (c.3)
(d.1) (d.3)
r
r r
E ˜
zE ˜
rFigure 3: The time development of several quantities of the one dimensional plot along the r direction. (a.1)- (a.3): the phase space plots of the electrons, where v
r,eis the electron velocity along the r direction normalized by the light velocity, (b.1)-(b.3): the intensity of the magnetic field B
x,ynormalized by B
0, (c.1)-(c.3): the electric field E
rnormalized by cB
0, and (d.1)-(d.3): the electric field E
znormalized by cB
0, at ω
pet = 200, ω
pet = 225, and ω
pet = 250.
linear mode conversion from the Bernstein mode to the X mode was proposed by Wu et al. (2000). They explained that the harmonics of electron Bernstein waves above the X-mode cutoff frequency are ex- cited by the energetic electrons propagating parallel to the magnetic field through the cyclotron wave- particle interaction. In our case, the energetic elec- trons interacts with the magnetic field normal to the velocity of the electrons, so that the generation pro- cess of the Bernstein waves presented in this paper is different from the former case. We pay atten- tion to the electron Bernstein waves with the fun- damental mode. The cutoff frequency of the funda- mental electron Bernstein mode is the upper hybrid frequency ω
UH= (ω
2pe+ ω
2ce)
1/2, so that the dis- persion relation of the fundamental Bernstein mode can never interact with that of the X-mode because the X-mode cutoff frequency is higher than the up- per hybrid frequency. This relationship is satisfied in the uniformly magnetized plasmas. However, in the present case, there is a thin density gap which is of the order of electron skin depth in the region where waves are excited. We can see the density gap in Fig.3(a.1)-(a.3), and estimate the ratio of density gap is about 7. We propose a scenario that the ac- celerated electrons excite the Bernstein waves in the
富山大学総合情報基盤センター広報 vol.2 (2005) 76-79頁.- 78 -
high density plasma through the interaction with the magnetic field, then the excited electron Bernstein mode interacts with the X-mode in the low density plasma.
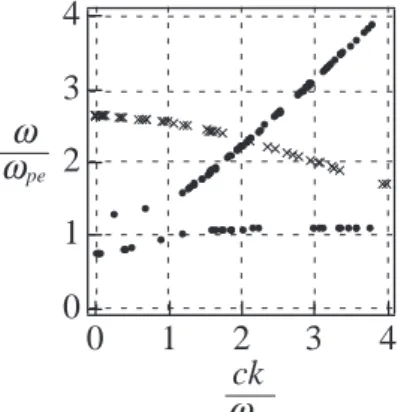
Figure 4 shows the dispersion relation of the X- mode with dots, while the fundamental electron Bernstein mode is shown by the crosses. The X- mode is defined by the parameter in the low density plasma where the X-mode is excited, while the Bern- stein mode is defined by the parameters with the high density plasma where the Bernstein mode is excited. The frequency and wave number in the dis- persion relation are normalized by ω
peand ω
pe/c re- spectively, where ω
peis defined by the electron den- sity in the initial condition. If the electron Bernstein mode can interact with the X-mode through the den- sity gap, the X-mode could be generated around the intersection seen in Fig.4 through the linear mode conversion. From Fig.3(d.3), we estimated the wave number ck/ω
peis about 2.1. This is a good agree- ment with the intersection between the Bernstein mode and X-mode as seen in Fig.4. We conclude that the thin density gap plays a very important role for the electromagnetic waves (X-mode) emis- sion through the linear mode conversion from the electron Bernstein waves which are excited by the electrons accelerated in the magnetic neutral sheet between two parallel current loops.
ω ω
peω ck
pe4 3 2 1 0
4 3 2 1 0
Figure 4: The dispersion relation of the X-mode (Dots) and the electron Bernstein mode (Crosses). The fre- quency and wave number are normalized by ω
peand ω
pe/c, respectively, where ω
peis defined by the low den- sity condition (background condition).
4 Summary
We investigated the emission process of electromag- netic waves during the coalescence of two parallel
current loops with being that the axial magnetic fields are antiparallel, by using a two dimensional, fully electromagnetic and relativistic particle-in-cell code. Due to the coalescence of two current loops, the electromagnetic waves are emitted from a wave source at the lower right part of the magnetic neutral sheet (seen in Fig.1). The asymmetry of the wave source is related to the fact that the electric field E
x,yinduced by the compression of the axial mag- netic fields can generate one-sided electron jet-like flow. The triggering mechanism for the extraordi- nary wave (X-mode) emission is due to the interac- tion between the accelerated jet-like electrons and the magnetic field normal to the velocity of elec- trons. When the accelerated electrons push the lo- cal magnetic field, the electron Bernstein waves are excited and eventually the electron Bernstein waves can be converted to the X-mode through the lin- ear mode conversion near the density gap region. In the next high-resolved observations it is hoped to be confirmed the present wave emission process.
Acknowledgment
S. Saito is supported by research fellowship of the Japan Society for the Promotion of Science (JSPS) for young scientists, as JSPS Research Fellow.
References
[1] Budden, K. G. 1961, Radio Waves in the Iono- sphere, Cambridge Univ. Press, New York.
[2] Buneman, O. 1993, in Computer Space Plasma Physics, Simulation Techniques and Software, edited by Matsumoto, H. & Omura, Y. Terra Sci- entific, Tokyo, p.67
[3] F´arn´ık, F., Karlick´y, M., & ˇSvestka, Z. 2003, Sol.
Phys., 218, 183
[4] Gold, T. & Hoyle, F. 1960, Mon. Not. R. Astro.
Soc., 120, 89
[5] Kundu, M. R., Nindos, A., & Grechnev, V. V.
2004, A&A, 420, 351
[6] Stix, T. H. 1992, in WAVES IN PLASMAS (American Institute of Physics), 295
[7] Wu, C. S., Yoon, Peter. H., & Li, Y., 2000, ApJ, 540, 572
富山大学総合情報基盤センター広報 vol.2 (2005) 76-79頁.
- 79 -