• 検索結果がありません。

Foreign capital inflows and economic growth: Does foreign capital inflows promote the host country's economic growth? An empirical case study of Vietnam and the intuitive roles of

N/A
N/A
Protected

Academic year: 2021

シェア "Foreign capital inflows and economic growth: Does foreign capital inflows promote the host country's economic growth? An empirical case study of Vietnam and the intuitive roles of"

Copied!
96
0
0

読み込み中.... (全文を見る)

全文

(1)

Foreign capital inflows and economic growth: Does foreign capital inflows promote the host country's economic growth? An empirical case study of Vietnam and the intuitive roles of

Japan's capital inflows on Vietnam’s economic growth.

Vu, Van Chung * January 15, 2015

ABSTRACT

This paper briefly describes the recent developments of capital inflows, Japan’s capital inflows in Vietnam and discovers the crucial roles of capital inflows for the long-term economic development.

The paper then derives a theoretical model and a system of hypotheses to estimate the growth effects of capital inflows in Vietnam in the past decades, both aggregate effects and individual effects.

Employing the empirical data from the period 1995 to 2013, the model’s estimated results find that capital inflows have strongly positive impacts on the Vietnam economic growth at national level and provincial level. The intuitive results thus can be applied to the Japanese capital inflows with regressing the model against the Japanese capital inflows data. The paper concludes that capital inflows are the most important factor that boosts the economic growth, followed by policy suggestions.

Keywords: Vietnam, capital inflows, FDI, foreign aid, ODA, remittances, economic growth, DAC, ASEAN, Japan’s capital inflows.

* Author works as a visiting scholar for the Policy Research Institute (PRI), Ministry of Finance of Japan.

* I sincerely thank the Office of International Cooperation, Policy Research Institute, Ministry of Finance of Japan for granting me this research opportunity, for the logistics supports, and paper’s helpful comments.

* The views expressed in this paper are based on the actual data investigation and do not necessarily reflect the

views or policies of the Vietnam government.

(2)

Tab le of co nten ts Introduction

I. Overall economic background

II. Recent developments of capital inflows in Vietnam 2.1 Foreign Direct Investment in Vietnam

2.1.1 FDI classified by local provinces and local regions 2.1.2 FDI classified by country of origins

2.1.3 FDI classified by business sector 2.1.4 FDI classified by type of investment

2.1.5 Recent Developments, Regional Comparativeness 2.2 ODA inflows

2.2.1 Recent developments 2.2.2 ODA classified by sector 2.2.3 ODA classified by donor

2.2.4 ODA classified by subnational governments and local regions 2.2.5 ODA in the ASEAN regional comparativeness

2.2.6 Japan’s ODA roles in Vietnam 2.3. Remittance inflows

2.3.1 Remittances comparativeness in developing countries 2.3.2 Vietnam Remittances by country of origin and by type 2.3.3 Remittances by local region and province

2.3.4 Roles of remittance and the development of the country

III. Theories, empirical evidence on capital inflows and economic growth 3.1 Capital and growth literature

3.2 Empirical studies of capital inflows and economic growth 3.2.1 FDI and growth

3.2.2 ODA and growth 3.2.3 Remittances and growth IV. Vietnam case study

4.1 Recent empirical researches on capital inflows and economic growth 4.2 Models and data

4.2.1 Capital stock and decomposition of economic growth contributions 4.2.2 Estimation model justifications

4.2.3 Major variables’ justification 4.2.3 Data collection

4.3 Estimation results and discussions

4.3.1 Checking production factors contributions to economic growth 4.3.2 Model’s regressional results and analysis

Conclusion and policy recommendations

(3)

3 Tables

Table 1: Economic Growth and Social Welfare Gain Table 2: Trade Structure by Main Group of Commodities Table 3: Capital Inflows and Economic Growth

Table 4: Foreign Capital Inflows and the Country’s External Accounts ($US Million) Table 5: FDI Contributions to the Economy

Table 6: FDI Classified by Local Region 2013

Table 7: Major FDI Players by Country and Territory

Table 8: FDI Classified by Sector, the 2013 Accumulated and Current Prices Table 9: Classification of FDI forms in period 2009-2013

Table 10: Vietnam and Major ASEAN Countries in Doing Business 2013 Table 11: AFTA Consolidated Tariffs 2010

Table 12. Vietnam ODA Types 2008-2010

Table 13: Vietnam DAC’s ODA Committed Inflows 1995-2012 (US$ million, current prices) Table 14. Ratios of ODA Funds are Used Local Procedures

Table 15: Vietnam Annual Disbursed Japan’s ODA over the Period 1995-2013 Table 16: Vietnam Overseas Labors by Country

Table 17: Vietnam Inward Remittances by Country

Table 18: Vietnam Remittances as a Share of Selected Indicators 2009 (nominal values) Table 19: GDP growth Decomposition by Production Factor, 1994 Constant Prices Table 20: Economic Growth by Capital Stock Decomposition

Table 21: A System of Hypotheses and Model Equations

Table 22. Estimation Growth Effects of Capital Inflows at National Level Table 23. Estimation Growth Effects of Capital Inflows at Provincial Level Table 24. Estimation FDI Determinants at National Level

Table 25. Estimation FDI Determinants at Provincial Level without Provincial Competitiveness Index

Table 26. Estimation FDI Determinants at Provincial Level with Provincial Competitiveness Index

Table 27. Estimation ODA Determinants at National Level

Table 28. Estimation ODA Determinants at Provincial Level

Table 29. Estimation Remittances determinants at National Level

(4)

4 Figures

Figure 1: GDP Growth in Major ASEAN Economies

Figure 2: GDP Decomposition by Economic Sector Contribution

Figure 3: FDI Accrual Registered and Accrual Disbursed Capital (US$ million) Figure 4: Registered FDI Capital by Major Provinces 2014

Figure 5: Vietnam FDI Annual Inflows 1995-2013 Figure 6: Stock of World FDI 2013

Figure 7: Stock of FDI in the Developing World 2013 Figure 8: Stock of FDI in Asia

Figure 9: Comparative FDI’s Growth in the ASEAN 1988-2013 Figure 10: ASEAN Gross Capital Formation (%GDP)

Figure 11: Vietnam Economic Growth and ODA Developments Figure 12: Vietnam ODA Commitment by Sector 1995-2012

Figure 13: Top ODA Donors in Vietnam 1995-2012 (accrued, committed) Figure 14: ODA Classified by Economic Region in 2012

Figure 15: Poverty Rate by Local Region

Figure 16: Vietnam Reception Procedure of ODA Figure 17: ASEAN Economic Performance

Figure 18: DAC’s Aid ASEAN Countries Comparativeness Figure 19: Japan ODA by Sector

Figure 20: Japan's Loans per Capita by Local Region

Figure 21: Japan Accrued ODA per Capita by Region Period 1995 -2013 (committed, yen) Figure 22: Japan’s disbursed ODA by Regional Comparativeness

Figure 23: Remittances Developing World Comparativeness

Figure 24: ASEAN Remittance Comparativeness (US$ million)

Figure 25: Kinship Household Overseas Remittances by Region

(5)

5 Abbreviations

ADB: Asian Development Bank AFTA: ASEAN Free Trade Area

ASEAN: Association of Southeast Asian Nations BCI: Country Business Competitiveness Index DAC: Development Assistance Committee DI: Domestic Investment

GDP: Gross Domestic Product GSO: Government Statistic Office FDI: Foreign Direct Investment IMF: International Monetary Fund

JICA: Japan International Cooperation Agency MOF: Ministry of Finance

MOFA: Ministry of Foreign Affairs MOIT: Ministry of Industry and Trade

MOLISA: Ministry of Labor Invalid and Social Affairs MPI: Ministry of Planning and Investment

ODA: Official Development Assistance PCI: Provincial Competitiveness Index

PEFA: Public Expenditure and Financial Assessment.

UNCTAD: United Nations Conference on Trade and Development WEF: World Economic Forum

WB: World Bank

WTO: World Trade Organization

(6)

6 Introduction

In the development literature, it is widely accepted that foreign capital inflows stimulate economic growth in developing countries and make it possible for host countries to achieve the sufficient investment levels that are higher than their own levels of domestic savings. Moreover, foreign capital inflows are a major source of financing, which may facilitate the transfer of the modern technology and innovations of industrialized countries to developing countries, thus helping their economies to accelerate the speed of growth. Economic growth is maximized when production factors have been optimized and capital stock has been fully accrued. In the widely global trend of integration, the more capital flows are moving which lead to easing capital constraints and growth acceleration in developing countries, the faster development gaps between developed economies and developing economies are narrowed. Vietnam economy has witnessed a good growth so far because of large inflows of major production factor - capital resources associated with technological progress. This paper investigates the effects of capital inflows and economic growth in host countries, the case of Vietnam and intuitive roles of Japan's capital transfers in the process of Vietnam’s socioeconomic development.

In the first part, the paper provides a brief introduction of overall economic backgrounds. In the

next part, the paper explores more about recent developments of capital inflows in Vietnam and

Japan capital inflows in Vietnam. In the rest of the paper, theoretical backgrounds and

econometric models are employed in the following parts to gauge the growth effects of each type

of capital inflow and their aggregates. The paper concludes that capital inflows are very crucial

for economic growth in Vietnam, which then followed by policy recommendations to attract

more capital inflows for future economic growth.

(7)

7 I. Overall economic background

Vietnam’s economy has witnessed a relatively stable growth trend in since 1990. The annual economic growth gained 8-9 percent for the period 1990-2000 except for two years 1997 and 1998 owing to the Asian financial crisis (Table 1). The economy took 4 years after the crisis to recover with gradual gains around 6 percent and rebooted with high growth of 7 percent in the period 2002-07. However, the growth was cut down and kept stable at the low level of about 5.5 percent for the period 2008-2013 because of the 2008 global financial crisis and its consequences.

The high growth trend was broken, but remained quite reasonable in the context of the weak trend of global economic growth. As compared with ASEAN countries, Vietnam economy, except for years of crises, has overwhelmed the average growth of regional peers and also less serious affected by the crises than Indonesia, Thailand, Malaysia, and Singapore (Figure 1).

Table 1: Economic growth and social welfare gain Year GDP growth

(%)

GDP per capita (US$)

Year GDP growth (%)

GDP per capita (US$)

1986 2.3 202 2001 6.9 416

1987 3.6 205

2002 7.1 441

1988 6.0 211

2003 7.3 492

1989 4.7 220

2004 7.8 558

1990 5.1 227

2005 8.4 642

1991 6.0 235 2006 7.0 797

1992 8.7 251 2007 7.1 919

1993 8.1 266

2008 5.7 1,165

1994 8.8 285 2009 5.3 1,232

1995 9.5 301

2010 6.4 1,334

1996 9.3 337

2011 6.2 1,543

1997 8.2 261

2012 5.3 1,755

1998 5.8 365

2013 5.4 1,909

1999 4.8 374 2014 5.9 2,357

2000 6.8 402

2015 6.2 2,520

Sources: GSO statistics yearbook 1994-2013; for year 2014, data are the first estimate by the MPI, 2015 is the

MPI’s projection in the 2015 socioeconomic development plan.

(8)

8 Figure 1: GDP growth in major ASEAN economies

Sources: GSO statistics yearbooks, World Bank development indicators.

In the development process, the Vietnam’s economy has gradually shifted from a centrally- planned system to a market-oriented system after the period “Doi Moi” 1 . Economic growth is mainly based on the capital and labor intensiveness via maintaining a sustained high level of the gross investment while it shifts towards more export-oriented by trading key products such as staples, textiles, mining products, and other light industrial products. Major economic growth drivers are the relatively strong institutional system, the deeper global integration and trade expansion, and the large capital inflows.

A relatively strong institutional system is the first pillar of economic growth. At first, the Vietnam economy with a diverse sector economy has been initiated and promoted since 1989 with a lapse of three years after “Doi Moi” period. However, the multi-sectorial economy actually meant from 1997 as the state sector kept their monopoly rights in exports and imports before this time. Thus, private firms and joint venture firms were only authorized to acquire their trade rights via the state-owned firms. Since the 1997 when the economy was widely liberalized, the private sector and FDI sector have been increasing their roles in the economy. They became major locomotives of the economic growth at the expense of state-owned sector’s contraction. In addition, the legal system has been synchronized and well-interconnected among business relationship, trade, investment, credit and banking, entrepreneurship, and tax policy. A good

1 The period “Doi Moi” called for the whole economic renovation, started since 1986.

-15.0 -10.0 -5.0 0.0 5.0 10.0 15.0 20.0

1986 1987 1988 1989 1990 1991 1992 1993 1994 1995 1996 1997 1998 1999 2000 2001 2002 2003 2004 2005 2006 2007 2008 2009 2010 2011 2012 2013

%

ASEAN Vietnam Indonesia Malaysia

Philippines Singapore Thailand

(9)

9 legal system acts as a catalyst to the economic and business activities. Particularly, the 1988 Law on foreign investment creates a good environment for FDI firms to invest in Vietnam. The 2005 Law on enterprise integrates the 1990 Law on investment for domestic firms and the 1988 Law on investment for foreign firms, which removes the discrimination between domestic firms and foreign firms. This unified Law has equalized and enhanced the foreign firm position.

Figure 2: GDP decomposition by economic sector contribution

Source: GSO statistics yearbooks 2013

The second growth driver is the deeper global integration and trade expansion. Vietnam has actively merged its economy into the global economy towards more open and trans-border economic cooperation. Vietnam has become an active member of regional and international institutions and organizations 2 such as the AFTA, ASEAN, the ASEM, APEC, and the WTO.

Major trade agreements have been recognized such as trade agreements with the US, Japan, China, ASEAN peers, and EU partners. Trade has been significantly contributed to the economic growth of Vietnam.

According to Blaug (1992) in his recent empirical study 3 , besides production factors such as capital and labor, trade activities are believed to create new added values and surplus for the economy. Trade directly creates growth values via country’s absolute advantages, and indirectly via the country’s dynamic advantages of all factor effects. Vietnam’s major exports are primary products, e.g. staples, light industries (textiles and chemistry), and sorted medium-levels of

2 Vietnam joined ASEAN and AFTA in 1995, ASEM in 1996, APEC in 1998, WTO in 2006; TPP expected 2015;

and over 180 countries worldwide.

3 Blaug, M 1992, ‘The methodology of economics, or, How economists explain’, Cambridge University Press, New York.

0%

10%

20%

30%

40%

50%

60%

70%

80%

90%

100%

1995 1996 1997 1998 1999 2000 2001 2002 2003 2004 2005 2006 2007 2008 2009 2010 2011 2012 2013

Axis Title

State-own sector Private sector FDI sector

(10)

10 technological products (electronics, electric machines), which create direct values for the economy. Meanwhile, imports also play a crucial role in the economy via capital formation, technological transfers, good management practices and know-hows from advanced countries. A fact that recent negative trade was imbalanced is plausible as imports are machineries and high- tech products with high values while exports are primary products with much lower value.

Table 2: Trade structure by main group of commodities No. Structure of exports and

imports

1991- 1995

1996- 2000

2001- 2005

2006-

2010 2011 2012 2013

I Structure of exports

1

Mining and heavy industrial

products 31.7 30.6 34.3 33.9 35.8 42.1 44.3

2 Light industries and handcrafts 19.4 34.6 40.2 42.9 41.6 37.8 38.1

3 Primary products 48.9 34.8 25.5 22.8 22.5 20.1 17.6

II Structure of imports

4 Machineries and equipment 24.4 29.8 29.2 28.5 29.6 35.1 36.7 5 Production Materials 60.5 61.1 62.7 60.8 59.0 55.8 55.3

6 Consumer products 15.0 9.1 7.7 8.4 9.5 9.1 8.0

7 Other imports 0.0 0.0 0.4 2.3 1.9 0.0 0

Source: GSO statistics yearbooks 1994-2013

The third pillar of economic growth is the large capital inflows in the economy. The Vietnam

economy has harnessed significantly considerable capital inflows during the process of

development. A recent trend shows that economic growth and capital inflows have followed the

same walks. When the capital inflows decline, the economy reduces its growth speed and vice

versa, because the economic growth depends much on capital investment. For instance, the

capital inflows, particularly FDI, reduced in 1999 and 2009, which lead to a decrease in the gross

investment and a slowdown in the economic growth at the same time. However, the losses in

FDI inflows were off-set apart by the countercyclical inflows, i.e. ODA and remittance inflows,

which could partly restrain the falling momentum of economic growth.

(11)

11 Table 3: Capital Inflows and Economic growth

Year

Gross Investment to GDP (%)

FDI (US$ million)

ODA (US$ million)

Remittance (US$ million)

Economic growth (%)

1995 31.6 1,993 835 285 9.5

1996 31.0 2,058 933 369 9.3

1997 33.3 2,593 1,010 450 8.2

1998 30.8 1,831 1,177 950 5.8

1999 32.3 1,626 1,429 1,200 4.8

2000 32.1 1,918 1,681 1,750 6.8

2001 34.3 2,037 1,441 1,100 6.9

2002 36.4 2,278 1,280 1,770 7.1

2003 39.4 2,469 1,761 2,100 7.3

2004 40.2 2,626 1,849 2,310 7.8

2005 39.8 3,222 1,911 3,150 8.4

2006 37.0 4,102 1,843 3,800 7

2007 43.7 8,035 2,505 6,180 7.1

2008 41.4 11,696 2,516 6,815 5.7

2009 39.1 10,617 3,812 6,020 5.4

2010 41.6 11,525 3,005 8,260 6.4

2011 36.5 11,063 3,659 8,600 6.2

2012 31.4 10,495 4,130 10,200 5.3

2013 30.4 11,470 5,121 11,200 5.4

Source: GSO, MPI statistics and author's calculations

The roles of capital inflows are not ignorable to the Vietnam’s economic development. One of

the growth effects of FDI and ODA inflows is the promotion of country’s exports. Next, it

changes the economic structure towards a more industrial and more export-oriented economy. In

addition, foreign capital inflows would create more employment in the economy, which reduce a

largely redundant labor force in the rural areas. Last but not least, foreign capital inflows can

ease capital constraints for socioeconomic investment and help to balance the country’s current

account, to build up more foreign reserves and to maintain a stable exchange rate system.

(12)

12 Table 4: Foreign Capital Inflows and the Country’s External Accounts ($US Million)

Items 1995-00 2001-05 2006-10 2011 2012 2013

1. Current Account (2+3+4) -701 -678 -4,940 233 9,267 9471

2.Trade balance -2,083 -3,536 -11,048 -9,844 749 863

3. Investment income and

current transfers 548 980 616 1,476.9 -1,681.6 -2,592

4.Remittances 834 1,877 5,492 8,600 10,200 11,200

5. Capital Account 3,179 4,009 10,594 14,658 14,611 16,591 Net FDI inflows 2,003 2,439 8,069 11,063 10,495 11,470

Net ODA inflows 1,176 1,570 2,525 3,595 4,116 5121

6. Change in foreign

Exchange reserves (1+5) 2,478 3,331 5,654 14,891 23,878 26,062

Source: ADB 2014, IMF2013, and author calculation

However, the economy is dealing with a number of growth challenges that are adverse economic conditions, unequal distribution of resources, and weak financial system. Firstly, adverse economic environment and investment climate which drew down the capital inflows of neighbor countries, e.g. Japan, Singapore, Taiwan, Korea, Hong Kong. Secondly, there exits an unequal treat of capital resources between the state-owned sector and the private sector, but the state- owned sector is not economically efficient. They accounted for a half of capital investment in the economy, but contributed about 36 percent of gross domestic products. In contrast, the private sector accounted for 30 percent of the economy’s gross investment resources, but contributed about 40 percent of total country’s output. Nevertheless, if compared with regional peers, the Vietnam’s private sector remained quite modest. The Malaysian private sector accounted more than 60 percent of gross investment and more than 50 percent of the economy’s output. The Chinese private sector contributed more than 70 of gross investment and output. The Singaporean private sector could contribute more than 80 percent of the gross investment.

Thirdly, the financial system is inadequate and fails to meet the demand of the economy for some times. Capital mobilization in the stock market remained modest with majority of government bonds and small amount of firms’ bonds. This is plausible because the stock market capitalized remains less than one third of GDP size, much lower than the 100 percent of Thailand, 150 percent of Malaysia and Singapore (World Bank 2013).

Further exploration of the roles of capital inflows is explained in the other sections of the paper.

In the section II, the paper focuses the recent developments of FDI, ODA, and remittances

separately and their important roles in the economic development of Vietnam. In the section III

and section IV, the paper will employ an empirical approach to gauge the effects of individual

elements of capital inflows on the economic growth at the national level and provincial level data.

(13)

13

0 50,000 100,000 150,000 200,000 250,000 300,000

0 2,000 4,000 6,000 8,000 10,000 12,000 14,000 16,000 18,000

Number of projects Registered capital (accrued) Disbursed capital (accrued)

II. Recent developments of capital inflows in Vietnam 2.1 Foreign Direct Investment in Vietnam

FDI capital inflows have been found relatively strong and stable over time. It had started to inject in 1988 with few projects, and reached an accumulated number of 1,620 projects with registered capital of US$5,516 million in 1995. The number of projects continued to accrue through the time with an average annual speed of approximately 15 percent, and sooner reached a record of 15,932 projects with US$234,121 million of registered capital in 2013. However, there remains a large gap between the registered capital and the disbursed capital, in which the disbursement rate attains about 22 percent in 20-year average. In the most recent years, the gap has been gradually contracted, but remained somewhat 60 percent of the difference, showing that there remains a great deal of efforts needed to fully capture the rest of undisbursed capital inflows.

Figure 3: FDI Accrual Registered and Accrual Disbursed Capital (US$ million)

Source: GSO, MPI, Statistics yearbooks, 2000-2013

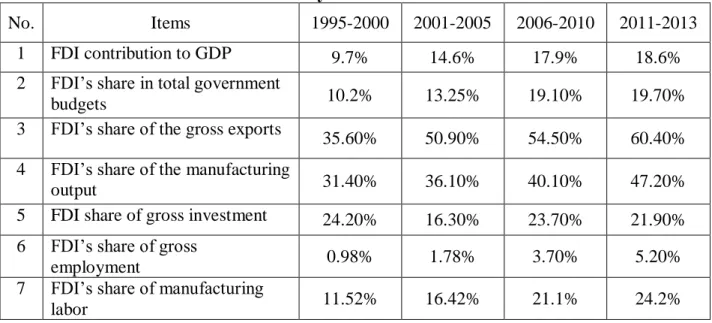
Regarding spillover effects, FDI sector accounts for large portions of economic growth, exports, and country’s foreign exchange reserves 4 . Recent data have shown significant roles of the FDI sector among other economic sectors. The FDI’s portions showed an upward trend relative to other sectors’. In the first place, in the period 1995-2000, foreign firms contributed 9.7 percent of Gross Domestic Products, 10.2 percent of the general government budget, a half of the country’s

4 See Table 4 for information on foreign exchange reserves

(14)

14 gross exports, a fifth of the gross investments. In addition, it was incredibly seen that the foreign sector contributed nearly a half of the manufacturing sector’s output and more than a half of the gross export values in the period 2011-2013, playing an equal role to the domestic economic sectors. Thus, FDI sector has shifted the economic structure towards more industrialized economy and more export-oriented economy. Nevertheless, the FDI sector remains quite modest in improving the country’s employment stance. The foreign sector has just employed only 0.98 5 percent of total economy’s employment. In the employment in the manufacturing sector, however, foreign firms have employed a relative large number of domestic labors. The FDI firms employed have reached approximately 12 percent of the total manufacturing workers in the period 1995-2000, doubling at around 24.2 percent in the period 2011-2013 (Table 5).

Table 5: FDI contributions to the economy

No. Items 1995-2000 2001-2005 2006-2010 2011-2013

1 FDI contribution to GDP 9.7% 14.6% 17.9% 18.6%

2 FDI’s share in total government

budgets 10.2% 13.25% 19.10% 19.70%

3 FDI’s share of the gross exports

35.60% 50.90% 54.50% 60.40%

4 FDI’s share of the manufacturing

output 31.40% 36.10% 40.10% 47.20%

5 FDI share of gross investment 24.20% 16.30% 23.70% 21.90%

6 FDI’s share of gross

employment 0.98% 1.78% 3.70% 5.20%

7 FDI’s share of manufacturing

labor 11.52% 16.42% 21.1% 24.2%

Sources: No.1,3,4,5,6,7 from the GSO-MPI; No.3 from MoF of Vietnam

2.1.1 FDI classified by local provinces and local regions

Over two recent decades, industrial and export processing zones have attracted and capitalized a large amount of investment capital and employment in the entire economy. Having directed by the government policies to focally attract and mobilize investment capital for economic growth, a great number of export processing zones, industrial parks, and border-gate economic zones has been well-developed so far. Those zones are fully equipped with basic infrastructures (gas, electricity, water and environment) and have been accommodated with a wide range of incentives for foreign investors such as lower land rent, tax incentives.

5 GSO statistics yearbook 2013.

(15)

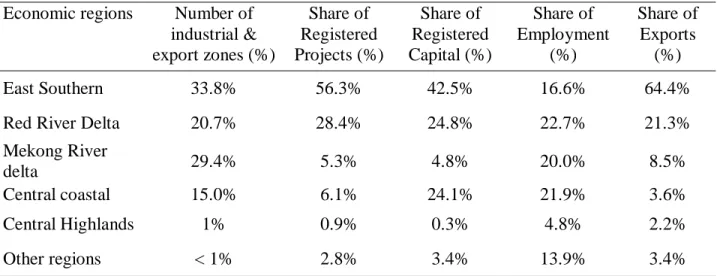
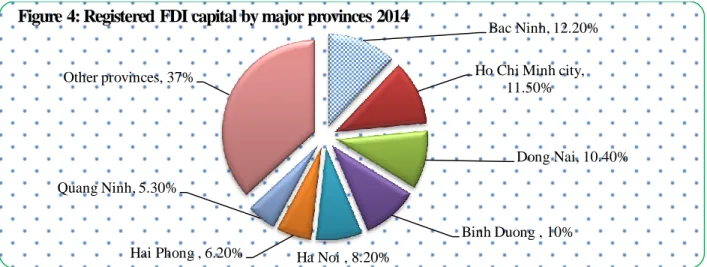
15 Unquestionably, FDI firms would like to place their factories in where infrastructures are relatively well-developed and local government incentives are enhanced. Recently, there have been about 299 industrial zones nationwide. Geographically, those zones concentratively lie in major economic regions such as the Southeastern Economic region with 101 zones, e.g. Ho Chi Minh city (19), Dong Nai (31), Binh Duong (27), Ba Ria-Vung Tau (13), the Red River Delta economic region with 64 zones, e.g. Hanoi (14), Bac Ninh (15), Hai Duong (11), Hung Yen (5), the Me Kong river delta with 88 zones, e.g. Long An (36), Can Tho (10), Kien Giang (6), otherwise few zones in the rest regions. Annually, industrial zones attract around 40 percent of total FDI inflows, but account for 80 percent of the manufacturing sector’s capital nationwide, and eighty-five percent among them are 100 percent foreign-owned enterprises. Provinces in the Southeast region are natively the early birds to open industrial zones for FDI firms. The second region is the Red River Delta and the third region is the Mekong river delta (Table 6). Since early quarters in 2014, it has been witnessed a mighty trend of FDI firms moving in some provinces where incentives to foreign firms are more attractive. Only 7 provinces have accounted for roughly 70 percent of the country’s FDI inflows. Of which, Bac Ninh 6 province is leading with 12.2 percent of the total registered capital and huge projects of Samsung group, Nokia corporations. Ho Chi Minh City ranks second with 11.5 percent of the total registered capital, Dong Nai province with 10.4 percent, and Binh Duong with 10 percent (Figure 4).

Table 6: FDI classified by local region 2013 Economic regions Number of

industrial &

export zones (%)

Share of Registered Projects (%)

Share of Registered Capital (%)

Share of Employment

(%)

Share of Exports

(%)

East Southern 33.8% 56.3% 42.5% 16.6% 64.4%

Red River Delta 20.7% 28.4% 24.8% 22.7% 21.3%

Mekong River

delta 29.4% 5.3% 4.8% 20.0% 8.5%

Central coastal 15.0% 6.1% 24.1% 21.9% 3.6%

Central Highlands 1% 0.9% 0.3% 4.8% 2.2%

Other regions < 1% 2.8% 3.4% 13.9% 3.4%

Sources: GSO-MPI and author's calculations

6 In the case of Bac Ninh province and Ho Chi Minh city, a number of incentives are offered to Samsung Group

such as 4 years of CIT exemption, 50% CIT reduced in next 9 years by Laws, and local incentives of extra 3 years of

50% CIT discounted, 50% of assisting the labor training cost, 50% discounted fees of using industrial zone’s

infrastructures.

(16)

16 Sources: MPI and author's calculations

2.1.2 FDI classified by country of origins

The number of foreign invested firms has been increased significantly with a wide range of countries. Those at very top countries are regarded in the Table 7, occupying over 80 percent of the registered capital and projects. Geographically, FDI firms tend to have their investment destinations where are close to their motherlands. The Table 7 also indicates that Japan, Singapore, Korea PR and Taiwan in the East Asia region are always the largest countries/territories investing in Vietnam. Their projects accounts for 60 percent of the total FDI projects and the registered capital. Japanese investors have had the most important roles among other foreign investors in Vietnam so far. For instance, Japan’s FDI ranks first among the major foreign direct investors in terms of the registered capital portion (15 percent), ranks second on the exports portion (10.3 percent), and ranks third on the number of registered projects.

Table 7: Major FDI players by country and territory Country/ territory

Number of registered

projects

Share of Registered Projects (%)

Share of Registered Capital (%)

Share of Exports (%)

Annual change of export (%)

Japan 2186 13.7 15.0 10.3 4.3

Singapore 1243 7.8 12.8 2.0 12.2

Korea Republic 3611 22.7 12.7 5.0 18.6

Taiwan, PR 2290 14.4 12.0 1.7 6.5

British Virgin Islands 523 3.3 7.3 0.1 -

Hong Kong, PR 772 4.8 5.3 3.1 10.9

United States 682 4.3 4.6 18.1 21.2

Malaysia 453 2.8 4.4 3.7 9.3

China, PR 992 6.2 3.2 10.0 3.1

Thailand 339 2.1 2.7 2.4 9.6

Total 13,091 82.2 80.1 56.4 10.82

Sources: GSO-MPI, and author's calculations, those data are accumulated to 2013

Bac Ninh, 12.20%

Ho Chi Minh city, 11.50%

Dong Nai, 10.40%

Binh Duong , 10%

Ha Noi , 8.20%

Hai Phong , 6.20%

Quang Ninh, 5.30%

Other provinces, 37%

Figure 4: Registered FDI capital by major provinces 2014

(17)

17 2.1.3 FDI classified by business sector

Fortunately, most of the FDI projects are in the manufacturing sector that could strongly facilitate the economic growth and much improve the gross employment. Economically, the structure of foreign investors has concentrated in industrial production, e.g. oil and gas, manufacturing and processing industries, e.g. garments, footwear, food production, beverages.

Those main sectors account for 9,158 projects associated with registered capital of US$146.13 billion, representing 58 percent of the total projects and sixty-two percent of the gross registered capital. Construction and real estate sectors also play a crucial role in the foreign invested all sectors, they account for 25.2 percent of the gross registered capital. In regard to the size of projects, those very large-sized projects are laid in the real estate sector, gas and electricity sector, accommodation, and food sector with capital per project of US$120 million, 104 million, and 31 million respectively. Other important sectors, albeit relatively small, are the agriculture, fishing and forestry sector, trades and wholesales sector, transports and logistics services, etc., contributing only around 12 percent of the gross registered capital. Those small sectors remain a much larger room for future growth (Table 8).

Table 8: FDI classified by sector, the 2013 accumulated and current prices

No. Economic sector Registered

Projects (%)

Registered capital (%)

Size of project on average ($million)

1 Manufacturing 54.8 53.8 14

2 Real estate activities 2.6 20.9 120

3 Accommodation and Food

service activities 2.1 4.6 31

4 Construction 6.6 4.4 10

5 Electricity, gas, steam and air

conditioning supply 0.6 4.1 104

6 Information and communication 5.9 1.7 4

7 Arts, entertainment and

recreation 0.9 1.6 26

8

Wholesale and retail trade; repair of motor vehicles and

motorcycles

7.1 1.5 3

9 Transportation and storage 2.4 1.5 9

10 Agriculture, Forestry and

Fishing 3.1 1.4 7

Sources: GSO statistics yearbook 2013

(18)

18 2.1.4 FDI classified by type of investment

By the laws 7 , three forms of foreign investments are allowed to do business in Vietnam are 100 percent-foreign owned enterprises (FOEs), Joint-Venture enterprises (JVs), and the contract forms, i.e. Business Corporate Contract (BCC), Building/Operation/Transfer (BOT), Building /Transfer/Operation (BTO), Building/Transfer (BT). However, the main portions those are FOEs.

In the form of FOEs, foreign investors may establish economic entities or Limited liability companies (LLCs) whereas in the forms of JVs, foreign investors may enter a joint venture where there is at least one foreign and one domestic firm. FOEs are currently recommended over joint ventures and they can be formed quickly through a simple application of investment licenses. The JVs form generally faces issues such as anti-corruption scrutiny and quite a lot of domestic intricate procedures.

In recent years, FOEs have accounted for over 80 percent of the licensed projects, employment, and 70 percent of the annual operational foreign-invested capital on average, while those in the form of JVs and the rest have taken only 20 percent of the licensed projects and registered capital.

Most of the JVs have been conducted with State-owned enterprises (SOEs) with over 90 percent of total projects; JVs with the private sector are few and restricted. The forms of BCC/BOT/

BOT/BTO/BT contracts have been widely applied for utilities sector, such as road and transport, water and electricity supplies, but most of them are time-consuming to set up and fiercely negotiated. Hence, those contract forms are less popular among the FDI types.

Table 9: Classification of FDI forms in period 2009-2013

Classification of Investments 2009 2010 2011 2012 2013

Forms of Investment 100% 100% 100% 100% 100%

100% foreign capital 77.1% 82.6% 82.6% 83.4% 83.8%

Joint-venture and others 22.9% 17.4% 17.4% 16.6% 16.2%

Employment 100% 100% 100% 100% 100%

100% foreign capital 84.3% 88.1% 88.2% 89.7% 91.0%

Joint-venture and others 15.7% 11.9% 11.8% 10.3% 9.0%

Annually Operation Capital 100% 100% 100% 100% 100%

100% foreign capital 58.1% 69.4% 62.2% 73.6% 75.0%

Joint-venture and others 41.9% 30.6% 37.8% 26.4% 25.0%

Sources: GSO-MPI and author's calculations, those data are accumulated to 2013

7 The Law on Enterprises 2005, the Law on Securities 2006, and the Law on Investment 2005

(19)

19 A recent trend in FDI, M&A, appears in the East Asia in which foreign investors prefer acquiring the domestic firms via purchasing a domestic firm’s equity to setting up a green-field project.

This type of investment does not expand the firm’s physical facilities promptly so that the host countries are eagerly expecting some positive gains from technology transfers and management know-how. China is a good example market where takes place about 40 percent of total Asia M&A successful cases 8 , while Vietnam has a limited number of M&A successful cases. Equity investment is not the only way for FDI firms to internalize their overseas production system, but also a type of interconnected chain in which host countries’ firms are directly involved in out- sourcing processes and subcontracting activities. It is expected that the M&A investment type for foreign investors are remaining much room to grow in Vietnam.

2.1.5 Recent Developments, Regional Comparativeness

Source: GSO’s yearbook statistics 1995-2013.

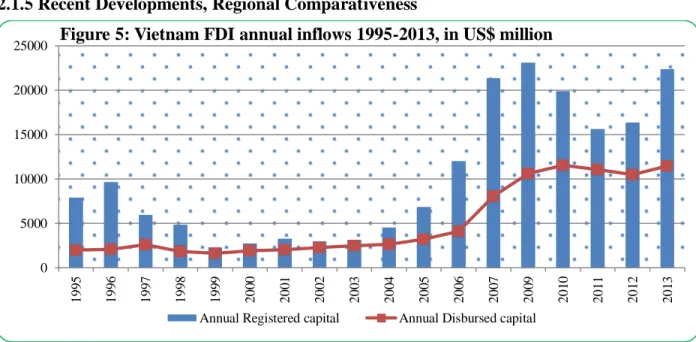
The FDI firms’ capital has commenced and accumulated with a sorted high-speed annually, experiencing two significant booms in the period 1995-1996 and 2006-2010. The FDI inflows had reached the first boom with US$7,153.5 million of the disbursed capital and US$19,982.6 million of the registered capital for during the period 1988-1995. The average growth rate was almost at 50 percent annually. Then, Vietnam’s FDI had the second boom in the period 2006- 2009 with average growth rate of nearly 100 percent and 40 percent of the registered capital and the disbursed capital respectively or US$194 billion and 64 billion in equivalence. Nevertheless, the few losses of the FDI inflows were seen during two financial crises, of which the former in the Asia region in 1997 and the latter in global scale in 2008. After experiencing the two peaks in 1996 and 2008, the FDI inflows had been contracted with the quit rate of approximate 40% of

8 http://www.mergermarket.com/pdf/Mergermarket.2013.LegalAdvisorM&ATrendReport.pdf 0

5000 10000 15000 20000 25000

199 5 199 6 199 7 199 8 199 9 200 0 200 1 200 2 200 3 200 4 200 5 200 6 200 7 200 9 201 0 201 1 201 2 201 3

Figure 5: Vietnam FDI annual inflows 1995-2013, in US$ million

Annual Registered capital Annual Disbursed capital

(20)

20 the total registered projects. Kokko (1996) claims that there were as many as 800 licensed projects withdrawn or revoked during this period of the Asian crisis. Foreign investors took care of their monies and possible risks, the banks also acted the same things. Then, credit crunches incurred, the Asian economies slowed down as a result. Besides, an additional loss to Vietnam’s FDI inflows apparently was driven by the Asian regional competition and the next hit by the 2008 global financial crisis.

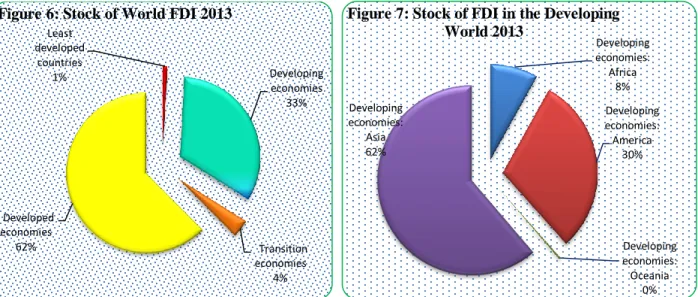
Regarding to the size of the capital, the FDI inflows gradually have been accrued through the time, but relatively small annual change. As compared to other regions, FDI inflows likely depend on the size of an economy, the level of developments of that economy, and long-term global economic structures. The FDI world flows, interestingly, focuses in the developed world themselves via cross-investment and account for 62 percent of the total global accumulated FDI inflows. About one third of the total global FDI is circulated in the developing countries, of which a relatively modest portion of 4 percent is channeled to the transitional economies and even less than 1 percent is for the least developed economies (Figure 6). It is plausible that FDI inflows stick to the developed countries where the economies had well-endowed with capital stock, human stock, technology and management as well. These conditions would ensure any success for FDI firms afterwards. Similarly, the FDI firms choose the same motive as above for the developing world in greater Asia, America, Africa, and Oceania.

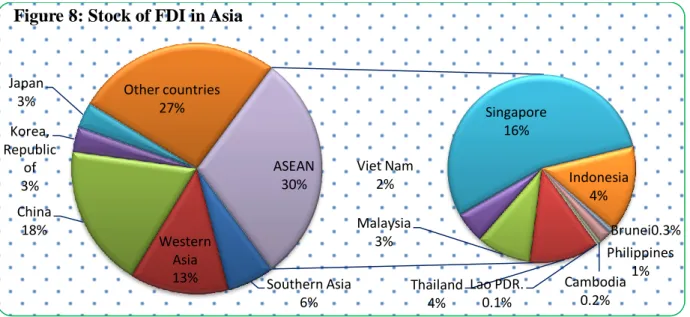
In the developing Asia, FDI inflows vary widely. China experienced a steady increase in its FDI inflows from the very early 1990s to 2002. Figure 8 shows that China has accrued at 18 percent of the world FDI, Japan 3 percent and South Korea, 3 percent were the main attraction places of FDI relative to 30 percent of the rest of the ASEAN region. Now, China remains quite large FDI destination in East Asia. Ranking second and third in the East Asian large destinations are Japan, South Korea.

Least developed

countries 1%

Developing economies

33%

Transition economies

4%

Developed economies

62%

Figure 6: Stock of World FDI 2013

Developing economies:

Africa 8%

Developing economies:

America 30%

Developing economies:

Oceania 0%

Developing economies:

Asia 62%

Figure 7: Stock of FDI in the Developing

World 2013

(21)

21 Source: UNCTAD annual development reports data (http://unctad.org)

In the ASEAN region, Figure 8 shows that Singapore accounts for 16 percent of the regional inflows, Indonesia 4.3 percent, Thailand 4 percent, Malaysia 3 percent, and Vietnam 2 percent of the developing Asia’s FDI inflows. Vietnam and other small economies, e.g. Laos PDR, Cambodia, and Brunei witnessed a relative stable trend in FDI disbursement inflows. The rest and but the largest FDI attractors in the ASEAN members have been witnessing the volatile FDI outflows. For instance, the Indonesia case was clearly seen net outflows of investment as MNEs had divested or drew down their assets during 1991-1995 and 1997-2003, or Thailand, Malaysia, Philippines in the period 1996-1997 and the period 2000-2003. The phenomenon may be mainly excused by political instability and social disruptions.

As compared with other peers in the ASEAN region, Vietnam’s FDI growth has reached slightly above averaged ASEAN growth and kept stable over time (Figure 9). It hit two peaks in 1990 of roughly 300 percent (with initial small but a sudden jump) and 40 percent in 2008, a quite similar as compared to other countries in the region. The FDI trend then became steadily for the rest periods. Vietnam FDI growth was less significant relative to Indonesia (though fluctuating), Thailand, and Malaysia. In the most of the time, their FDI inflows were almost higher the average rate of Vietnam’s FDI growth, showing their strongly attractive destinations to the global investors than Vietnam. Moreover, FDI inflows have slowed down recently.

Southern Asia 6%

Western Asia 13%

China 18%

Korea, Republic

of 3%

Japan

3% Other countries

27%

Lao PDR.

0.1%

Thailand 4%

Malaysia 3%

Viet Nam 2%

Singapore 16%

Indonesia 4%

Brunei0.3%

Philippines Cambodia 1%

0.2%

ASEAN 30%

Figure 8: Stock of FDI in Asia

(22)

22 Figure 9: Comparative FDI’s growth in the ASEAN 1988-2013

Source: UNCTAD annual development reports data (http://unctad.org)

2.1.5.1 Domestic advantages

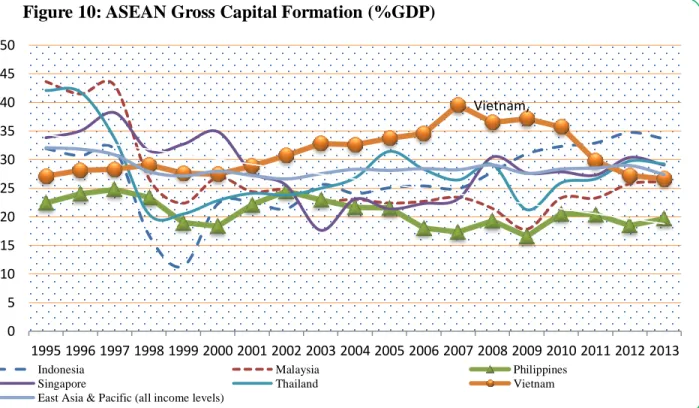
In the first place, Vietnam has maintained the stable socioeconomic and political environment over time. The unique party and a unified hierarchical system of executive, legislative and justice branches would facilitate a potential long-run climate of investment and growth. The Economist (2009) assesses Vietnam with 2.5 points, ranking in top 20/165 countries in the world who have low risks of social unrests and economic distresses globally. Meanwhile the other ASEAN countries show a more vulnerable political environment. Malaysia has 7.1points, Thailand 7.1 points, Indonesia 6.7 points, Myanmar 6.3 points, and the Philippines 4.6 points. Therefore, with good score, Vietnam is gaining a stable socioeconomic and political environment relative to the other ASEAN and of course the safety of foreign direct investments is surely guaranteed. In addition, JETRO (2014) investigates the potential impact of socioeconomic and political factors affecting the trade and investment decisions. JICA finds that Indonesia has the most vulnerable countries with high infrastructure under-developed (41.5 percent), political instability and social disruptions (22.6 percent), legal issues (24.5 percent), and exchange rate risk (21.8 percent);

Thailand has 3 vulnerable factors i.e. political instability (46.4 percent), labor cost hike (29.3 percent), natural disasters and environment pollution (28.8 percent); Philippines faces with infrastructure, political, and natural disasters and environment pollution, whereas Myanmar faces the most vulnerable factors i.e. under-developed infrastructure, political and legal issues;

Vietnam faces two problems with infrastructure and legal issues, but political and socio-

-60.0 -10.0 40.0 90.0 140.0 190.0 240.0 290.0 340.0

ASEAN

Thailand

Malaysia

Indonesia

Singapore

Philippines

Viet Nam

Others

(23)

23 economic stability. Thus, with macroeconomic and political stability, Vietnam gains better scores relative to other regional peers.

Secondly, Vietnam’s legal systems have been relatively accomplished and complied with international practices. Particularly, in the context of hard-time the government provides more financial incentives, e.g. tax exemption, land-rent discount and export facilitation so that the FDI firms are promoted and then economic growth is boosted. The legal systems for FDI, such as the 2005 Law on Enterprise, the 2013 Law on CIT and their guidelines are encouraging the business in several sectors that are closely related to foreign investment firms. Tax rates, e.g. CIT, PIT, and V.A.T, also tend to reduce and its payment procedures are tuning up, supporting business in the difficult time. For instance, the new CIT tax rate has been reduced to 22% or even 20% for those US$ 1 million-businesses, a large reduction from 28% before 2014. This is a good sign in the context of other countries would try to keep or even hike their tax rates to assist the public budget burdens.

In addition, the 2014-15 Global Business Competitiveness Index Report shows that Vietnam business competitiveness post has been bounced back in 70, an increase of 5 ranks from the 75 rank in 2012 9 out of 189 countries. Major drivers for this higher rank are the increase in the quality of overall infrastructure and the rise of available airline seat km/week, the rest of other indices has been kept stable or slightly decreased.

Moreover, there is a new trend of FDI inflows in Vietnam owing the shifting their factories from the place with high-cost of operation and less incentives (China) to Vietnam. It is clearly seen that labor cost in China more than double labor cost in Vietnam 10 . Recently, a large number of big Multinational Corporations’ new factories of Nokia Group, Samsung Group, Life’s Good (LG), Intel Group, etc. have shifted to Vietnam, showing that Vietnam is a relatively attractive market among other peers in the region.

9 WEF, 2014, Global Competitiveness Index Report (http://reports.weforum.org/global-competitiveness-report-2014-2015).

10 World Bank, 2014, Doing Business Report.

(24)

24 Source: UNCTAD annual development reports data (http://unctad.org).

2.1.5.2 Disadvantages

JETRO (2014) and World Bank (2014) have compared the business costs among regional countries and they find that Vietnam’s business climate has been gradually improved over time.

However, to some extent costs of doing business and business setup procedures have remained disadvantageous. Regarding the competitiveness among major ASEAN peers, it can be true that the works dealing with tax and registering a property are time-consuming while cost of access to electricity and cost of dealing with factory construction are potentially higher relative to other neighbors, except labor cost and startup cost. In addition, infrastructure in Vietnam has been up- graded considerably, but it remains at low levels of road length, ports, and several public utilities as well. Moreover, the production condition sometimes remains less stable owing to sudden blackouts in power supply, creating additional costs for electric-intensive manufacturers. The advantage of low labor costs has gradually diminished, which had driven by a slight increase in wage costs, a slower growth in labor productivity and added value so that unit labor cost is gradually rising (Table 10). Malaysia ranks first on the labor cost efficiency and they produce an additional product with 17 percent of unit labor cost. Thailand has a comparative rate of 41 percent of unit labor cost; meanwhile Vietnam has a rate of 44 percent. However, the Vietnam unit labor cost remains better than Indonesia with 53 percent and the Philippines with 65 percent.

This issue is partly driven by inadequate and unbalanced education structure, generating more workforces for service sectors, e.g. the financial sector, while production sector remains a lack of

Vietnam,

0 5 10 15 20 25 30 35 40 45 50

1995 1996 1997 1998 1999 2000 2001 2002 2003 2004 2005 2006 2007 2008 2009 2010 2011 2012 2013

Figure 10: ASEAN Gross Capital Formation (%GDP)

Indonesia Malaysia Philippines

Singapore Thailand Vietnam

East Asia & Pacific (all income levels)

(25)

25 good workforce quality. Furthermore, the status of business administration’s bureaucracy and transparency issues are partly drawbacks of the business environment in Vietnam. Furthermore, the Law application is somehow inconsistent across provinces nationwide. The law interpretation and enforcement depend too much on local agencies and lower-level local government officials.

Therefore, the status of inequality in approving and attracting FDI among localities has existed so far, causing the unequal competition between the rich and poor provinces, and advantageous regions versus disadvantageous regions.

Table 10: Vietnam and major ASEAN countries in doing business 2013

Business criteria Indonesia Malaysia Philippines Thailand Vietnam

1. Starting a business 2013 2012

-Time (days) 48 6 35 27.5 34 34

-Cost/per capita income 20.5% 7.6% 18.7% 6.7% 7.7% 8.7%

2. Obtain construction permits

-Time (days) 158 130 77 157 114 110

-Cost/per capita income 87.2% 14.7% 79.4% 8.3% 56.3% 67.3%

3. Accessing electricity

- Time (days) 101 32 42 35 115 115

- Cost/per capita income 370.6% 49.1% 118.2% 67.3% 1,726.4% 1,988%

4. Register property

- Time (days) 22 14 39 2 57 57

- Cost/per capita income 10.9% 3.3% 4.8% 6.3% 0.6% 0.6%

5. Pay tax

- Time (hours per year) 259 133 193 264 872 872

- Total tax rate (% profit) 32.2% 36.3% 44.5% 29.8% 22% 34.5%

6. Trading across borders

- Time to export (days) 17 11 15 14 21 21

- Cost to export (US$ per container)

615 450 585 595 610 610

- Time to import (days) 23 8 14 13 21 21

- Cost to import (US$ per container)

660 485 660 760 600 600

7. Minimum worker wage, US$, monthly

232.2 285.12 291.1 248.5 104.4 98

8. Ratio of minimum wage to value added per worker

0.53 0.17 0.65 0.41 0.44 0.52

Source: World Bank, Doing Business 2014 Report

Though having a majority of zero-percent tax rate in the AFTA, the Vietnam tariff system

remain less attractive compared to other countries in the region. In the short run, Vietnam is a

late member of ASEAN community, thus all types of tariffs need a longer schedule to

completely merge into the region. Table 11 shows a large amount of 42.2 percent tariff rate at 5

(26)

26 percent, while ASEAN-5 has around 17 percent on average. It is expected that Vietnam will fully adopt the AFTA tariff schedule in 2018 while ASEAN-5 may arrive earlier in 2016. Currently, if tariffs were added to production costs, it is apparently a weakness for Vietnam. But in the long run, those tariff gaps will no longer exist.

Table 11: AFTA Consolidated Tariffs 2010

Country Total tariff lines

Inclusion list (IL) General

Exception List

Sensitive/

high sensitive list Total Share of 0%

tariff in IL

Tariff rate 5%

Brunei 8,300 8,223 88% 10.9% 0.9% 0.0%

Indonesia 8,737 8,632 79.9% 19.9% 1.1% 0.1%

Malaysia 12,335 12,239 83% 16.5% 0.8% 0.0%

Philippines 8,980 8,934 82.2% 16.8% 0.3% 0.2%

Singapore 8,300 8,300 100% 0% 0.0% 0.0%

Thailand 8,300 8,300 80% 19.8% 0.0% 0.0%

Cambodia 10,689 10,537 7.2% 73.9% 0.9% 0.5%

Laos 8,300 8,214 71.1% 25.0% 1.0% 0.0%

Myanmar 8,300 8,240 60.6% 39.4% 0.6% 0.1%

Vietnam 8,300 8,099 56.5% 42.4% 1.7% 0.0%

Source: http://ASEAN.org/economic _community

Another disadvantageous point can be seen as a relative under-developed legal system and problems in applications of laws (JETRO 2014). With a score of 31.9 points, Vietnam remains less competitive than other peers in the region e.g. Thailand and Malaysia 7.1 points, and Philippines 12.2 points.

Despite those good amendments made to the Law on Investment (2005) such as improvement

and alignment of two investment laws into one investment law with no discrimination between

domestic and external firms, restrictions of the 2005 Law on Investment of Vietnam somewhat

remains less attractive relative to the regional countries, e.g. on M&A restraints, issues on JV

form, and limits of doing business scopes. In regard to the Merger & Acquisition of a domestic

SOE firm, the foreign equity purchasing ratios remain limited. Generally, a foreign investor is

entitled to buy only a maximum of 49 percent of total shares of a non-financial equitized SOE or

just 30 percent of a financial listed company. Those restrictions seem to overlook the recent

wave of merger and acquisition in FDI in the region. In regard to issues of JV form, one foreign

firm, once joined with domestic private companies, is required a special licensing procedure with

a big amount of time and a bit difficulty of procedure. Distributions rights are also restricted and

local content requirements are imposed on the products by law.

(27)

27 Besides the issue on the laws application, recent claims have been made owing to unequal development of the business investment environment and infrastructures, causing the cross- province FDI attraction bias. In geographical proximity, provinces in the East Southern Region, e.g. Binh Duong province, Dong Nai province, and Ho Chi Minh City are relatively cost- effective on time transportation and costs for doing business are about a half of that in some other provinces.

Other disadvantages e.g. tax time inspection and the lack of local supportive industries (linkages, parts suppliers) also affect FDI firms’ business and production. Those drawbacks are partly drawing down the competitiveness of Vietnam among other counterparts in the ASEAN region.

2.2 ODA inflows

2.2.1 Recent developments

In 1993, the relationships between Vietnam and bilateral donors, Vietnam and multilateral financial institutions (Asia Development Bank, International Monetary Fund, and the World Bank) were restored. Instantly, Vietnam had gained rights to access to sizeable official development aid. Gradually, international donors had increased their presence actively, helping the nation to cope with the weak institutional capacity, soft economic development, and trade expansion. Vietnam has been assisted by about 50 aid donors, consisting of 28 bilateral donors and 22 multilateral donors so far. The donors, mainly the DAC bi-laterals and large multilateral, have been evolving over years with the increased involvement of non-DAC donors associated with directing South-South pillar co-operation and trade-related support.

In the recent years, ODA inflows have been significantly large and grown over time and Viet Nam has ranked second in top five largest recipients of ODA all donors worldwide 11 . Associated with building the new necessary economic infrastructure, ODA inflows are a good capital resource of economic growth. Vietnam received an annual ODA ratio of 3 percent of GDP, an equivalence of US $3.0 - 4.0 billion to a peak of 5.3 percent of GDP in 2000, before decreasing relative to the increasing size of the economy and the regional economic condition variations.

The large volume of external capital resources not only helps Vietnam easing capital constraints and capital formation, but also gaining technological transfers by projects and knowledge transfers via technical assistance, which then better improve the country’s institutional governance and assist poverty reduction.

11 http://stats.oecd.org/

(28)

28 Regarding capital formation, ODA inflows have sustainably contributed to the country’s capital formation. The proportion of ODA in the gross capital formation is about 10 percent on average in the whole period 1995-2013. Particularly, ODA reached 17 percent of the gross capital formation in 2000. If compared with the gross capital inflows, ODA inflows share around 20 percent. It is also estimated that approximately 70 percent of the net foreign assistance would be used to invest in infrastructure. Thus ODA can directly contribute to the economic growth in the long term. If added up with other inflows sources such as foreign direct investment and overseas Vietnamese remittances, the gross amount of capital inflows would reach nearly a half of the gross capital formation or 16 percent of nominal GDP.

Figure 11: Vietnam Economic growth and ODA developments

Source: GSO, MPI statistics 2013

ODA’s capital structure has varied annually. In the 2008-2010 ODA composition, a major part disbursed ODA are project loans (40 percent), on- lending (30 percent), and budget support (30 percent) (Table 12). In Vietnam practice, a large part of ODA will be retained in the central government budget to allocate for line ministries (86 percent in 2010). At the central government level, the largest domestic aid users are Ministry of Transport (41.8 percent) and Ministry of Trade and Industry (33.9 percent). Meanwhile at the provincial level, Hanoi and Ho Chi Minh City are the largest aid receivers.

Table 12. Vietnam ODA types 2008-2010

ODA structure 2008 2009 2010

Budget support 21.1% 41.8% 25.0%

Projects,

programs 44.3% 36.2% 43.3%

On-lending 34.6% 22.0% 31.8%

Total ODA, US$ million

2,100 3,447 3,602

ODA to GDP (%)

2.1% 3.2% 3.2%

Source: PEFA 2013; GSO statistics

(29)

29 2.2.2 ODA classified by sector

Sectorial allocation of ODA in the 1995-2012 have been seen a strong focus on economic infrastructure, representing approximate two thirds of all sorts of development assistance. In which, transport and telecommunication 28.2 percent, energy and manufacturing 19.8 percent, and agriculture and rural development 15.2 percent, healthcare 4.4 percent, education 4.2 percent, environmental protection and urban development 15 percent, administrative reform and financial sector and the business environment received about 14% 12 .

Figure 12: Vietnam ODA commitment by sector 1995-2012

Source: MPI statistics

If reclassifying this allocation of the OECD Creditor Reporting System (CRS) classification, the allocation of ODA to aid for trade was considerable, accounting for about 52% on average of total sector allocable ODA to Viet Nam in 2002-2010 13 . The categorical allocation of aid for trade again confirms the strong emphasis on trade-related economic infrastructure (including transport, communications, and energy), representing about 66% of total aid for trade on average.

The final results of aid for trade are the improvement of transportation, energy supplying, and other economic infrastructures. Those positive results would assist the country to tackle difficulties and benefit more from the world trading system.

12 According to Vietnam’s Classification of aid

13 OECD 2012, Vietnam Case Study of aid for trade.

Education, 4.2%

Healthcare, 4.4%

Institutional reforms, business environment, administrative and

social supports, 14.0%

Environmental protection and urban

development, 15.0%

Agriculture, 15.2%

Transport and telecommunication,

38.2%

Economic infrastructure,

73.2%

Economic infrastructure

63.2%

(30)

30 In addition, the OECD’s CRS also indicates a slightly increasing trend in the infrastructure share from 65% in 2002 to 71 percent of the total aid in 2010, showing that the government would like to speed up the large-scale economic infrastructure. The six development banking groups are involving in this infrastructure category, i.e. the Agence Française de Développement, Asian Development Bank, JICA Japan, Eximbank Korea, KfW Germany and World Bank. They provide almost of the “hardware” support for trade-related economic infrastructure. For example, those six banks have provided about 97 percent of total aid for trade in the period 2002-10.

Another part of ODA is for building a productive capacity, which had received about 28-34 percent of total aid for trade in 2002-10. In this ODA segment, the largest items are agricultural services 35 percent, followed by banking and financial services 28 percent, and manufacturing sector 19 percent. The top five donors in this category include WB-IDA, France, Switzerland, Germany and Japan.

Moreover, the Development Strategy Institute (2011) shows that Vietnam needs about US$ 400 billion for infrastructure investment in the period 2015-2020, meaning that the country needs more resources for infrastructure development and even greater in the next ten years.

2.2.3 ODA classified by donor

A recent trend shows that DAC and multilateral donors are the main aid providers while non- DAC donors (except China) are Thailand, Kuwait and Hungary, providing basically technical assistance and small grants. For instance, in

2012 aid from DAC members accounted for 65.15 percent, multilateral institutions 34.14 percent, and the rest, private foundations and non-DAC, accounted for only 0.71 percent of total aid inflows for Vietnam 14 .

Bilaterally, top ten bilateral donors in the period 1993-2012 were Japan, Australia, Belgium, Canada, Denmark, the EU, Finland, Germany, South Korea, Switzerland and the United States. Japan is

the biggest bilateral donor in the period 1995-2012 with the accrued aid amount of US$ 18.87 billion. France ranks second with US$ 3.24 billion, Germany ranks third with US$ 2.28 billion.

14 http://webnet.oecd.org/dcdgraphs/CPA_recipient/

18.87 3.24

2.28 1.67 1.11 1.1 1.03

13.54 5.33

1.95 1.1

0 5 10 15 20

Japan France Germany Korea US Denmark UK IDA ADB UN EU

US$ billion Figure 13: Top ODA donors in Vietnam

1995-2012 (accrued, committed)

Table 1: Economic growth and social welfare gain  Year  GDP growth  (%)  GDP per  capita (US$)  Year  GDP growth (%)  GDP per  capita (US$)  1986  2.3  202  2001  6.9  416  1987  3.6  205  2002  7.1  441  1988  6.0  211  2003  7.3  492  1989  4.7  220  200
Table 5: FDI contributions to the economy
Table 6: FDI classified by local region 2013  Economic regions   Number of
Table 7: Major FDI players by country and territory    Country/ territory  Number of registered  projects  Share of  Registered  Projects (%)  Share of  Registered  Capital (%)  Share of  Exports (%)  Annual  change of  export (%)  Japan  2186  13.7  15.0
+7

参照

関連したドキュメント

Standard domino tableaux have already been considered by many authors [33], [6], [34], [8], [1], but, to the best of our knowledge, the expression of the

We show that a discrete fixed point theorem of Eilenberg is equivalent to the restriction of the contraction principle to the class of non-Archimedean bounded metric spaces.. We

Then it follows immediately from a suitable version of “Hensel’s Lemma” [cf., e.g., the argument of [4], Lemma 2.1] that S may be obtained, as the notation suggests, as the m A

Intra-host models of malaria infection describe the dynamics of the blood stages of the parasite and their interaction with host cells which are RBCs and immune effectors [32].. One

The orthogonality test using S t−1 (Table 14), M ER t−2 (Table 15), P P I t−1 (Table 16), IP I t−2 (Table 17) and all the variables (Table 18) shows that we cannot reject the

Article 58(3) of UNCLOS provides that in exercising their rights and performing their duties in the EEZ, “States shall have due regard to the rights and duties of the coastal

If a new certificate of origin was issued in accordance with Rules 3(e) of the operational procedures referred to Chapter 2 (Trade in Goods) and Chapter 3 (Rules of

With respect to each good of Chapter 50 through 63 of the Harmonized System, in the case where a material of the other Country or a third State which is a member country of the