Adaptation of Gordon Pask Learning Style Inventory into Turkish
Sayime ERBEN KEÇİCİ
Department of Educational Sciences, Faculty of Education, Necmettin Erbakan University.
Abstract: In this study, linguistic equivalency, validity and reliability studies of Gordon Pask Learning Style Inventory were carried out and the inventory was adapted into Turkish. The study was conducted on 725 students (412 female, 313 male) majoring in various departments in Faculty of Education at N.E. University. The inventory is composed of 22 items with 6 Likert type choices. Content and construct validity studies were made as a part of validation study. Expert views were taken for content validity of the learning style inventory and construct validity was determined with factor analysis. For the reliability of the inventory, Cronbach Alpha coefficient and test-retest method were used. The Cronbach Alpha coefficient of the inventory was determined to be 0.78, and test-retest reliability coefficient was determined to be 0.99. As a result of analysis, it was concluded that Gordon Pask Learning Style Inventory is a valid and reliable measurement instrument.
[Sayime ERBEN KEÇİCİ. Adaptation of Gordon Pask Learning Style Inventory into Turkish. Academ Arena 2013;5(8):49-53] (ISSN 1553-992X). http://www.sciencepub.net/academia. 8
Key words: learning style, validity, reliability, serialist-holist
1. Introduction
In recent years, the number of studies into the definition and determination of learning styles students prefer has increased (Brown, 1978, p.
307-309; Griggs & Dunn, 1984, p. 115-119). However, there are different approaches with regard to definition of learning styles. The reason for the diversity in these approaches is that they focus on different dimensions of learning (cognitive, affective and physiological).
Models developed by Kolb, McCarthy and Gregorc can be given as examples of learning style models that consider cognitive dimension. Those developed by Silver and Hanson, Dunn and Dunn, and Curry set examples for learning styles in which affective dimension is considered and examples of learning style models which emphasize physiological dimension are Silver and Hanson, Dunn and Dunn and Curry learning styles (Ekici, 2001). Felder and Silverman Learning Style was developed in 1994 with science education in mind.
When relevant literature in Turkish is reviewed, it is seen that there are many studies into Kolb’s learning styles (see Çağıltay & Tokdemir, 2004;
Hasırcı, 2006; Tuna, 2008; Çaycı & Ünal, 2007). It is also seen that Witkin’s field dependent/independent cognitive styles (see Altun, 2003; Demirkan, 2007;
Somyürek & Yalın, 2007) and Dunn and Dunn’s learning styles were also studied (Babadoğan, 2009).
The interesting point is that there is not any study into Pask’s Holist and Serialist styles in the literature in Turkish.
While Witkin studied filed dependent and field independent styles in the US, Pask studied on the same concept in the UK and called field dependent and independent cognitive styles as holist and serialist
(Ford, 2000).
Pask et al., (1972) conducted a series of experiments on the learning of academic topics by learners in various fields of study and observed that individuals employed one of the two basic approaches when learning (Ford, 2000; Ford & Chen, 2001). The individuals Pask call as holist are those who approach learning with a global approach. In the beginning of the learning process these individuals firstly try to grasp the connections between various topics and construct a large and conceptual framework in which they can later incorporate details. On the other hand, serialists who have a local learning style and tend to study one topic at a time focus on different topics separately and in sequence and then try to logically connect these topics to each other. For these people, the big picture is composed and emerges towards the end of the learning process (Ford, 2000). Individuals who Pask define to be versatile have both holist and serialist characteristics.
While serialists shuttle between theory and practice during the learning process, holists study either on theory or practice but if it is very necessary for learning, they bring theory and practice together towards the end of learning process (Ford, 2000; Ford, Chen, 2001; Ford et al., 2002). In short (Sadler-Smith
& Smith, 2004, p. 402),
Holist individual have global, top-down approach;they can do many things at the same time (simultaneous processing),
Serialists have local, bottom-up approach;
they do things in order (serial processing).
Being pathologically at the extreme points of holist and serialist styles (Entwistle, 1977, p. 233)
causes holists to make decision in a stew in case of inadequate information,
and causes serialists not to be able to have a point of view to see the whole picture.
In this framework, Gordon Pask’s learning style inventory represents a theoretical model of how learners select and mentally employ information. In this context, the aim of this study is to adapt Gordon Pask Learning Style Inventory into Turkish. It is considered that the Turkish form of the learning style inventory can be used as an effective means of data collection.
2. Methodology 2.1. The Study Group
This study was carried out on a total of 725 university students, 412 of whom are female and 313 are male, majoring in different departments of Necmettin Erbakan University. 98 of the students studied at Biology Education department, 93 studied at the department of Pre-school Education, 97 of them studied at Turkish Language and Literature Education department, 142 of the students studied at Social Sciences Education department, 88 of them were at Science Education department, 103 students attended the department of Psychological Counseling and Guidance department, 55 students were majoring in Geography Education and 49 studied at the History Education department. Out of a total of 725 students, 53 of the students who volunteered for the second administration were given the test four weeks later for test-retest reliability. Besides, for language equivalency the inventory was administrated to 58 students attending the Foreign Language Education Department.
2.2. Means of Data Collection
Learning Style Inventory was developed by Pask (1976) to determine students’ learning styles. The inventory devised to determine learning types includes a total of 22 items, 11 being in the first dimension (1.2.3.4.5.6.7.8.9.10.11) and 11 being in the second dimension (12.13.14.15.16.17.18.19.20.21.22). The inventory asks students to indicate their preferences with regard to each item on scale of six choices ranging from “Always” to “Never”. High scores on the sub-dimensions were considered to be the indicator of learning style. The consistency values for the first and second sub-dimensions were found to be 0,77 and 0,82, respectively. In the reliability study, the test-retest consistency was found to be 0,99 for both the first dimension and the second dimension.
2.3. Procedure
When translating Pask’s Learning Style Inventory into Turkish, we tried to choose the most
suitable sentence structures and to provide meaningful translations of idioms and the most suitable Turkish equivalents of culturally foreign words as much as possible. To this end, the translation process of the inventory was carried out meticulously. The inventory was independently translated into Turkish by four experts who are competent in English. After these translated forms were examined, a tentative Turkish form of the inventory was formed. Later on, three experts were asked to examine the Turkish form of the inventory in terms of cultural context, linguistic, research methodology and assessment and evaluation criteria. In line with suggestions, corrections were made and the final Turkish form of the inventory was obtained. The form was then translated back into English by two linguists and education specialists who are good at English. The Turkish translation and the English translation forms were compared by two academics at the department of Foreign Language Education. The experts stated that the translated forms reflected the same ideas as the original form. For linguistic equivalency of Pask’s Learning Style Inventory, a study group composed of 58 students at Foreign Language Education Department of Ahmet Keleşoğlu Faculty of Education in Necmettin Erbakan University, who were competent in both languages, was formed based on the academics opinions. The correlation between the scores on the English form and Turkish form of the inventory were regarded to be the indicator of linguistic equivalency. As a result of the study for linguistic equivalency of the inventory, the correlation between the English and Turkish form was found to be 0,99 for the first dimension, and for the second dimension it was determined to be 0,99.
Explanatory and confirmatory factor analyses were applied to determine the dimensions of Pask’s Learning Style Inventory. The internal consistency and test-retest reliability of the sub-dimension scores of the inventory were examined. SPSS 18.0 package software program was used.
3. Results
3.1. Validation Study
To test construct validity of the scale, Explanatory Factor Analysis and Confirmatory Factor Analysis were conducted. Data from 335 students (55% female, 45% male) were used for Explanatory Factor Analysis (EFA), and data from 390 students (54% female, 46% male) were used for Confirmatory Factor Analysis (CFA). To determine reliability of the scale, data from 725 students were used.
3.1.1. Explanatory Factor Analysis
In this study, EFA was conducted to reveal factor construct of the scale. Before EFA was conducted, the size of the sample and multivariate
normal distribution assumptions were checked. To test the size of the sample, Kaiser-Meyer-Olkin (KMO) coefficient was calculated and the KMO coefficient was found to be 0,823. It can be said that KMO values become more perfect as they get closer to 1, and are unacceptable if they are lower than 0.50 (Tavşancıl, 2005). Accordingly, the value was close to the perfect value. In the next stage, multivariate normal distribution assumption was checked. To this end, Bartlett test coefficient was calculated and it was seen that the ensuing coefficient was significant (X2= 2179,89; p < 0,01). Accordingly, it was understood that multivariate normal distribution assumption was met as well. (Çokluk, Şekercioğlu, Büyüköztürk, 2010). Later on, EFA was performed. According to EFA results, it was revealed that the 22 items were clustered under two factors with eigenvalue larger than 1.The factor loads of the items under two factors were examined, it was understood that the factor loads of items 10 and 18 were lower than 0,30, and that items 4, 9, 15 and 17 were not under the same dimension as they were in the original form of the scale. Base on expert views, these items were omitted from the scale and EFA was performed again. The 16 items obtained as a result of the repeated EFA gathered under three factors with eigenvalue larger than 1. When scree plot graphic was examined, it was understood that there was a sharp decrease after the second factor and the eigenvalues of the following factors were quite close to each other (Figure 1). In line with this result and based also on expert views, it was decided that the scale should be of two dimensions and EFA analysis was performed again with the scale having two dimensions.
Figure 1. Scree plot Graphic As a Result of Explanatory Factor Analysis
Factor number and the percentages of the variances explained by the factors are briefly presented in Table 1. Accordingly, the eigenvalue of the first factor is 4,06 and the percent of the variance it
explains is 25,38, the eigenvalue of the second factor is 3,18 and the percent of the variance it explains is 19,85. These two factors together explain 45,23% of total variance.
Table 1. The Number of Factors in the Pask Learning Style and the Percent of the Variance They Explain
Factor Eigenvalue Variance Percentage
Summated Variance Percentage
1 4,061 25,383 25,383
2 3,175 19,846 45,228
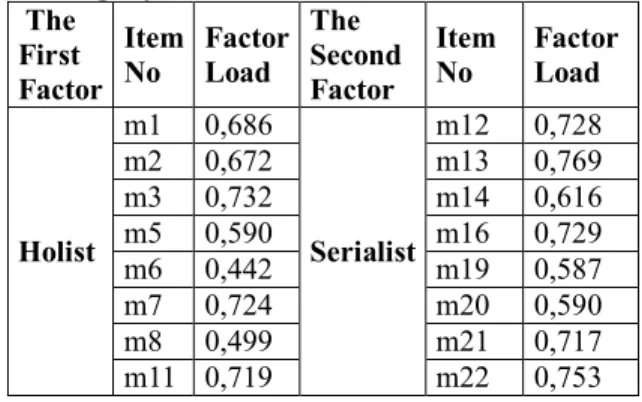
According to the result of EFA, the factor loads of the items in the scale are summarized in Table 2. While the factor load values of the items in the first factor ranged between 0,732 and 0,442, the factor load values of the items in the second factor ranged between 0,769 and 0,582. As in the original scale, the items in the first factor measure holist learning style and the items in the second factor measure serialist learning style.
Table 2. Factor Loads of the Items in the Pask Learning Style Scale
The First Factor
Item No
Factor Load
The Second Factor
Item No
Factor Load
Holist
m1 0,686
Serialist
m12 0,728
m2 0,672 m13 0,769
m3 0,732 m14 0,616
m5 0,590 m16 0,729
m6 0,442 m19 0,587
m7 0,724 m20 0,590
m8 0,499 m21 0,717
m11 0,719 m22 0,753
3.1.2. Results of Confirmatory Factor Analysis As a result of EFA, the scale turned out to have a two dimensional structure. To test this emerging construct, CFA was employed. To this end, the scale was administrated to 390 students (54% female, 46%
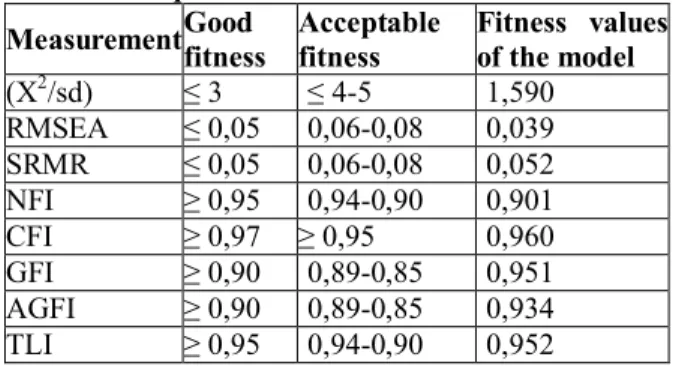
male) and the resulting data was submitted to CFA. As a result of CFA, to determine if the two-dimensional structure is compatible with data collected, the fitness indexes and Chi-square value with regard to the model were examined. Calculated modification fitness values were examined to obtain better fitness values and the correlations between the errors of some items were released (Figure 2). Modification indexes show the decrease in Chi-square value in case a constant parameter is added (released) or a new parameter is added (Sümer, 2000). The fitness values obtained for
the ultimate model are shown in Table 3.
Table 3. Statistical Values with Regard to Fitness of Structural Equation Model
Measurement Good fitness
Acceptable fitness
Fitness values of the model
(X2/sd) ≤ 3 ≤ 4-5 1,590
RMSEA ≤ 0,05 0,06-0,08 0,039
SRMR ≤ 0,05 0,06-0,08 0,052
NFI ≥ 0,95 0,94-0,90 0,901
CFI ≥ 0,97 ≥ 0,95 0,960
GFI ≥ 0,90 0,89-0,85 0,951
AGFI ≥ 0,90 0,89-0,85 0,934
TLI ≥ 0,95 0,94-0,90 0,952
According to Table 3, it is seen that the model with two factors has satisfactorily good fitness values (Meydan and Şeşen, 2011). The tested two factor model is shown in Figure 2. It is seen that factor loads of the items in the holist dimension of the model ranged between 0,38 and 0,68; the factor loads of the items in serialist dimension ranged between 0,47 and 0,70. The all ways in the model were found to be significant at 0,001 level.
Figure 2. CFA results with regard to the Two Factorial Model n= 390, X2 = 159,046; sd=100 ; p<
0,001
3.2. Reliability Study
Data from 725 students were used for the calculation of the scale’s reliability. The Cronbach Alpha reliability coefficients calculated for the whole scale, holist and serialist dimensions, were found to be 0.78, 0,77 and 0,82, respectively. Accordingly, it can be argued that the reliability of the scale is at acceptable level (Tavşancıl, 2005).
Besides, the reliability of the scale was also examined with test-retest method. To this end, the
scale was administrated to 48 students with a 4-week interval and the correlation between the two administrations was calculated. Concordantly, each of the correlation coefficient calculated for the total score, scores from the first and second dimensions was fond to be 0,99. Accordingly, the reliability coefficient obtained with test-retest method can be said to be quite high.
4. Conclusion and Suggestions
This study aims to adapt Learning Style Inventory developed by Pask (1976) into Turkish. In the translation of the inventory into Turkish, experts who are competent in both English and German were included in the study. After the translation process, linguistic equivalency study for the Learning Style Inventory was performed and it was seen that the correlations was 0,96 for the 1st dimension and 0,95 for the 2nd dimension. These results indicate that the relation between German and Turkish forms of the inventory is at quite a good level and the Turkish translation of the items of the inventory comply quite well with original items in German.
As in the adaptation studies of other scales carried out in Turkey (see Dağhan & Akkkoyunlu, 2011; Büyüköztürk et.al., 2004; Doğan & Çermik, 2012), some items were omitted from the scale because of cultural differences. The scale is composed of two dimensions as “holist” and serialist”. The scale includes a total of 22 items, 11 being in the holist dimension and 11 being in the serialist dimension. As a result of factor analysis, all items in the original form of the scale were included in the scale; however, item 10 and 18 were omitted as their factor loads are lower than 0,30 and item 4, 9, 15, and 17 were excluded as they were not in the same dimension as in the original form scale. The two factorial structure was considered and in the analyses, the scale was limited with two basic factors to conform with the original form of the scale. The scale explains 45.23% of the total variance.
These changes might be stemming from social, economic, cultural and geographical differences between the two countries. This point of view can pave the way for further studies.
To ensure the reliability of Pask’s learning style inventory Cronbach alpha internal consistency and test-retest reliability coefficients were calculated.
The Cronbach alpha internal consistency coefficient of the inventory was found to be 0.78, 0.77 and 0.82, which indicates that the items in the inventory are consistent with each other, that is the reliability of the scale is at satisfactory level. As a result of test-retest reliability study conducted with a four-week interval, the test-retest reliability of the inventory was found to be 0.99, which indicates that the scale had quite good values in terms of test-retest reliability.
As a result, Pask Learning Style Inventory was adapted into Turkish, linguistic equivalency study was made and some evidences indicating that the inventory is valid and reliable means of measurement to determine learning styles of university student were obtained.
In line with the findings obtained in this study, the following suggestions can be made for further studies: it is considered that the scale will contribute to researchers concerned with the concept of learning style; simultaneous fitness validity of Pask Learning Style Inventory with another learning style inventory can be examined.
Correspondence to:
Sayime ERBEN KEÇİCİ
Necmettin Erbakan University Faculty of Education Department of Educational Science
Konya 42090, Turkey Telephone: 0090-507-2532210
Cellular phone: 0090-332-3238220-5905 Emails: [email protected] References
1. Altun, A. (2003). Ögretmen adaylarının bilişsel stilleri ile bilgisayara yönelik tutumları arasındaki ilişkinin incelenmesi. The Turkish Online Journal of Educational Technology – TOJET, 2 (1).
2. Babadoğan, C. (2009). Learning preferences of english teacher certificates program student‘s. Elemantary Education Online, 8 (2), 520 – 533.
http://ilkogretim-online.org.tr/vol8say2/v8s2m21.doc 3. Brown, D. (1978). The Effects of Congruency Between
Learning Styles and Teaching Styles on Collage Student Achievement. College Student Journal, 12, 307-309.
4. Çağıltay, N. E. & Tokdemir, G. (2004). Mühendislik eğitiminde öğrenme stillerinin rolü. 1. Ulusal Mühendislik Kongresi. Mayıs 2004, İzmir.
5. Çaycı, B. & Ünal, E. (2007). Sınıf öğretmeni adaylarının sahip oldukları öğrenme stillerinin çeĢitli değiĢkenlere göre incelenmesi. Bilim, Eğitim ve Düşünce Dergisi, 7 (3), 142- 151.
6. Çokluk, Ö., Şekercioğlu, G. & Büyüköztürk, Ş. (2010), Sosyal Bilimler için Çok Değişkenli İstatistik. Ankara:
Pegem Akademi.
7. Demirkan, Ö. (2007). Bağlaşık öğretimde bağlam çokluğu ve bilişsel stilin öğrencilerin transfer ve bağlamsızlaştırma becerilerine etkisi. Eğitim Bilimleri ve Uygulama, 12.
8. Doğan, B. & Çermik, H. (2012). Nasıl Öğreniyorum Envanterinin Türkçeye Uyarlanması: Geçerlilik ve Güvenirlik Çalışması. H. U. Journal of Education, 43, 154-163.
9. Ekici, G. (2001). Öğrenme Stiline Dayalı Biyoloji Öğretiminin Analizi, Doktora Tezi, Gazi Üniversitesi Eğitim Bilimleri Enstitüsü.
10. Entwistle, N. J. & Wilson, J. D. (1977). Degress of exellence: the academic achievement game. Londres:
Hodder and Stoughton.
11. Ford, N. (2000). Cognitive style and virtual environments. Journal of the American Society for Information Science, 51 (6), 543-557.
12. Ford, N. ve Chen, S. (2000). Individual Differences, hypermedia navigation, and learning: An empirical study. Journal of Educational Multimedia and Hypermedia, 9 (4), 281-311.
13. Ford, N. et. al. (2002). İnformation seeking and mediated searching. Part 4. Cognitive styles in information seeking. Journal of the American Society for Information Science and Technology, 53 (9), 136- 147.
14. Griggs. S.A. & Dunn, R.S. (1984). Selected Case Studies of the Learning Style Preferences of Gifted Students. Gifted Child Quarterly, 28 (3), 115-119.
15. Hasırcı, Ö. K. (2006). Sınıf öğretmenliği öğrencilerinin öğrenme stilleri: Çukurova üniversitesi örneği.
Eğitimde Kuram ve Uygulama, 2 (1), 15-25.
16. Sadler-Smith, E. & Smith, P. J. (2004). Strategies for accommodating ındividuals‘ styles and preferences ın flexible learning programmes. British Journal of Educational Technology, 35 (4), 395-412.
17. Somyürek, S. & Yalın, H. Ġ. (2007). Bilgisayar destekli eğitim yazılımlarında kullanılan ön örgütleyicilerin alan bağımlı ve alan bağımsız öğrencilerin akademik baĢarılarına etkisi. Türk Eğitim Bilimleri Dergisi, 5 (4), 587 – 607.
18. Sümer, N. (2000). Yapısal eşitlik modelleri: Temel kavramlar ve örnek uygulamalar. Türk Psikoloji Yazıları, 3(6), 49-74.
19. Tavşancıl, E. (2005). Tutumların ölçülmesi ve SPSS ile veri analizi. Ankara: Nobel Yayın Dağıtım.
7/30/2013