Explaining Foreign Holdings of Asia's Debt Securities: The Feldstein‑Horioka Paradox Revisited
著者(英) Charles Yuji Horioka, Akiko Terada‑Hagiwara, Takaaki Nomoto
journal or
publication title
AGI Working Paper Series
volume 2015‑16
page range 1‑34
year 2015‑11
URL http://id.nii.ac.jp/1270/00000081/
Creative Commons : 表示 ‑ 非営利 ‑ 改変禁止 http://creativecommons.org/licenses/by‑nc‑nd/3.0/deed.ja
Explaining Foreign Holdings of Asia's Debt Securities:
The Feldstein-Horioka Paradox Revisited
Charles Yuji Horioka
Asian Growth Research Institute;
National Bureau of Economic Research;
and
Institute of Social and Economic Research, Osaka University
Akiko Terada-Hagiwara
Economic Research and Regional Cooperation Department, Asian Development Bank
Takaaki Nomoto
Cabinet Secretariat, Government of Japan
Working Paper Series Vol. 2015-16 November 2015
The views expressed in this publication are those of the author(s) and do not necessarily reflect those of the Institute.
No part of this article may be used reproduced in any manner whatsoever without written permission except in the case of brief quotations embodied in articles and reviews. For information, please write to the Institute.
Asian Growth Research Institute
1
EXPLAINING FOREIGN HOLDINGS OF ASIA’S DEBT SECURITIES:
THE FELDSTEIN-HORIOKA PARADOX REVISITED*
Charles Yuji Horioka**
Asian Growth Research Institute; National Bureau of Economic Research; and Institute of Social and Economic Research, Osaka University
Akiko Terada-Hagiwara
Economic Research and Regional Cooperation Department, Asian Development Bank
Takaaki Nomoto
Cabinet Secretariat, Government of Japan November 18, 2015
Abstract: In this paper, we find that home bias is still present in all economies and regions, especially in the case of short-term debt securities, but that there are substantial variations among economies and regions in the strength of home bias, with the Eurozone economies, the US, and developing Asia showing relatively weak home bias and advanced Asia, especially Japan, showing relatively strong home bias. We then examine trends over time in foreign holdings of debt securities and find that capital has been flowing from the US and the Eurozone economies to both advanced Asia (especially Japan) and developing Asia and that foreign holdings of debt securities have been increasing in advanced as well as developing Asia but for different reasons. The main reason in the case of advanced Asia (especially Japan) appears to be higher risk-adjusted returns, whereas the main reason in the case of developing Asia appears to be the growth of debt securities markets combined with relatively weak home bias and (in the case of short-term securities) lower exchange rate volatility. Finally, we find that since the Global Financial Crisis, foreign holdings of debt securities have declined (i.e., that home bias has strengthened) in all economies and regions except developing Asia, where they have increased (except for a temporary decline in 2008) but where their share is still much lower than the optimal share warranted by the capital asset pricing market model.
Key words: Capital asset pricing model, cross-border portfolio investments, debt securities, Feldstein-Horioka paradox, Feldstein-Horioka puzzle, foreign debt holdings, Global Financial Crisis, government bonds, government securities, home bias, international capital flows, international capital mobility, international capital movements, safe haven, short-term capital movements, advanced Asia, developed Asia, developing Asia, non-Japan Asia, Eurozone, Japan
Journal of Economic Literature classification codes: F21, F32, F34, F65, G01, G15, O53
*The authors are indebted to Maria Socorro Bautista, Hal Hill, Masahiro Kawai, Thiam Hee Ng, Changyong Rhee, T. N. Srinivasan, other participants of the Asian Development Review Conference on Development Issues in Asia, held at the Asian Development Bank, and especially Joseph Lim, Peter Morgan, Yoko Niimi, Eric Ramstetter, and two anonymous referees for their valuable comments. Finally, Junray Bautista provided superb assistance. This work was supported by JSPS (Japan Society for the Promotion of Science) KAKENHI Grant Number 15H01950, an Asian Growth Research Institute project grant, and a grant from the MEXT Joint Usage/Research Center for Behavioral Economics, Institute of Social and Economic Research, Osaka University. Any remaining errors are the authors’.
**Corresponding author: Charles Yuji Horioka, Asian Growth Research Institute, 11-4, Ohtemachi, Kokurakita-ku, Kitakyushu, Fukuoka 803-0814, JAPAN.
E-mail: [email protected]. Telephone: +81-93-583-6202. Facsimile: +81-93-583-4602.
2 1. INTRODUCTION
In its simplest form, the international capital asset pricing model (CAPM) predicts that, if capital is perfectly mobile internationally, investors in all countries will hold the same portfolio—the world market portfolio—in which each country’s share equals its share of worldwide market capitalization. However, as Feldstein and Horioka (1980) and the subsequent literature have shown,1 investors exhibit a strong tendency toward
“home bias,” preferring to invest their wealth in domestic assets for a variety reasons including a desire to avoid foreign exchange risk, an asymmetry in the availability of information about domestic and foreign assets, and legal and institutional barriers to international capital flows.2
Nonetheless, investors do invest at least some of their assets abroad, and cross-border portfolio investments (especially those in foreign debt securities) have increased sharply in recent years in most Asian economies. Thus, this paper contributes to the literature by analyzing data on trends in foreign holdings of debt securities since 2000 with emphasis on Japan and non-Japan Asia and by conducting an econometric analysis of the determinants of foreign holdings of debt securities with a focus on differences between the pre- and post-Global Financial Crisis (GFC) periods and on the Asian economies.
To preview our main findings, we test for the existence and strength of home bias and find that it is still present in all economies and regions, especially in the case of short-term debt securities, which suggests that the Feldstein and Horioka (1980) paradox is still very much alive and well. However, we also find that there are substantial variations among economies and regions in the strength of home bias, with the Eurozone economies, the US, and developing Asia showing relatively weak home bias and advanced Asia, especially Japan, showing relatively strong home bias. We then examine trends over time in foreign holdings of debt securities and find that capital has
1See Obstfeld and Rogoff (2001) and Apergis and Tsoumas (2009) for surveys of this literature and Kim, et al. (2007 and 2014) for applications to East Asia.
2 As noted by Ford (2015), however, the Feldstein and Horioka (1980) findings could be due to frictions in the transfer of goods and services among countries arising from such things as transport, marketing, and distribution costs, technical standards, certification procedures, trade barriers, etc.
3
been flowing from the US and the Eurozone economies to both advanced Asia (especially Japan) and developing Asia and that foreign holdings of debt securities have been increasing in advanced as well as developing Asia but for different reasons. The main reason in the case of advanced Asia (especially Japan) appears to be higher risk- adjusted returns, whereas the main reason in the case of developing Asia appears to be the growth of debt securities markets combined with relatively weak home bias and (in the case of short-term securities) lower exchange rate volatility. Looking finally at the impact of the GFC, we find that, since the GFC, foreign holdings of debt securities have declined (i.e., that home bias has strengthened) in all economies and regions except developing Asia, where they have increased (except for a temporary decline in 2008) but where their share is still much lower than the optimal share warranted by the CAPM model.
The remainder of this paper is organized as follows. In section 2, we discuss trends in foreign debt holdings in Asia during the 2000–11 period. In section 3, we explore possible reasons for the sharp increase in foreign holdings of short-term Japanese government securities and of the debt securities of non-Japan Asia during the 2005-12 period. In section 4, we conduct an econometric analysis of the determinants of foreign holdings of debt securities using data on 11 economies and regions for the 2001-11 period. Finally, in section 5, we summarize our findings and explore the policy implications of our findings for both Japan and non-Japan Asia.
2. TRENDS IN FOREIGN DEBT HOLDINGS IN JAPAN AND NON-JAPAN ASIA
In this section, we discuss trends in foreign debt holdings in Japan and non-Japan Asia during the 2000-11 period.
2.1. Trends in Foreign Holdings of Japanese Government Securities
4
In this subsection, we discuss trends in foreign holdings of Japanese government securities, which comprise the lion’s share of debt securities in Japan, during the 2000–
11 period (see Horioka, Nomoto, and Terada-Hagiwara, 2014a, 2014b, for a more detailed discussion of these data). Figure 1 shows trends in foreign holdings of Japanese government securities during the 2000–11 period for both short-term and medium-/long-term securities, and as can be seen from this figure, the share of foreign holdings of Japanese government securities has been low until recently in the case of both short-term and medium-/long-term government securities, with the share of foreign holdings of short-term government securities ranging from 2.4%–7.3% and that of medium-/long-term government securities ranging from 2.7%–6.7% between March 2000 and September 2007.
However, the two shares diverged greatly thereafter: The share of foreign holdings of short-term government securities increased sharply to 14.8% in June 2008 before falling to 10.1% in December 2008 and increasing anew to 17.0% in March 2011 before leveling off. Meanwhile, the share of foreign holdings of medium-/long-term government securities remained low throughout the period under review, only increasing to a high of 7.8% in September 2008 before falling to 4.6% in March 2010 and increasing anew to 6.3% in September 2011.
Thus, the share of foreign holdings of government securities increased in the case of both short-term and medium-/long-term government securities but increased much more sharply and was often more than twice as high in the case of short-term government securities. This suggests that the growth in the appetite of foreign investors for Japanese government securities was much greater in the case of short-term securities, which in turn suggests that foreign investors regarded Japan as a safe haven for their assets in the short-run but not in the medium- or long-run, and this in turn suggests that foreigners regarded Japanese government securities as only a temporary or short-term repository for their funds.3
3 The growing preference of foreign investors for short-term Japanese government securities may have been due in part to the low yields on Japanese government securities and the desire of foreign investors to avoid large losses if yields were to rise in the future. We are indebted to Thiam Hee Ng for this point.
5
Despite the increase in foreign holdings of Japanese government securities, the share of foreign holdings of government securities is still much lower in Japan than in both the other industrialized economies and the developing Asian economies, as the data presented in Horioka, Nomoto, and Terada-Hagiwara (2014a, 2014b) indicate. This suggests that foreign investors are less willing to invest in Japanese government securities than they are to invest in the government securities of other economies.
2.2. Trends in Foreign Holdings of Non-Japan Asia’s Debt Securities
In this subsection, we summarize trends in foreign debt holdings, which consist primarily of foreign holdings of government securities, in non-Japan Asia during the 2000-11 period to highlight the similarities and differences vis-à-vis Japan (see Horioka, Nomoto, and Terada-Hagiwara, 2014a, for more details). Foreign holdings of the debt securities of non-Japan Asia increased from 2001 until 2007, declined in 2008, and increased anew in 2009–10 to attain all-time highs in 2010. These trends are similar to those in foreign holdings of short-term government securities in Japan, at least after 2007, with sharp increases in foreign debt holdings after 2007 in Japan as well as in non-Japan Asia except in 2008.
Turning to the share of short-term foreign debt in total foreign debt, this share is higher in Asia than elsewhere (with the exception of the US), and within Asia, is relatively high in the People’s Republic of China (hereafter PRC), (in earlier years) India, and (in later years) Japan and relatively low in the ASEAN-4 economies4 plus Vietnam and in the newly industrialized economies (NIES).5 As for trends over time in the share of short-term foreign debt in total foreign debt, it has been increasing sharply in the PRC and Japan and declining in South Asia and (at least since 2007) in ASEAN-4 plus Vietnam and the NIES.
Thus, capital is fleeing from the US and Eurozone economies (especially the latter, presumably due to the Eurozone crisis) not only to Japan but also to other Asian
4 Association of Southeast Asian Nations (ASEAN)-4 refers to Indonesia, Malaysia, the Philippines, and Thailand.
5 The NIES comprise Hong Kong, the Republic of Korea, Singapore, and Taipei,China.
6
economies, due in large part to the development of debt securities markets in non-Japan Asia, with short-term capital fleeing primarily to the PRC, Japan, and South Asia and long-term capital fleeing primarily to the ASEAN-4 economies, Vietnam, and the NIES.
It thus appears that the destination of capital flight depends on the investors’ motivation, with those seeking a temporary safe haven choosing the PRC, Japan, and South Asia, which presumably provide good short-term risk-adjusted yields, and those seeking a long-term home for their funds choosing the ASEAN-4 economies, Vietnam, and the NIES, all of which have good long-term growth and currency appreciation prospects (Rodrik and Velasco, 1999).6 Our assertion is corroborated in the case of the Republic of Korea (hereafter Korea) by Cho (2011), who finds that foreign investors have increased their net purchases of medium-/long-term Korean government securities since the GFC due to (i) favorable growth prospects and sound economic indicators (e.g., a current account surplus and fiscal soundness) in Korea, (ii) expectations of the Korean won’s appreciation, and (iii) the desire of the central banks of the PRC and other Asian economies to diversify their foreign reserve investments.
However, the unusually high share of short-term foreign debt in total foreign debt in the PRC was due in large part to PRC government regulations that prohibited offshore foreign banks from purchasing long-term PRC government securities until August 2010.
Thus, at least until 2010, the fact that the share of short-term foreign debt in total foreign debt was high in the PRC does not necessarily indicate that foreign investors regarded the PRC as a temporary safe haven for their funds. Moreover, the People Bank of China’s (PBOC) circular of 20 August 2010 allowed only offshore central banks and other eligible financial institutions to purchase long-term PRC government securities, and since the decision-making calculus of central banks is likely to be very different from that of other financial institutions, we need to be cautious about interpreting the motivation behind foreigners’ purchases of PRC debt after 2010 as well.
6 Some investors invest in “safe havens,” which are economies offering stable risk-adjusted returns, as a temporary (short-term) repository for their liquid assets in response to increased political and/or economic instability abroad, while other investors invest in economies with strong growth prospects and/or strong prospects for currency appreciation as a long-term investment (Isard and Stekler, 1985; Dornbusch, 1986; Habib and Stracca, 2011).
7
3. REASONS FOR THE SHARP INCREASE IN FOREIGN HOLDINGS OF SHORT-TERM JAPANESE GOVERNMENT SECURITIES AND THE DEBT SECURITIES OF NON-JAPAN ASIA
We saw in the previous section that foreign holdings of short-term Japanese government securities have shown an upward trend, especially after 2007, and that foreign holdings of the debt securities of non-Japan Asia have also been increasing in recent years (except in 2008). In this section, we explore possible reasons for the recent increase in foreign holdings of short-term Japanese government securities and of the debt securities of non-Japan Asia using data for the 2005-12 period.
3.1. Relative Yields
One possible reason for the increase in foreign holdings of short-term Japanese government securities and of the debt securities of developing Asia is that their yields increased relative to the yields on the debt securities of other economies and regions.
Figure 2 shows trends in hedged returns on one-year government bonds in US dollars in six selected economies and regions (the US, the Eurozone, the PRC, India, Japan, and Korea) during the 2005–12 period. As can be seen from this figure, yields on Japanese debt securities were the lowest among the six economies and regions throughout this period and were far lower than elsewhere. However, yields elsewhere fell sharply in 2008–09 due to monetary easing in response to the GFC, and this in turn caused the yield gap between Japan and elsewhere to narrow sharply; that is, it caused yields in Japan to become much more attractive relative to those elsewhere. (Note, however, that even though the yield gap narrowed significantly, yields remain somewhat lower in Japan than elsewhere.) To put the argument in different terms, the wide yield gap between Japan and elsewhere until 2007 led to extensive yen carry trades, wherein investors borrowed from Japanese banks at low rates, converted their funds into US dollars, for example, and purchased higher-yielding US government securities. However, the incentive to do so diminished after 2007 as the yield gap narrowed, leading investors
8
to invest in Japanese government securities instead.7 Thus, the sharp narrowing of the yield gap between Japan and elsewhere can help explain why holdings of short-term Japanese government securities increased so sharply after 2007.
As for the impact of trends in relative yields on trends in foreign holdings of the debt securities of the PRC, India, and Korea, the upward trend in yields in these economies before 2007 and after 2009 (except in Korea after 2009) and the sharp decline in yields in these economies in 2008 can help explain the upward trend in foreign holdings of the debt securities of these economies as well as the temporary decline in 2008.
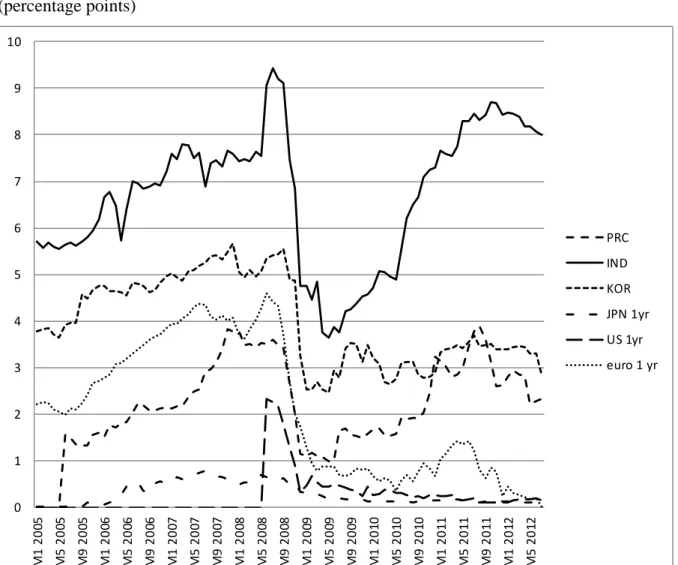
3.2. Relative Risks
Another possible reason for the increase in foreign holdings of short-term Japanese government securities and of the debt securities of non-Japan Asia are changes in risk levels in different economies and regions. Figure 3 shows trends in the rolling average of the standard deviation of hedged returns on one-year government bonds in US dollars in the same six economies and regions during the 2005–12 period. As can be seen from this figure, the risk gap between Japan and elsewhere was relatively narrow until late 2008, even though risk levels were somewhat lower in Japan than elsewhere. However, the risk gap widened dramatically from late 2008 until early 2010 not because risk levels in Japan changed but because risk levels elsewhere increased sharply due to the advent of the Eurozone crisis. Thus, the sharp widening of the risk gap between Japan and elsewhere—the fact that Japanese debt securities became much safer than those of other economies—can help explain why foreign holdings of short-term Japanese government securities increased so sharply after 2007. In other words, foreign investors temporarily shifted their assets into short-term Japanese government securities following the GFC partly because of their perception of Japan as a safe haven and their perception of Japanese short-term government securities as a relatively safe asset.
As for the impact of trends in risk levels on trends in foreign holdings of the debt securities of PRC, India, and Korea, the fact that risk levels in these economies
7 We are indebted to Joseph Lim for this interpretation.
9
increased more sharply than in the US, the Eurozone, and Japan in 2008–09 can explain why foreign holdings of the debt securities of these economies fell sharply in 2008, and the fact that risk levels in these economies declined sharply in 2009 can explain why foreign holdings of the debt securities of these economies recovered in 2009, but trends in risk levels cannot explain the increase in foreign holdings of the debt securities of these economies in other years because foreign holdings of the debt securities of these economies increased despite an increase in risk levels in these economies. Moreover, it appears that these economies did not function as a safe haven at the time of the GFC since risk levels increased more sharply in these economies than elsewhere.
3.3. The Combined Impact of the Two Factors
Figure 4 shows trends in risk-adjusted hedged returns on one-year government bonds in US dollars in the same six economies and regions during the 2005–12 period.
This variable shows the combined impact of yields and risk levels. As can be seen from this figure, risk-adjusted hedged returns on one-year government bonds in US dollars were much lower in Japan than elsewhere until 2007, but risk-adjusted hedged returns elsewhere converged to Japanese levels in 2008–09 and remained below Japanese levels thereafter in some cases.
Thus, the two factors (yields and risk levels) in combination can explain why foreign holdings of short-term Japanese government securities increased so sharply after 2007, inducing foreign investors to at least temporarily shift their portfolios from non- Japanese (Eurozone) government securities to Japanese government securities. This suggests that conventional economic factors (risks and returns) can explain the behavior of foreign investors without having to resort to non-economic explanations.
However, the sharp increase in foreign holdings of short-term Japanese government securities was largely attributable to central banks, especially the PBOC, and central banks may have very different motivations from those of private investors. For example, these central banks wanted to diversify away from US government securities for various reasons and chose to shift into short-term Japanese government securities since they are
10
more liquid than longer-term securities and hence more suitable for holding as foreign exchange reserves.
Unfortunately, a breakdown of foreign holdings of Japanese government securities by type of holder is not available and hence we cannot ascertain the importance of this central bank hypothesis directly. However, a breakdown of foreign holdings of Japanese government securities by economy and region is available, and in the case of short-term debt, Europe (excluding the UK) was the largest foreign holder of short-term Japanese debt in 2003–04 and 2007–09, while international institutions were the largest foreign holder of Japanese debt in the intervening years of 2005–06 and again in 2010–12. Thus, the PRC has not held a dominant share of short-term Japanese debt until recently, suggesting that the central bank hypothesis has not been of dominant importance, at least until recently.
As for the impact of trends in risk-adjusted hedged returns on trends in foreign holdings of debt securities in the PRC, India, and Korea, trends in risk-adjusted hedged returns cannot explain trends in foreign holdings of debt securities in these economies until 2007. However, the downward trend in risk-adjusted hedged returns in 2008 and the subsequent upward trend therein in these economies can explain the decline in foreign holdings of the debt securities of these economies in 2008 and the subsequent recovery thereof. This suggests that conventional economic factors (risks and returns) can at least partly explain the behavior of foreign investors in the case of these economies as well.
4. AN ECONOMETRIC ANALYSIS OF THE DETERMINANTS OF FOREIGN HOLDINGS OF DEBT SECURITIES
In this section, we present data on an index that measures the extent of home bias and then conduct an econometric analysis of the determinants of foreign holdings of debt securities using this index and data on 11 economies and regions for the 2001-11 period.
11 4.1. Deviations from the CAPM and Home Bias
Solnik (1974) and Sercu (1980) show that in a fully integrated world in which purchasing power parity (PPP) holds, the international version of the CAPM of Sharpe (1964) and Lintner (1965) will also hold and that, in equilibrium, investors in all countries will hold the world market portfolio, with each country’s portfolio share being equal to its share of worldwide market capitalization. This is because the CAPM assumes that all investors have identical expectations regarding the mean and variance of future returns on all securities and apply the same portfolio optimization procedure.
Thus, for example, as the US stock market accounts for about 45% of worldwide stock market capitalization, the CAPM predicts that all investors will invest about 45% of their equity wealth in the US stock market.
If the CAPM holds, the surge in foreign holdings of short-term Asian debt securities at the time of the GFC is not necessarily surprising since debt securities markets in Asia deepened significantly during the same period and foreign holdings of debt securities should have increased commensurately with the increase in market capitalization.
However, the evidence presented by French and Poterba (1991) shows that the share of their portfolios that investors invest in foreign securities is much too low compared to simple benchmarks derived from the CAPM and hence that the CAPM does not hold, and the fact that non-US investors invest only 8% of their equity wealth in the US points toward the same conclusion.
In this section, we conduct an econometric analysis of foreign holdings of debt securities using 𝐼𝐼𝑖𝑖,𝑡𝑡, the “home bias index” or the “foreign asset acceptance rate,” which measures the extent to which the share of a given country’s assets in the portfolios of foreign investors diverges from the share of that country’s assets that would be held in a
“borderless” global portfolio (i.e., the optimal portfolio warranted by the CAPM). This index is defined by the International Monetary Fund (2005) as follows:
12 𝐼𝐼𝑖𝑖,𝑡𝑡 =
𝐷𝐷𝐷𝐷𝑖𝑖,𝑡𝑡
𝑊𝑊𝐷𝐷𝑊𝑊𝑊𝑊𝑡𝑡− 𝐷𝐷𝐷𝐷𝑊𝑊𝑊𝑊𝑖𝑖,𝑡𝑡 𝐷𝐷𝐷𝐷𝑊𝑊𝑊𝑊𝑖𝑖,𝑡𝑡 𝑊𝑊𝐷𝐷𝑊𝑊𝑊𝑊𝑖𝑖,𝑡𝑡
where 𝐷𝐷𝐷𝐷𝑖𝑖,𝑡𝑡 measures country i’s domestic debt securities held by foreign investors, 𝑊𝑊𝐷𝐷𝑊𝑊𝑊𝑊𝑡𝑡 measures the worldwide market capitalization of debt securities, and 𝐷𝐷𝐷𝐷𝑊𝑊𝑊𝑊𝑖𝑖,𝑡𝑡 measures the market capitalization of country i’s domestic debt securities. Eleven economies are included in the sample: four developing Asian economies (Indonesia, Malaysia, the Philippines, and Thailand), four advanced Asian economies (Hong Kong, Japan, Korea, and Singapore), and three major industrialized non-Asian economies (the Eurozone, the UK, and the US). t spans from 2001 until 2011.
If there is no home bias, the index 𝐼𝐼𝑖𝑖,𝑡𝑡 should equal unity. However, if foreign investors exhibit home bias for various reasons, foreign holdings of country i’s assets will tend to be smaller than what the relative domestic market size of that country implies, leading 𝐼𝐼𝑖𝑖,𝑡𝑡 to be less than unity.
We computed the home bias index for the eleven economies in our sample, and found, in general, that this index is less than unity, suggesting the presence of home bias (see Horioka, Nomoto, and Terada-Hagiwara, 2014a, for more details). Among the economies in our sample, the Eurozone economies show the highest value of the home bias index, implying that the share of foreign holdings in these economies is close to 80% of the optimal share and that home bias is weakest in these economies. Since the GFC, however, foreign holdings of total Eurozone debt securities have been declining steadily and the downward trend became evident with respect to short-term debt securities as well in 2009.
The US shows the second highest value of the home bias index (i.e., the second lowest degree of home bias) among the economies in our sample, but its value is far lower than it is in the Eurozone economies, implying that the share of foreign holdings in the US is only 30% of the optimal share. However, unlike in the Eurozone economies, the US did not show a decline in foreign holdings of total debt securities during the
13
post-GFC period although it did show a moderate decline in foreign holdings of short- term debt securities.
The home bias index is low (i.e., home bias is strong), in general, in Asia, but when one conducts a comparison within Asia, foreign investors underinvest the most in the debt securities of Japan and Thailand (except in the case of short-term debt securities).
Foreign investors also underinvest in the debt securities of Korea, but foreign holdings of Korean debt securities have been increasing steadily since 2007. In many Asian economies including Malaysia, the Philippines, Indonesia, Hong Kong, Singapore, and Thailand, the home bias index showed an upward trend (i.e., home bias weakened) throughout most of the sample period but showed a sharp decline (i.e., home bias strengthened sharply) at the time of the GFC before rebounding.
The low level of the home bias index (i.e., the strength of home bias) in the Asian economies across the board is presumably due in large part to the fact that investors do not have full access to information about investment opportunities in Asia and/or to the fact that the cost of obtaining this information is high, and the considerable inter- country variation in the home bias index presumably reflects in large part inter-country differences in the availability of information about investment opportunities and the cost of obtaining this information. For example, information gathering costs are presumably particularly high in economies such as the PRC, Malaysia, and Singapore where governments and/or central banks are often highly secretive and deliberately restrict access to key economic information relating to investment opportunities, but data on the home bias index are not available in the case of the PRC and home bias is not unusually strong in Malaysia and Singapore for some reason.
4.2. Econometric Model
As shown in section 2, foreign holdings of Asian debt securities have been increasing in recent years, and during the post-GFC period of 2009–11, foreign holdings of short- term debt securities showed volatile movements, with a sharp drop followed by a renewed surge in some developing Asian economies.
14
The objective of our econometric analysis is to examine whether or not these trends in foreign holdings of debt securities can be explained by changes in home bias during the GFC period or by other factors such as the return chasing motive, as discussed in the previous section. The specification follows a simplified version of a portfolio selection model with standard mean-variance such as those of Adler and Dumas (1983), Cooper and Kaplanis (1994), and Fidora, et al. (2006), where PPP can be violated. In such a model, deviations from optimal portfolio weights (portfolio bias) can be explained by exchange rate volatility. The deviation from the optimal portfolio weight (home bias) can be measured as 𝑙𝑙𝑙𝑙 �𝑊𝑊𝐷𝐷𝑊𝑊𝑊𝑊𝐷𝐷𝐷𝐷𝑖𝑖,𝑡𝑡
𝑡𝑡−𝐷𝐷𝐷𝐷𝑊𝑊𝑊𝑊𝑖𝑖,𝑡𝑡� − 𝑙𝑙𝑙𝑙 �𝑊𝑊𝐷𝐷𝑊𝑊𝑊𝑊𝐷𝐷𝐷𝐷𝑊𝑊𝑊𝑊𝑖𝑖,𝑡𝑡
𝑖𝑖,𝑡𝑡�, which is simply the natural
logarithm of the home bias index defined earlier, and increases with real exchange rate volatility, which measures the degree to which relative PPP is violated. Any deviation of the exchange rate from PPP drives a wedge between real returns on domestic and foreign investment under the assumption that the variances of nominal returns are identical within asset classes. As a robustness test, we also try using the change in the portfolio weight based on the risk-adjusted return on assets in place of the exchange rate volatility measure.
Thus, we use the following specification:
𝑙𝑙𝑙𝑙 � 𝐷𝐷𝐷𝐷𝑖𝑖,𝑡𝑡
𝑊𝑊𝐷𝐷𝑊𝑊𝑊𝑊𝑡𝑡− 𝐷𝐷𝐷𝐷𝑊𝑊𝑊𝑊𝑖𝑖,𝑡𝑡�
=𝛼𝛼0+𝛼𝛼1𝑙𝑙𝑙𝑙 �𝐷𝐷𝐷𝐷𝑊𝑊𝑊𝑊𝑖𝑖,𝑡𝑡
𝑊𝑊𝐷𝐷𝑊𝑊𝑊𝑊𝑖𝑖,𝑡𝑡�+𝛼𝛼2�𝑙𝑙𝑙𝑙�𝜎𝜎𝑖𝑖,𝑡𝑡� �+𝛼𝛼3�𝑙𝑙𝑙𝑙 ( 𝑟𝑟𝑟𝑟𝑖𝑖,𝑡𝑡) � +𝛼𝛼4𝑙𝑙𝑙𝑙 � 𝐷𝐷𝐷𝐷𝑖𝑖,𝑡𝑡−1
𝑊𝑊𝐷𝐷𝑊𝑊𝑊𝑊𝑡𝑡−1− 𝐷𝐷𝐷𝐷𝑊𝑊𝑊𝑊𝑖𝑖,𝑡𝑡−1�+𝛼𝛼5𝑋𝑋𝑖𝑖,𝑡𝑡+𝜀𝜀𝑖𝑖,𝑡𝑡
where 𝑙𝑙𝑙𝑙 �𝑊𝑊𝐷𝐷𝑊𝑊𝑊𝑊𝐷𝐷𝐷𝐷𝑖𝑖,𝑡𝑡
𝑡𝑡−𝐷𝐷𝐷𝐷𝑊𝑊𝑊𝑊𝑖𝑖,𝑡𝑡� is the natural logarithm of actual foreign holdings of debt
securities as a share of foreign market size, while 𝑙𝑙𝑙𝑙 �𝑊𝑊𝐷𝐷𝑊𝑊𝑊𝑊𝐷𝐷𝐷𝐷𝑊𝑊𝑊𝑊𝑖𝑖,𝑡𝑡
𝑖𝑖,𝑡𝑡� is the natural logarithm
of the relative size of the domestic debt securities market. 𝑙𝑙𝑙𝑙�𝜎𝜎𝑖𝑖,𝑡𝑡� is the natural
15
logarithm of the average standard deviation of monthly bilateral real exchange rate changes in country i at time t, and 𝑙𝑙𝑙𝑙 (𝑟𝑟𝑟𝑟𝑖𝑖,𝑡𝑡) is the natural logarithm of the risk-adjusted dollar return on the debt securities of country i at time t. The dollar (hedged) return is calculated as the bond yield adjusted for the foreign exchange rate. The risk-adjusted return is then derived by dividing the hedged return by the return volatility defined as the standard deviation of the monthly hedged return at time t. 𝑋𝑋𝑖𝑖,𝑡𝑡 is a vector of other variables that are included in the specification. 𝜀𝜀𝑖𝑖,𝑡𝑡 is an error term.
Thus, the dependent variable of the regression equation is
LSHARE = the natural logarithm of each country’s actual foreign holdings of debt securities as a share of foreign market size
and the explanatory variables included in the regression equation are as follows:
LSIZE = the natural logarithm of the relative size of each country’s domestic debt securities market, which is defined as the ratio of the market capitalization of each country’s domestic debt securities to the market capitalization of the world’s debt securities
LAGLSHARE = a one-year lag of the dependent variable LSHARE
LRERV = 𝑙𝑙𝑙𝑙�𝜎𝜎𝑖𝑖,𝑡𝑡� = the natural logarithm of each country’s real exchange rate volatility, which is defined as the average standard deviation of monthly bilateral real exchange rate changes in each country
LRR = 𝑙𝑙𝑙𝑙(𝑟𝑟𝑟𝑟𝑖𝑖,𝑡𝑡) = the risk-adjusted hedged dollar return on the debt securities of each country, which is derived by dividing the hedged dollar return (the yield on 3-year bonds) by the return volatility, where the return volatility is defined as the rolling standard deviation of the monthly hedged dollar return
16
GFC = a dummy variable for the GFC that equals 1 from 2009 until 2011 and 0 otherwise
The coefficient of LSIZE is the home bias coefficient and should equal one if there is no home bias and zero if there is extreme home bias. The coefficient of the lagged dependent variable LAGLSHARE should be positive if inertia is present and there is a tendency for LSHARE to be influenced by its value in the previous year. The coefficient of LRERV should be negative since foreign exchange risk presumably dampens investors’ appetite for foreign debt securities, and the coefficient of LRR should be positive if investors have a return-chasing motive and seek investment opportunities with the highest risk-adjusted return. Finally, the coefficient of GFC tests the hypothesis that the GFC caused a structural change in world financial markets and foreign asset holding behavior (in particular, that there was an across-the-board change in foreign holdings of debt securities after the GFC).
The equation is estimated using a tobit model to correct for censoring of the dependent variable, which ranges from 0 to 1, but one has to be careful when assessing the marginal effects of explanatory variables on home bias because the tobit estimator is non-linear, implying non-constant marginal effects of the explanatory variables.
However, the relatively low degree of censoring in our sample would in practice allow for a direct interpretation of the estimated coefficients as marginal effects. This is confirmed by the fact that the tobit estimates are very similar to the panel fixed effects estimates (not shown), which suggests that the possible bias introduced by tobit estimation is minimal. Panel stationarity tests were conducted using the Phillips-Perron unit root tests. All variables except for LSIZE were found to be I(0) or stationary, whereas LSIZE was found to be I(1). Therefore, DLSIZE, the first difference of LSIZE, was used in the estimations.
The sample includes the same eleven economies included in the analysis in subsection 4.1 except that the US had to be dropped from the sample when LRERV was included because data on this variable were not available for the US. t spans the 10
17
years from 2002 to 2011.8 Various specifications were estimated for the full sample (10 or 11 economies), developing Asia (4 economies), and advanced Asia (4 economies).
Because of the unavailability of data, the actual number of observations is 95 to 97 instead of 110 for the full sample including the US, 95 instead of 100 for the full sample excluding the US, 27 to 36 instead of 40 for developing Asia, and 38 to 39 instead of 40 for advanced Asia.
It is quite plausible that access to information about investment opportunities abroad and the cost of obtaining such information will affect the extent of foreign holdings of debt securities and that they will vary greatly from economy to economy, and thus it would have been desirable to include such variables as additional explanatory variables.
Unfortunately, it is difficult to obtain data on such variables, but country dummies were included to capture time-invariant omitted variables such as access to information about investment opportunities abroad and the cost of obtaining such information, and thus our estimation method allows us to control for the exclusion of such variables to some extent.
Econometric tests of the portfolio selection model with standard mean-variance typically use data on equities, but it can also be applied to debt securities, as we do, because debt securities are also risky assets. In fact, at least two studies (Fearnley, 2002; Fidora, et al., 2006) have tested this model for both equities and bonds.
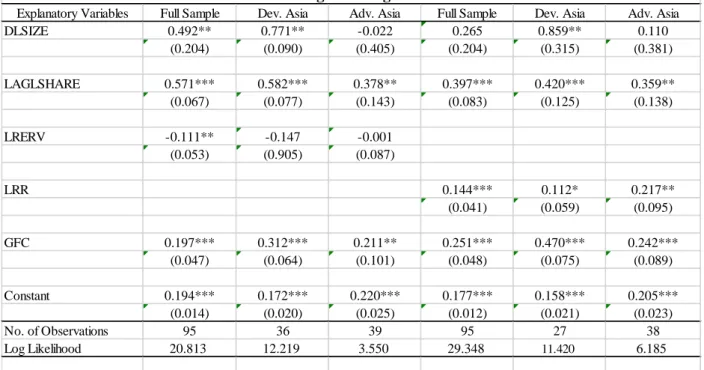
4.3. Estimation Results for Debt Securities of All Maturities
Tables 1 and 2 report the estimation results. Table 1 reports the results for foreign holdings of debt securities of all maturities, and as can be seen from this table, the coefficient of DLSIZE is significantly less than one in the case of the full sample. This implies that there is some degree of home bias, a result that is consistent with previous studies such as French and Poterba (1991) and Fidora, et al. (2006), who find that the share of their portfolios that investors invest in foreign securities is much too low compared to simple benchmarks resulting from the CAPM.
8 2001 had to be dropped from the sample period because a lagged dependent variable was included.
18
Looking at the results for the two Asian subsamples, the coefficient of DLSIZE is by far the highest and is significantly greater than zero in the developing Asia sample, suggesting that home bias is weakest in developing Asia and that foreign investors are especially responsive to the growth of debt securities markets in this region. By contrast, the coefficient of DLSIZE is not significantly greater than zero but is significantly less than one in the advanced Asia sample, suggesting that home bias is relatively strong in advanced Asia and that foreign debt security holdings do not appear to respond to the growth of debt securities markets in this region.
The coefficient of the lagged dependent variable LAGLSHARE is positive and statistically significant in all cases, with its point estimate ranging from 0.36 to 0.58.
This strongly suggests the presence of inertia.
The coefficient of LRERV, our measure of real exchange rate volatility, is negative and statistically significant, as expected, in the full sample, suggesting that an increase in the volatility of real exchange rates tends to scare investors away from holding foreign debt securities. However, real exchange rate volatility does not have a significant impact on foreign holdings of debt securities in either Asian sample. We also tried using hedged exchange rates when calculating exchange rate volatility, but the results are not reported because they were very similar to those based on unhedged exchange rates.
We then examine whether or not LRR, our measure of the risk-adjusted return, matters more than real exchange rate volatility and whether there is evidence of a return-chasing motive. When the risk-adjusted return is included in lieu of real exchange rate volatility, its coefficient is positive and statistically significant in all three samples, meaning that higher returns attract more foreign holdings of debt securities.
This sensitivity to the risk-adjusted return is weaker (albeit still statistically significant) in the case of developing Asia than in the case of advanced Asia, suggesting that foreign investors are more responsive to relative market size in developing Asia.
19
We include the dummy variable GFC in all specifications to test the hypothesis that the GFC caused a structural change in world financial markets and foreign asset holding behavior. The coefficient of GFC is positive and statistically significant in all three samples and is especially large and statistically significant in the developing Asia sample. This suggests that foreign holdings of debt securities were significantly higher during the post-GFC period than during the tranquil (pre-GFC) period and that this was particularly true for developing Asia even after controlling for other factors that may have affected portfolio decisions. We also tried interacting GFC and DLSIZE to test the hypothesis that the home bias coefficient changed after the GFC, but the coefficient of the interaction term was never statistically significant. Moreover, we also tried an alternate definition of GFC, which takes a value of one only in the year 2009, to see if there was a temporary response at the time of the GFC, but its coefficient was never statistically significant.9
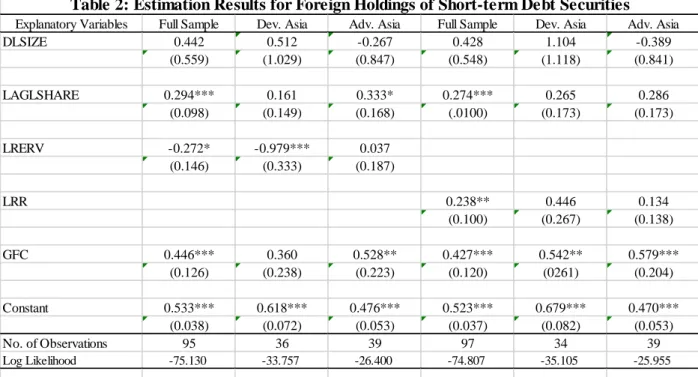
4.4. Estimation Results for Short-term Debt Securities
Because of the volatility or surge in foreign holdings of short-term debt securities during the GFC, we also estimate our regression equation for the case of foreign holdings of short-term debt securities to see if there are any peculiarities. The estimation results are shown in Table 2, and as can be seen from this table, the coefficient of DLSIZE is not significantly greater than zero in any sample in the case of short-term debt securities, meaning that the null hypothesis of extreme home bias cannot be rejected.
The coefficient of the lagged dependent variable is much smaller and less significant in all three samples in the case of short-term debt securities, suggesting that inertia is weaker in the case of short-term debt securities. Another difference relative to the results for debt securities of all maturities is that the coefficient of GFC is much larger in all three samples in the case of short-term debt securities. Thus, foreign holdings of short-term debt securities were more volatile and the surge in foreign holdings of debt
9 The results are not shown due to space limitations but are available from the authors upon request.
20
securities during the post-GFC period was especially pronounced in the case of short- term debt securities.
The results also show that LRERV, our measure of real exchange rate volatility, has a negative and statistically significant impact on foreign holdings of short-term debt securities in the case of the full sample and developing Asia but not in the case of advanced Asia. Since Asian currencies were much more stable than Eurozone and UK currencies, this result implies that the surge in foreign holdings of the debt securities of the developing Asian economies was due partly to lower exchange rate volatility in these economies.
The coefficient of LRR, our measure of the risk-adjusted return, is positive but insignificant in the case of foreign holdings of short-term debt securities in the developing Asia sample, which provides further corroboration of our contention that the surge in foreign holdings of the short-term debt securities of the developing Asian economies was due mainly to the fact that exchange rates were more stable in developing Asia than in the major industrialized economies.
5. SUMMARY OF FINDINGS AND POLICY IMPLICATIONS
In this paper, we analyzed data on trends in foreign holdings of debt securities since 2000 with emphasis on Japan and non-Japan Asia and conducted an econometric analysis of the determinants of foreign holdings of debt securities with a focus on differences between the pre- and post-Global Financial Crisis (GFC) periods and on the Asian economies.
To summarize our main findings, we tested for the existence and strength of home bias and found that it is still present in all economies and regions, especially in the case of short-term debt securities, which suggests that the Feldstein and Horioka (1980) paradox is still very much alive and well. However, we also found that there are substantial variations among economies and regions in the strength of home bias, with
21
the Eurozone economies, the US, and developing Asia showing relatively weak home bias and advanced Asia, especially Japan, showing relatively strong home bias. We then examined trends over time in foreign holdings of debt securities and found that capital has been flowing from the US and the Eurozone economies to both advanced Asia (especially Japan) and developing Asia and that foreign holdings of debt securities have been increasing in advanced as well as developing Asia but for different reasons. The main reason in the case of advanced Asia (especially Japan) appears to be higher risk- adjusted returns, whereas the main reason in the case of developing Asia appears to be the growth of debt securities markets combined with relatively weak home bias and (in the case of short-term securities) lower exchange rate volatility. Looking finally at the impact of the GFC, we found that, since the GFC, foreign holdings of debt securities have declined (i.e., home bias has strengthened) in all economies and regions except developing Asia, where they have increased (except for a temporary decline in 2008) but where their share is still much lower than the optimal share warranted by the capital asset pricing market (CAPM) model.
Looking in more detail at our findings concerning government debt financing in Japan, although Japan’s fiscal situation continues to be wobbly, Japan (in particular, the Japanese government) benefited greatly from the Eurozone crisis because it prompted at least a temporary shift in the portfolios of foreign investors toward relatively safe Japanese government securities, especially short-term Japanese government securities, which in turn kept yields on such securities lower than they would have been otherwise.
However, this situation will not continue indefinitely because risks in the rest of the world will eventually decline and because investor appetite for risk will eventually return as the Eurozone crisis subsides. (In fact, Figure 3 shows that risk levels on government securities in economies and regions other than Japan had already declined sharply by early 2010.) Moreover, the current situation is tenuous because the shortening of maturities on Japanese government securities, especially among foreign holdings of such securities, increases the difficulty of rollover and the risk of capital flight, because debt securities markets are deepening and expanding in developing Asia, thereby creating competition for Japanese debt securities, especially since they offer higher yields and the possibility of currency appreciation, and because household saving
22
rates in Japan can be expected to decline even further due to the continuing aging of the Japanese population (Horioka, 1989, 1991, 1992, and 1997), meaning that domestic as well as foreign demand for Japanese debt securities can be expected to decline .
The policy implication of these findings for Japan is that the Japanese government still needs to get its fiscal house in order, preferably sooner rather than later. And the most obvious ways of doing so are to increase tax revenues (e.g., by increasing the consumption tax, as the government is in the process of doing) and/or to cut government expenditures (e.g., by reforming the public pension system and other social safety nets).
The problem is that it is hard to implement such reforms in a country in which the economy is stagnant and still recovering from the earthquake, tsunami, and nuclear power plant accident of March 2011 and in which the government has lacked the political will to implement necessary fiscal reforms for many years.
One lesson that the rest of Asia can learn from Japan is that capital is mobile internationally (though not fully mobile) and that it will flow to where the risk-return trade-off is the most attractive. If sovereign debt crises arise and/or are exacerbated in the Eurozone or elsewhere, Asian debt securities will become relatively attractive as assets and foreign investors may well move their assets into Asian debt securities. The rapid development of debt securities markets in Asia—which is presumably due in large part to high yields, favorable long-term growth prospects, and a high probability of currency appreciation—makes this possibility all the more likely. Needless to say, however, volatile capital flows, currency appreciations, and the adverse trade and other impacts of the Eurozone crisis will make macroeconomic management in Asia more difficult (Dornbusch, 1986; Asian Development Bank, 2012).
23 DATA APPENDIX
The data on trends in government debt financing in Japan in subsection 2.1 are taken from the Bank of Japan’s Flow of Funds Accounts (FFA) Statistics, which in turn are taken from the Bank of Japan’s Balance of Payments statistics. The FFA records movements of financial assets and liabilities among institutional units called sectors, such as financial institutions, corporations, and households, for various financial instruments called transaction items, such as deposits and loans. Thus, the FFA includes data on holdings of government securities by each sector of the economy and hence can shed light on who is financing Japan’s government debt. These data can be downloaded from the Bank of Japan website at http://www.boj.or.jp/en/statistics/sj/index.htm/.
The data on foreign holdings of debt securities by economy or region in subsection 2.2 are taken from the Coordinated Portfolio Investment Survey (CPIS) of the International Monetary Fund (IMF), which collects year-end data on portfolio investment holdings (equity and debt securities) from participating economies. These data can be downloaded from the IMF website at http://cpis.imf.org.
The data on bond yields, forward rates, and exchange rates in section 3 and the data needed to calculate LRERV and LRR in subsection 4.2 are taken from the Bloomberg Financial Database. Yields and forward rates on 3-year bonds are used for the full sample, while yields and forward rates on 12-month bonds are used for the short-term securities sample.
The “home bias index” (or the “foreign asset acceptance ratio”), which is used in section 4, is computed for all assets (inclusive of equity and debt securities) as (foreign assets held by domestic residents / (domestic market capitalization + foreign assets held by domestic residents – domestic assets held by foreign residents)) / ((worldwide market capitalization – domestic market capitalization) / worldwide market capitalization).
Data on the variables needed to calculate the home bias index were taken from the following sources and defined as follows:
24
Variable Name Data Source Definition
Foreign Assets held by Domestic Residents
Derived using data from the Coordinated Portfolio Investment Survey (see above)
Total value of equity or debt investment from world to destination country.
Domestic Assets held by Foreign Residents
Derived using data from the Coordinated Portfolio Investment Survey (see above)
Total value of equity or debt investment from source country to world.
Domestic and Worldwide Equity Market Capitalization
World Bank’s World Development Indicators (WDI)
http://data.worldbank.org/data- catalog/world-development- indicators
Market capitalization (also known as market value) is the share price times the number of shares
outstanding. Data are in current US dollars. (WDI Definition)
Domestic Debt Market
Capitalization
Bank for International Settlements’
(BIS) Debt Securities Statistics http://www.bis.org/statistics/secstats.
htm
Outstanding debt securities (domestic + international debts) of a country.
Worldwide Debt Market
Capitalization
Derived using data from Bank for International Settlements (BIS) (see above)
Total of the outstanding debt securities (domestic + international debts) of the countries available in the BIS database.
LSHARE and LSIZE, which are used in subsection 4.2, can easily be calculated from the home bias index. LSHARE is simply the natural logarithm of the numerator of the home bias index, while LSIZE is simply the natural logarithm of the denominator of the home bias index.
25 REFERENCES
Adler, M. and B. Dumas, 1983, International Portfolio Choice and Corporation Finance:
A Synthesis. Journal of Finance, 38, pp. 925-984.
Apergis, N., and C. Tsoumas, 2009, "A Survey of the Feldstein-Horioka Puzzle: What Has Been Done and Where We Stand," Research in Economics, 63, pp. 64-76.
Asian Development Bank, 2012, Asian Development Outlook 2012. Asian Development Bank, Manila.
Cho, S., 2011, Foreign Bond Ownership in Korea: Changing Trends and Implications.
Korean Capital Market Institute, 3, pp. 56-65.
Cooper, I. and E. Kaplanis, 1994, Home Bias in Equity Portfolios, Inflation Hedging, and International Capital Market Equilibrium. Review of Financial Studies, 7, pp.
45-60.
Dornbusch, R., 1986, Flexible Exchange Rates and Excess Capital Mobility. Brookings Papers on Economic Activity, 17, pp. 209-226.
Fearnley, T. A., 2002, Estimation of an International Capital Asset Pricing Model with Stocks and Government Bonds. FAME Research Paper No. 95, International Center for Financial Asset Management and Engineering (FAME), Geneva.
Feldstein, M. and C. Horioka, 1980, Domestic Saving and International Capital Flows.
Economic Journal, 90, pp. 314-329.
Fidora, M., M. Fratzscher, and C. Thimann, 2006, Home Bias in Global Bond and Equity Markets: The Role of Real Exchange Rate Volatility. ECB Working Paper Series No. 685, European Central Bank, Frankfurt.
Ford, N., 2015, A Solution to the Feldstein-Horioka Puzzle and an Exchange Rate Model that Works, mimeo., Wolfson College, Cambridge University, Cambridge, U.K.
French, K. R., and J. M. Poterba, 1991, Investor Diversification and International Equity Markets. American Economic Review, 81, pp. 222–226.
26
Habib, M. M. and L. Stracca, 2011, Getting Beyond Carry Trade: What Makes a Safe Haven Currency? ECB Working Paper Series No. 1288, European Central Bank, Frankfurt.
Horioka, C. Y., 1989, Why Is Japan's Private Saving Rate So High? In: Developments in Japanese Economics (eds. R. Sato and T. Negishi), pp. 145-178. Academic Press/Harcourt Brace Jovanovich, Publishers, Tokyo.
Horioka, C. Y., 1991, The Determinants of Japan's Saving Rate: The Impact of the Age Structure of the Population and Other Factors. Economic Studies Quarterly, 42, pp.
237-253.
Horioka, C. Y., 1992, Future Trends in Japan's Saving Rate and the Implications Thereof for Japan's External Imbalance. Japan and the World Economy, 3, pp. 307- 330.
Horioka, C. Y., 1997, A Cointegration Analysis of the Impact of the Age Structure of the Population on the Household Saving Rate in Japan. Review of Economics and Statistics, 79, pp. 511-516.
Horioka, C. Y., T. Nomoto, and A. Terada-Hagiwara, 2014a, Explaining Foreign Holdings of Asia’s Debt Securities. ADB Working Paper Series on Regional and Economic Integration No. 124, Asian Development Bank, Manila.
Horioka, C. Y., T. Nomoto, and A. Terada-Hagiwara, 2014b, Why Has Japan’s Massive Government Debt Not Wreaked Havoc (Yet)? The Japanese Political Economy, 40, pp. 3-23.
International Monetary Fund, 2005, Aspects of Global Asset Allocation. In: Financial Stability Report (ed., International Monetary Fund). International Monetary Fund, Washington, D.C. Available at
http://www.imf.org/External/Pubs/FT/GFSR/2005/02/.
Isard, P. and L. Stekler, 1985, U.S. International Capital Flows and the Dollar.
Brookings Papers on Economic Activity, 1, pp. 219-236.
Kim, S., S. H. Kim, and Y. Wang, 2007, Saving, Investment and International Capital Mobility in East Asia. Japan and the World Economy, 19, pp. 279-291.
27
Kim, S., S. H. Kim, and Y. Choi, 2014, Financing Investment in East Asia: Regional or Global Savings?" Japan and the World Economy, 31, pp. 1-7.
Lintner, J., 1965, The Valuation of Risk Assets and the Selection of Risky Investments in Stock Portfolios and Capital Budgets. Review of Economics and Statistics, 47, pp.
13-37.
Obstfeld, M. and K. Rogoff, 2001, The Six Major Puzzles in International Macroeconomics: Is There a Common Cause? NBER Macroeconomics Annual 2000, 15, pp. 339-412.
Rodrik, D. and A. Velasco, 1999, Short-Term Capital Flows. NBER Working Paper No.
7364, National Bureau of Economic Research, Cambridge, MA.
Sercu, P., 1980, A Generalization of the International Asset Pricing Model. Revue de l’Association Française de Finance, 1, pp. 91-135.
Sharpe, W., 1964, Capital Asset Prices: A Theory of Market Equilibrium under Conditions of Risk. Journal of Finance, 19, pp. 425-442.
Solnik, B. H., 1974, An Equilibrium Model of the International Capital Market. Journal of Economic Theory, 8, pp. 500-524.
28
Figure 1: Shares of Foreign Holdings of Japanese Government Securities, 2000- 2011
(percent)
Notes: Shows the shares of foreign holdings of medium-/long-term and short-term Japanese government securities.
Source: Flow of Funds Accounts Statistics, Bank of Japan. See the Data Appendix for details.
29
Figure 2: Hedged Returns on One-year Dollar Bonds in Selected Economies and Regions, 2005-2012
(percent)
Notes: Shows hedged returns (returns that are hedged against currency risk) on one-year dollar bonds. PRC denotes People's Republic of China, IND denotes India, KOR denotes Republic of Korea, JPN denotes Japan, US denotes United States, and euro denotes Eurozone.
Source: The authors’ own calculations using data from the Bloomberg financial data base.
0 0.5 1 1.5 2 2.5
M1 2005 M4 2005 M7 2005 M10 2005 M1 2006 M4 2006 M7 2006 M10 2006 M1 2007 M4 2007 M7 2007 M10 2007 M1 2008 M4 2008 M7 2008 M10 2008 M1 2009 M4 2009 M7 2009 M10 2009 M1 2010 M4 2010 M7 2010 M10 2010 M1 2011 M4 2011 M7 2011 M10 2011 M1 2012 M4 2012 M7 2012
PRC IND KOR JPN 1yr US 1yr euro 1 yr
30
Figure 3: Rolling Standard Deviations of Hedged Returns on One-year Dollar Bonds in Selected Economies and Regions, 2005-2012
(percentage points)
Notes: Shows rolling standard deviations of hedged returns on one-year dollar bonds calculated using a 12-month window with the current month being the seventh month. PRC denotes People's Republic of China, IND denotes India, KOR denotes Republic of Korea, JPN denotes Japan, US denotes United States, and euro denotes Eurozone.
Source: The authors’ own calculations using data from the Bloomberg financial data base.
0 1 2 3 4 5 6 7 8 9 10
M1 2005 M5 2005 M9 2005 M1 2006 M5 2006 M9 2006 M1 2007 M5 2007 M9 2007 M1 2008 M5 2008 M9 2008 M1 2009 M5 2009 M9 2009 M1 2010 M5 2010 M9 2010 M1 2011 M5 2011 M9 2011 M1 2012 M5 2012
PRC IND KOR JPN 1yr US 1yr euro 1 yr
31
Figure 4: Risk-adjusted Hedged Returns on One-year Dollar Bonds in Selected Economies and Regions, 2005-2012
(percent)
Notes: Shows risk-adjusted hedged returns on one-year dollar bonds calculated by dividing the hedged return by the rolling standard deviation of hedged returns. PRC denotes People's Republic of China, IND denotes India, KOR denotes Republic of Korea, JPN denotes Japan, US denotes United States, and euro denotes Eurozone.
Source: The authors’ own calculations using data from the Bloomberg financial data base.
0 20 40 60 80 100 120
M1 2005 M5 2005 M9 2005 M1 2006 M5 2006 M9 2006 M1 2007 M5 2007 M9 2007 M1 2008 M5 2008 M9 2008 M1 2009 M5 2009 M9 2009 M1 2010 M5 2010 M9 2010 M1 2011 M5 2011 M9 2011 M1 2012 M5 2012
PRC IND KOR JPN 1yr US 1yr euro 1 yr