Effects of increased pCO 2 and iron availability on phytoplankton assemblages in the Southern Ocean
Hisashi Endo
1, Hiroshi Hattori
2, Gen Hashida
3, Jun Nishioka
1, Hiroshi Sasaki
4, and Koji Suzuki
11
Hokkaido University, Sapporo, Japan,
2Tokai University, Sapporo, Japan,
3
National Institute of Polar Research, Tachikawa, Japan,
4Senshu University of Ishinomaki, Ishinomaki, Japan
A risk of ocean acidification (i.e., an increase in seawater pCO
2and a concomitant decrease in pH) will be the most severe in the Southern Ocean (Orr et al. 2005), which is also known to be a high-nitrate, low-chlorophyll (HNLC) region. In addition, climate change might increase atmospheric iron deposition to some oceanic regimes and its availability for the phytoplankton assemblages (Woodward et al., 2005). However, little is known about the impacts of ocean acidification, as well as iron enrichment on phytoplankton assemblage in this oceanic Southern Ocean. We therefore conducted simulated in situ incubation experiments during the austral summer of 2011/2012 on board the TR/V Umitaka-Maru to examine the effects of CO
2and iron availability on the community composition and photosynthetic physiology of phytoplankton. Seawater samples were collected from ~15 m at stations C02, C07, D07, and D13 (Fig. 1) with an acid-clean Teflon pump system. Prior to incubation, FeCl
3solutions were added into acid-clean incubation bottles in order to reduce iron limitation for phytoplankton growth. Ambient CO
2(Fe-added) and high-CO
2(ca. 750 µatm; Fe-and-CO
2-added) treatments (duplicate each) were constructed with or without the addition of CO
2-saturated seawater to the bottles. Duplicated non-iron-added (control) treatments were also prepared to assess the effects of iron enrichment on phytoplankton assemblages. Incubations were conducted for 3 or 4 days in a light- and temperature-controlled laboratory incubator (100 µmol photons m
−2s
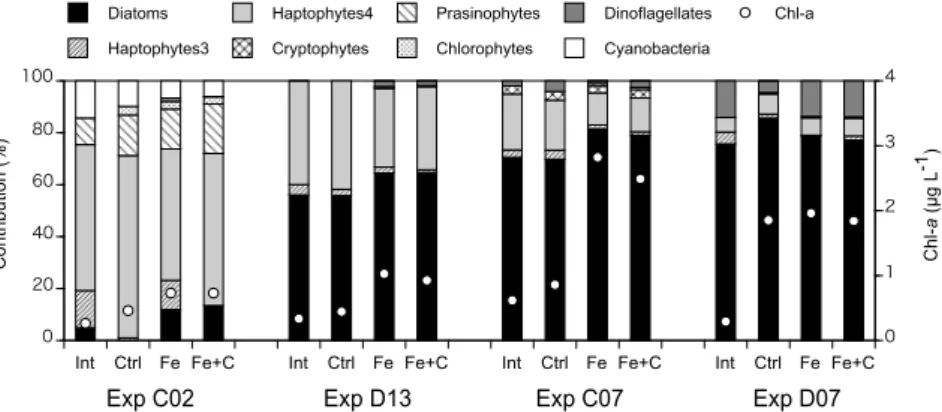
−1and in situ temperature). Initial phytoplankton community was mainly dominated by haptophytes at station C02, while diatoms were predominant at the other stations in terms of chlorophyll a (Chl-a) biomass (Fig. 2). At the end of incubation, concentrations of Chl-a were significantly higher in the Fe-added treatments relative to the controls at stations C02, C07, and D13 (t-test, p<0.05). In photosynthesis-irradiance experiments, remarkable increases in the maximum photosynthetic rate (P
Bmax) were observed in response to iron additions at these stations. However, effects of iron enrichment on Chl-a and P
Bmaxwere not clear at station D07. A biomarker of haptophytes (19’-hexanoyloxyfucoxanthin) decreased in response to a rise in CO
2level at the end of incubation at stations C02 and D13. On the other hand, at the stations C07 and D07, a biomarker of diatoms (fucoxanthin) decreased in the high CO
2treatments relative to ambient CO
2treatments. At all stations, P
Bmaxvalues were little affected with CO
2availability. Our results suggest that the progression of ocean acidification and iron enrichment can alter the community composition in the Southern Ocean, although the response would differ among geographical locations due to the differences in environmental conditions.
References
Orr, J. C., Fabry, V. J., Aumont, O., Bopp, L., Doney, et al.: Anthropogenic ocean acidification over the twenty-first century and its impact on calcifying organisms, Nature, 437, 681-686, 2005.
Woodward, S., Roberts, D. L., and Betts, R. A.: A stimulateion of the effect of climate change-induced desertification on mineral dust aerosol, Geophys. Res. Lett., 32, L18810, 2005.
Fig. 1. Sampling sites of seawater for our incubation experiments.
Fig. 2. Mean contributions of each phytoplankton class to total Chl-a biomass as estimated by CHEMTAX and mean Chl-a biomass. Int, Ctrl, Fe, and Fe+C indicate initial, control, Fe-added, and Fe-and-CO
2-added treatments, respectively.
0
0
0
0
0
0
90˚E 90˚E
100˚E 100˚E
110˚E 110˚E
120˚E 120˚E
130˚E 130˚E
140˚E 140˚E
150˚E 150˚E
160˚E 160˚E
170˚E 170˚E
70˚S 70˚S
60˚S 60˚S
50˚S 50˚S
40˚S 40˚S
30˚S 30˚S
C02
C07
D07 D13
Antarctica Australia
0 20 40 60 80 100
0 1 2 3 4
Contribution (%) Chl-a (µg L-1)