Contamination Effect on SM/MPAC&SEED Experiment Naoko BABA 1 and Yugo KIMOTO 2
1 Manned Space Systems Department, Japan Manned Space Systems Corporation, Tsuchiura, Ibaraki 300-0033, Japan
2 Institute of Aerospace Technology, Japan Aerospace Exploration Agency, Tsukuba, Ibaraki 305-8505, Japan
Material exposure experiments are expected to present the material degradation under space environment. However, the exposure experiments can not be free from induced environments.
Contamination from the International Space Station (ISS) produced the most readily change to the SM/MPAC&SEED samples, other than natural environments. Since measured characteristics of retrieved materials are affected by both natural and induced environments, it is difficult to investigate the net effect of natural environments. Energetic particles easily penetrate the contamination layer and their effects are maintained. In contrast, contaminant deposition masks the mass loss by atomic oxygen (AO), and contamination discoloration decorates the net change in sample optical characteristics induced by ultraviolet (UV) radiation. This paper was prepared to suggest when, what materials deposited on the samples how much.
Keywords: MPAC&SEED, Contamination, Material exposure experiment, ISS
1. Introduction
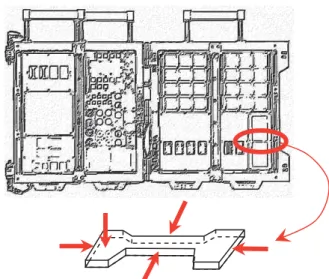
The Japan Aerospace Exploration Agency (JAXA) deployed three identical MPAC&SEED units for two passive experiments on the exterior of the Russian Service Module (SM) on the International Space Station (ISS) [1]. The three units were retrieved individually, after 315, 865, and 1403 days of exposure. To capture micrometeoroids or debris, very light-weight materials such as silica aerogel and polyimide foam were mounted on the both faces of the MPAC units. The SEED exposed 28 organic and inorganic samples to investigate their performances on low Earth orbit. The overall dimensions of one MPAC&SEED unit are W570 mm, H875 mm, and D158 mm. Each unit consists of four sample holders which are compact enough to be retrieved via extra vehicular activity (EVA).
2. Contamination Environment of SM/MPAC&SEED The Service Module (SM) of the International Space Station (ISS) is located on the aft end, where visiting Russian vehicles dock. External contamination from vehicle thruster plumes and propellant purges had been predicted, in addition to outgassing from organic materials on the Service Module Micro-Particles Capturer and Space Environment Exposure Device (SM/MPAC&SEED) [2]. The ram faces of SM/MPAC&SEED units point toward the ISS velocity vector when the ISS flies in the X-axis in the Velocity Vector (XVV).
The ISS spent more than 40% of its time in other attitudes while SM/MPAC&SEED was on board; the ram and wake face orientations also changed [3].
Pankop et al. performed induced contamination analyses of the ISS, including MPAC&SEED [4]. The field of view from and to MPAC&SEED was analyzed using an ISS geometric model, indicating that a large fraction of the view from the ram face was occupied by the SM, the SM solar array, the Functional Cargo Block, and docked vehicles such as Soyuz and Progress. Only the SM and Progress docking on the SM aft
port entered into the view from the wake face. They estimated that more contamination on the wake face was induced by the thruster rather than by outgassing. In contrast, the predicted thruster-induced contamination on the ram face was negligible [4].
Contamination of external surfaces is a complicated process that is generated by molecular deposition, crosslinking induced by ultraviolet (UV) radiation, and reaction with and erosion by atomic oxygen (AO). Passive space environment monitors were mounted on the MPAC&SEED to measure the total dose of AO, UV, space radiation, and the temperature.
Thermal analysis predicted the maximum temperature as 102°C, and minimum as –105°C at the ram surface. Only the maximum experienced temperatures were recorded using passive thermal labels on orbit. Temperature indicator 8E-50 (Nichiyu Giken Kogyo Co., Japan) mounted 1 mm under the ram surface recorded 90°C. The maximum temperatures were 50-60°C at other measurement points, 5 mm under the ram surface. The observed temperatures suggest that the thermal analysis estimated the on orbit temperature almost precisely.
3. Contamination Observations 3.1. Optical Observation
All retrieved trays had brownish surfaces. The different coloration among units with three different exposure durations was not significant (Fig. 1).
On each unit, the wake face was a much darker color than the ram face (Fig. 2). The white donut around the fastener hole was covered by a fastener head on orbit. The brown color of the contaminated areas was deeper at the rim of the white donut.
The aerogel tile surfaces were darkened, with a roughened texture [5]. Originally it was expected that the flat and semi-transparent texture of the aerogel surface make the visual investigation easy. At the post-retrieval observation, we found that the aerogel on the wake face suffered much greater damage
than that on the ram face. The cracks on the crispy altered surfaces were increased by exposure duration. Even the aerogel on the ram face had a rough surface after extended exposure.
a) 1st Unit b) 2nd Unit c)3rd Unit Fig. 1 Retrieved SM/MPAC&SEED units
a) Wake b) Ram Fig. 2 Aluminum plates removed from the 3rd
retrieved unit
The numerous colored spots found on the samples were roughly categorizable into 1) White clouds, 2) Brown clouds, 3) Brown spots, 4) Gray spots, 5) Black flakes, and 6) Others.
3.2. XPS and TOF-SIMS Analysis
Contamination of the aluminum plates that had been mounted on both the ram and wake faces of the three units was analyzed using X-ray photoelectron spectroscopy (XPS) and time-of-flight secondary ion mass spectroscopy (TOF-SIMS).
The plates, which were used to fix the SEED samples, were made of A6061-T6 alloy with MIL-A-8625 type I anodic coating. The coating must be completely sealed because it has porous structure. Cobalt or nickel acetate are often used in a sealing agent.
First, XPS analyses were performed to obtain the atomic composition of the top surfaces using Quantera SXM (PHI, USA). The analysis points were selected from uniformly contaminated areas and colored spots on each plate. Moreover, XPS depth profiling using Ar-ion etching was performed on the uniformly contaminated parts, thereby revealing the internal structure of the contamination. The sputtering rate was calculated using measurement data obtained by etching with a
standard sample of SiO2 film.
TOF-SIMS analyses were also performed using TFS-2000 (Physical Electronics Co., USA) on the uniform contamination to facilitate identification of the contaminant molecules: 15 kV Ga+ was used as the primary ion; the raster size was 80 ȝm × 80ȝm.
4. Analysis Results
4.1. Contamination materials identification
The XPS analysis results are presented in Fig. 3. The analyzed area was 200 ȝm in diameter and less than 10 nm deep. Therefore, the detected elements are inferred to include both terrestrial and on-orbit contamination.
At all analysis points on the ram and wake faces, O, C, Si, N, Al, and Ni were commonly detected. About 70% of the carbon appeared as CHx. Others were C-O, C=O, and COO. In addition, Zn, F, Na, S, Ca, Sn, P, K, and Pb were found on some analysis points.
Fig. 3 Elements composition of uniform contamination analyzed by XPS [Atomic %]
In general, more Si was detected from the ram face; the wake face had more Al and Ni. Depth profile charts revealed the balance of Si, Al, and Ni. A thick SiOx layer covered the original surface on the ram face, whereas the SiOx layer on the wake face was very thin (Fig. 4). Therefore, components of an aluminum anodic coating and Ni from the sealing agent appeared immediately below the very top surface, even after 1403 days’ exposure.
Nitrogen concentrations on the wake faces were considerably higher than on the ram faces (Fig. 3). Whereas N does not often appear in outgassed molecules, thruster plume contains a certain amount of nitrogen-bearing substances produced from the propellants. This supports the prediction of thruster plume-induced contamination [4]. Sulfur concentrations were 1.1–1.6% on the wake faces, but S was scarcely detectable on the ram faces; for unknown reasons.
One sample from the ram face of the third retrieved unit had significantly more fluorine than the other samples (Fig. 3).
In the analyzed area, 75% of the carbon was combined with F.
The depth profile indicated that an F- and C-rich top layer, 6–7
O O O O O
O
O O
O O O O O
C C C C C
C
C C
C C C C C
Si Si Si Si Si
Si
Si Si
Si Si Si Si
Si
N N N N N
N
N N
N N N
N N
F F F F F
F
F F
F
F F Al Al Al Al Al Al
Al Al
Al Al Al Al Al Ni Ni Ni Ni Ni Ni
Ni
Ni Ni Ni Ni Ni Ni
F F
0%
20%
40%
60%
80%
100%
Ram 1s t
Ram2nd Ram
3rd
Wake 1st
Wake 2nd Wake 3rd
Elements composition, Atomic %
nm thick, covered the next SiO2 layer. TOF-SIMS analysis depicted the fluorine distribution.
Figure 5 presents a comparison of the major fluoride ion intensities that were analyzed using TOF-SIMS. The measured ion counts were normalized by the total count. Intensities of the CF+, CF3+
, C2F4+
, and C2F5+
peaks were remarkably strong on the third retrieved unit compared to the first and second units.
Negative ions of fluorides, such as CFO-, C2F5O-, and C3F5O2-
, also had strong intensities on the third unit. They might be fragments of perfluoropolyether or polytetrafluoroethylene (PTFE) [6], etc. The intensities of the fluoride ions varied widely among the four analyzed areas on the third unit. This diversity suggests that fluorine was distributed unevenly within the same face of the third unit.
Fig.5 Normalized fluoride ion spectra analyzed by TOF-SIMS.
Five points were chosen from an aluminum plate on the wake face for XPS analysis to determine the contamination distribution in a smaller scale (Fig. 6). Contamination observed on the three sides was almost identical to that on the top, in spite of their different lines-of-sight. One side, closely faced to the frame that held the tray on orbit, presented a unique
composition. This side had much more C and F, instead of O and Si. The XPS results depict the centimeter-scale unevenness in fluorine distribution within a small area, as observed on the ram face using TOF-SIMS.
Fig. 6 XPS analysis points on an aluminum plate
The ESA Matroshka experiment facility is one possible source of outgassing fluorocarbon. Matroshka was covered by Teflon and was deployed in front of MPAC&SEED 18 days after the second unit retrieval. However, Matroshka’s effects cannot fully explain the local unevenness within the third retrieved unit.
Layered Structure of Contamination
A C-rich layer, which was less than 2-nm thick, covered the uppermost surfaces of all specimens. The discontinuation of the depth profile suggests that the layer was the result of terrestrial contamination (Fig. 4). Next layer, which was rich in Si- and O-, was considered to be a SiOx contaminant layer that was produced by AO reaction with siloxane. Within the SiOx layer, the ratio of Si to O was 2.01–2.30. Binding energy of
F+ F- CF+CF-
CF O+
CFO- CF3+
CF 3-
CF3O- C2F3O-
C2F4+ C2F3O2
C2F5 - C2F5+
C2F 5O-
C3F5O2- C3F7O-
C4F9O2 -
Ram 1st Ram 2nd
Ram 3rd Wake 1st
Wake 2nd Wake 3rd
0%
5%
10%
15%
20%
25%
30%
3rd retrieved unit, RAM
0 10 20 30 40 50 60 70 80 90 100
0 20 40 60 80 100 120 140 160 180 200 depth, nm (calibrated with SiO2 standard)
atomic concentration ,%
CN OAl SiNi
3rd retrieved unit, WAKE
0 10 20 30 40 50 60 70 80 90 100
0 20 40 60 80 100 120 140 160 180 200 depth, nm (calibrated with SiO2standard)
atomic concentration ,%
CN OAl SiNi
(a) Ram (b) Wake Fig. 4 Depth profiles from XPS analyses of the 3rd unit
-Si2p and -O1s corroborate the identification of the layer as SiO2. The layered structure closely resembled the contamination noted at the Passive Optical Sample Assembly-I (POSA-I), one of the Mir Environmental Effect Payloads, post retrieval analysis [7]. Subsequent TOF-SIMS analysis detected fragmentary ions of polydimethylsiloxane (PDMS) on both ram and wake faces of all three units. This result suggests that the SiO2 layer was formed with Si originating from PDMS contamination effused from silicone products.
Spots Contamination
Numerous colored spots were detected on the retrieved units. They were of various shapes and colors; their diameters were of 1–1,000 ȝm. Though full attribution is not achievable, XPS analyses provided information to assume their origins.
Some irregular shaped spots had unique elements, such as Fe or Pb. Spots that contain much more C binding F were assumed to be organic fluorides. Zinc Oxide is a typical white pigment and widely used for thermal control paint. Paint chips were possible origin of the spots containing more Zn than normal surfaces.
PO42-
and K㸩 were found in a spot. Since these ions were considered to be human origin, the water dumped from the transport vehicles was a possible source.
Among the spots, roughly circular spots were considered to be formed by the impact of low-velocity droplets. There was a known source of the droplets; thruster plume. Some of the spot contaminations would be produced by the thruster plume impingement. It is possible that the thick molecular contamination layer had covered up the particles and/or liquid droplet substances on the ram faces. Accordingly, we selected two similar brown, rounded spots from various shaped/colored spots on the wake face of the third unit (Fig. 7) and analyzed their element compositions using XPS. Table 1 presents the elemental compositions of the spots.
Spot A Spot B
Fig. 7 Brown round spots on the wake face of the 3rd retrieved unit
Table 1 Element composition of the brown spots analyzed by XPS [Unit; Atomic %]
C N O F Al Si Ni Zn S
Spot A 45.2 23.1 22.6 2.4 1.1 2.9 2 0.3 0.4 Spot B 45.4 10.2 24.8 11.1 1.3 4.2 1.6 0.7 0.7 Normal a 24.2 4.1 49.1 0.6 3.3 11.1 5.2 0.4 1.1
aThe element composition of the normal surface shows the average of the wake surfaces from the three units.
The nitrogen concentration was remarkably greater than on normal surfaces. The two compositions of the spots were very similar, except for the F and N concentrations. The time of the droplet impingement is unknown. The F concentration would vary according to the thickness of the molecular contamination layer covering the droplet. There would be sufficient time for a droplet deposited long before retrieval to develop an F-rich molecular contamination layer that covers it.
4.2. Contamination Layer thickness
Figure 8 indicates the contamination layer thicknesses of the three units observed by XPS depth profiling. The boundary surface between the contamination layer and the aluminum plates was not sharply defined because of the porous structure of the anodic coatings on the aluminum plates. We considered the depth at which the Si concentration exceeded Al to be the contamination layer thickness. The existence of Ni also indicates the position of the original surface. The Ni that appeared between the SiO2 layer and Al-O layer is attributable to nickel acetate in the sealing agent for the anodic coating. The maximum Ni concentration appeared at almost the same depth with the crossing of Si and Al concentration curves (Fig. 4).
Formation and growth of the SiO2 layer was also observed on several SEED samples and monitoring samples [3],[8],[9].
These SiO2 layer thicknesses were measured using transmission-electron microscope (TEM) or scanning TEM – electron energy loss spectroscopy (STEM-EELS). TEM analyses were performed using H-7100FA (Hitachi, Japan), with an acceleration voltage of 100kV. The samples were prepared by ultramicrotome and RuO4 stained. Figure 9 summarizes the contamination layer thicknesses observed on the three units. The SiO2 layer thicknesses obtained by the TEM cross-sectional observation were 120-140 nm on the third retrieved samples. Though the TEM reported more thicknesses than XPS, the difference in analytical methods prevents equal comparison among the data. XPS depth resolution decrease related with the ion sputter time, because ion etching increase
0 20 40 60 80 100 120
0 500 1000 1500
Exposure Duration ,Days
Contamination Layer Depth ,nm
RAM Si-Al intersection RAM Ni maximum RAM Predicted WAKE Si-Al intersection WAKE Ni maximum WAKE Predicted ᑐᩘ(WAKE Ni i )
Fig. 8 Contamination Layer growth with the exposure duration
the surface roughness, and the etching rate must be affected by the sputtering angle. On account of the surface roughness of the samples, XPS depth resolution is supposed to be not as good as TEM for thicker contamination layer analysis. One data set obtained by a method indicates that the SiO2 layer on a unit has almost even thickness for different positions. Boeing also predicted that the contamination thickness distributes within 8-nm difference on a unit [4].
4.3. Term of deposition
The SiO2 layer was observed more clearly on the ram face; its thickness increased in relation to the exposure duration (Fig. 8). This observation indicates a continuous supply of siloxane, even after a long duration of exposure. About thirty vehicles visited and docked to the ISS while MPAC&SEED was on board (Fig. 10). The vehicles were constructed by flesh materials and considered to have effused more outgassing.
From February 2003 to July 2005, the later half of MPAC&SEED exposure, no module nor truss segment was attached to the ISS owing to suspension of the space shuttle flight. The formation of the SiO2 layer on the ram faces slowed as time progressed, perhaps because of a reduction of the outgassing rates of the source materials on orbit. One analyzed area on the wake face of the first unit had much thicker contamination than other areas on the wake face. This local characteristic was inconsistent with the others; the reason is unclear.
5. Discussion
5.1. Contamination Thickness Versus Color Change Although the contamination layers on the ram faces were much thicker than those on the wake faces, the brown color on the wake faces was deeper than that on the ram. One reason for this might be the magnitude of UV irradiation. Two passive UV monitors were mounted on both the ram and wake faces of each unit. Unexpected results were obtained from the calibration results of the monitoring samples. Data from the second unit suggest that the wake face was irradiated by 13 times more UV than the ram face [3]. The UV fluence on the MPAC&SEED is also calculated using the ISS geometric model and attitudes.
Predicted UV fluence on the wake face was six times more than on the ram face. These results differ in their magnitudes.
However, they are consistent with the optical appearances of the contaminated surfaces.
Thruster-induced contamination is another possible cause of the color difference. Brown coloration, which is inferred to be the result of thruster plume impingements, has been
3rd Unit (1403 days)
2nd Unit (865 days)
1st Unit (315 days)
Contamination Layer Thickness Obtained by TEM or STEM
Contamination Layer Thickness Obtained by XPS Depth Profile
Thickness, nm
200
0 100
Fig. 9 Contamination Thickness observed on the ram face
#1 MPAC&SEED #2
#3 PMA-2 (Shuttle)
FGB (Soyuz) DC-1 (Soyuz, Progress) SM (Progress)
2001/10/15 2002/10/15 2003/10/15 2004/10/15
Fig. 10 Visiting Vehicles Docking Durations
observed commonly on the Mir space station, the space shuttle, and the ISS. Boeing predicted that the wake face would have more thruster-induced contamination than the ram face [4]. The higher nitrogen concentration observed on the wake face confirmed the prediction (Fig. 3). The darker color on the wake face is attributable to the thruster plume.
5.2. Contamination Layer Growth
The observed contamination layer thicknesses on the wake faces were much less than the predicted values. The cause of this difference is explainable by the process of contamination layer formation.
Although C had greater concentrations at the top surfaces, the contamination layers observed on the ram faces were formed mostly from only Si and O. The most likely scenario is selective reaction of Si with AO. In fact, SiO2formation under vacuum-UV (VUV) irradiation is reported often [10]. Because VUV electromagnetic radiation has more energy than the binding energy of C-H or Si-C, VUV separates methyl-group from PDMS [11]. Remaining Si-sites bind to AO and form rigid SiO2. Other atoms, such as C, were rejected or formed volatile molecules, and did not remain on the surface. Although the molecular deposition rate on a cryogenic surface depends strongly on the surface temperature, the maximum temperature recorded on the SM/MPAC&SEED was 60–90°C; sufficiently high to be free from light-molecule deposition.
This scenario indicates that the permanent contamination layer thickness depends on the mass of Si in the contaminants, not on the total mass of contaminants. Table 2 summarizes levels of the outgassing induced contamination predicted by Boeing [4]. The figures do not include thruster plume impingement, which does not contribute to SiO2 formation. The predicted value agrees with the measured SiO2 layer thickness of the order.
However, no significant difference is visible in fragmentary ion counts of PDMS between the ram and wake
faces. It suggests that the wake face also had the siloxane supply.
Table 2 Contamination depth, predicted [4] and measured [Unit; nm]
Unit 1 Unit 2 Unit 3 Ram Predicted 10.6 – 13.5 30.3 – 35.4 45.9 – 53.3
Measured 31, 32 75, 75 93, 93 Wake Predicted 3.5 7.7 – 9.1 12.1 – 14.3
Measured 2, 55 0, 4 2, 2 The difference in AO radiation still poses an eminently plausible hypothesis, although it has not been confirmed by the AO flux measurement on MPAC&SEED. Two passive AO monitors of different types were mounted on both the ram and wake faces [3]. They indicated that AO irradiation on the ram face was 1.3–1.8 times greater than on the wake face. This difference seems to be too small when compared with the observed contamination thicknesses. The AO monitors measure mass loss and the change in electric resistance by AO erosion.
However, thick SiO2 layer was also noted on the AO monitors on the ram face. The AO fluence on the imaginary plane on the ISS ram end was calculated using the MSIS-86 model in JAXA developed Space Environment and Effects System (SEES http://sees.tksc.jaxa.jp). The ISS attitude changes were considered in the analysis. SEES predicted 10 times or more higher fluence than measured values. Even though the analysis did not take into account the screening by the ISS elements, the net AO fluence on the ram face could be much more than the measured value, and explainable the difference in SiO2 layer thicknesses.
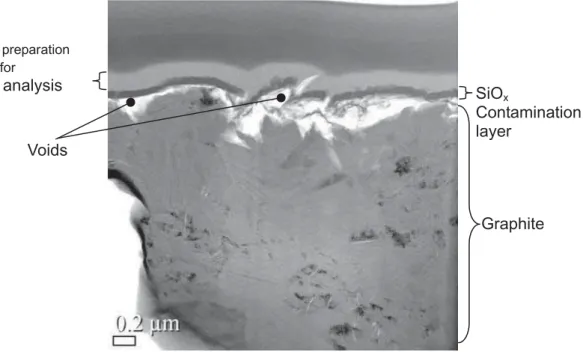
The observed SiO2 layer thicknesses did not depend on the contaminated surface material. In fact, STEM analysis presented a crosscut image of a graphite sample that shows that the SiO2 layer did not conformally trace the original surface.
Figure 11 was obtained using HF-2210 (Hitachi, Japan) with an acceleration voltage of 200kV. Many voids were found under
Sample preparation coating for
STEM analysis SiOx
Contamination layer
Graphite Voids
Fig. 11 Voids observed between SiO2 layer and the original graphite surface
the SiO2 layer covering coarse surfaces, such as the graphite AO monitor or the AO eroded polyimide. This observation suggests that the SiO2 formation process does not require absorption of silicone contaminants on a surface. Under such a SiO2 forming environment, contamination proof surface modifications may not be effective to prevent the contamination layer growth.
5.3. Thruster Plume Impingement
Bipropellant thrusters on the ISS and visiting vehicles are used for reboost and attitude control. Fuel/oxidizer reaction products (FORP) are produced by an unsymmetrical dimethylhydrazine (UDMH) and nitrogen tetroxide (NTO) reaction [12]. The Energia and the Keldysh Center investigated contamination of FORP by ground experiments and sample collection from the Mir space station [13]. They obtained very close figures for the final gross-formula of an organic part of FORP, i.e. C1H3.1N0.8O0.1 by a ground test and C1H2.3N0.8O0.1 by analysis of samples collected on-orbit. Comparing the analyzed data, the elemental composition of the brown circular spots had sufficient compatibility to be attributable to FORP.
6. Conclusion
We retrieved three identical SM/MPAC&SEED units after different exposure durations. The units were covered uniformly with molecular contamination and had numerous colored spots.
Contamination was much thicker on the ram faces than on the wake faces, and increased continuously with the exposure duration. XPS depth profiling revealed that the uniform contamination had a layered structure. Under the thin uppermost layer, which is considered to be terrestrial contamination, a Si- and O-rich layer followed. Within this SiO2 layer, other atoms were barely detected. XPS and TOF-SIMS analysis identified the elements contained in both uniform and spot contamination. Siloxane, which forms rigid SiO2 under AO radiation, was considered to be the dominant contaminant. The SiO2 layer was formed without surface deposition, even on the voids of coarse surfaces. Severe UV irradiation and the repeated thruster plume impingement could cause the deep brown color specifically noted on the wake face.
Brown spots found on the wake faces were presumed to have been formed by FORP impact.
Acknowledgments
The MPAC&SEED project was carried out with the help of Roscosmos and S.P. Korolev Rocket and Space Corporation Energia (RSC Energia). The author would like to express particular gratitude to the following for their help and assistance during the course of this work: Courtney A. Pankop, Kendall Smith, Carlos Soares, and Ronald Mikatarian of the Boeing Company, for performing induced contamination analyses; Igor V. Sorokin and co-workers of RSC Energia for the space environment exposure opportunity. Without their kind assistance, this study would not have been possible.
References
[1] Yamagata, I., Kimoto, Y., Miyazaki, E., Ishizawa, J., Shimamura, H., Baba, N., Imagawa, K., Suzuki, M.,
“Overview of the Micro-Particles Capturer and Space Environment Exposure Device (MPAC&SEED) Experiment,” Proc. of the 10th ISMSE, ESA SP-616, September 2006
[2] Soares, C., Mikatarian, R., Schmidl, D., Smith, K., Pankop, C., Alred, J.W., Boeder, P.A., Pilkinton, G.D., Koontz, S., Engle, M., “Natural and Induced Space Environments Effects on the International Space Station,”
IAC-05-B4.2.07., 2005
[3] Kimoto, Y., Yano, K., Ishizawa, J., Miyazaki, E., Yamagata, I., “Passive Measurement of Atomic Oxygen, UV Fluence and Radiation Effect on the ISS Using SEED Experiment,”
Proc. of the 10th ISMSE, ESA SP-616, September 2006 [4] Pankop, C., Smith, K., Soares, C., Mikatarian, R., Baba, N.,
“Induced contamination onto JAXA’s Micro-Particles Capturer and Space Environment Exposure Device – Comparison of Predictions and Measurements,” Proc. of the 10th ISMSE, ESA SP-616, September 2006
[5] Neish, M.J. Imagawa, K., Inoue, T., Ishizawa, J., Kitazawa, Y., Yamaura, Y., Murakami, A., Ochi, Y., “Microparticle capture on the International Space Station using Aerogel and Polyimide foam,” Proc. of the 9th ISMSE, ESA SP-540, pp.431-435. June 2003
[6] Tozu-Sekiya, M., Takahashi, M., Hirokawa, K., “An Inference of the Fragmentation of Some Organic Compounds in Ga+ Primary Ion TOF-SIMS,”
Hyomen-Kagaku (Surface Science), Vol. 23, No. 11, pp.708-719, 2002
[7] Zwiener, J.M., Kamenetzky, R.R., Vaughn, J.A., Finckenor, M.M., “Contamination observed on the Passive Optical Sample Assembly (POSA)-I experiment,” SPIE Vol. 3427 [8] Ishizawa, J., Mori, K., Imai, F., Yamagata, I., Suzuki, M.,
“Results of the Space-Environment Exposure Experiment
“SM/MPAC&SEED” on the International Space Station (2):
Siloxane Coated Polyimide Films, and Silicone Based Paints and Adhesives,” Proc. of the 10th ISMSE, ESA SP-616, September 2006
[9] Miyazaki, E., Yamagata, I., “Results of the Space-Environment Exposure Experiment
“SM/MPAC&SEED” on the International Space Station:
Flexible Optical Solar Reflector,” Proc. of the 10th ISMSE, ESA SP-616, September 2006
[10] Pippin, G., Crutcher, R., “Contamination on LDEF:
Sources, Distribution, and History,” NASA-CP-3194-PT-3, 1993
[11] Murahara, M., Ogawa, Y., Yoshida, K., Okamoto, Y.,
“Photochemical laminating of low-refractive-index transparent antireflective SiO2 film,” Proc. of SPIE Volume 4932, 2002
[12] Naumov, S.F., Gerasimox, Y.I., Sokolova, S.P., Rebrov, S.G., Gerasimova, T.I., Kalistratova, M.A., Prokofyev, A.V., Grigorevsky, A.V., Prosvirikov, V.M., Buryak, A.K., Chernik, V.N., “Influence Orientation Thrusters Fuel/Oxidizer Reaction Products on Thermo-Optic Properties of Spacecraft Thermal Control Coatings,” Proc.
of the 9th ISMSE, ESA SP-540, September 2003 [13] Rebrov, S.G. and Gerasimov, Y.I., “Investigation of the
Contamination Properties of Bipropellant Thrusters,” AIAA 2001-2818, 35th AIAA Thermophysics Conference
Publication list related SM/MPAC&SEED
[1] Baba, N., Imagawa, K., Neish, M.J., Inoue, T., “External contamination control for JAXA Spacecraft” Proc. of the 24th ISTS, June 2004
[2] Baba, N., Suzuki, M., Yamagata, I., Kimoto, Y., Ishizawa, J.,
“External contamination observed on the Micro-Particles Capturer and Space Environment Exposure Device” Proc. of the 10th ISMSE, ESA SP-616, September 2006
![Fig. 3 Elements composition of uniform contamination analyzed by XPS [Atomic %]](https://thumb-ap.123doks.com/thumbv2/123deta/6801908.2228513/2.892.84.435.194.468/fig-elements-composition-uniform-contamination-analyzed-xps-atomic.webp)