in α‑Pinene Secondary Organic Aerosol Using N2 and CO2 Ion Mobility Mass Spectrometry
Author Yoshiteru Iinuma, Sathiyamurthi Ramasamy, Kei Sato, Agata Kolodziejczyk, Rafal Szmigielski journal or
publication title
Atmosphere
volume 12
number 1
page range 17
year 2020‑12‑24
Publisher MDPI
Rights (C) 2020 The Author(s).
Author's flag publisher
URL http://id.nii.ac.jp/1394/00001749/
doi: info:doi/10.3390/atmos12010017
Creative Commons Attribution 4.0 International(https://creativecommons.org/licenses/by/4.0/)
Article
Structural Characterisation of Dimeric Esters in α-Pinene Secondary Organic Aerosol Using N 2 and CO 2 Ion Mobility Mass Spectrometry
Yoshiteru Iinuma
1,* , Sathiyamurthi Ramasamy
2,†, Kei Sato
2, Agata Kołodziejczyk
3,‡and Rafal Szmigielski
3
Citation:Iinuma, Y.; Ramasamy, S.;
Sato, K.; Kołodziejczyk, A.; Szmigielski, R. Structural Characterisation of Dimeric Esters inα-Pinene Secondary Organic Aerosol Using N2and CO2Ion Mobility Mass Spectrometry.Atmosphere2021, 12, 17. https://dx.doi.org/10.3390/
atmos12010017
Received: 13 November 2020 Accepted: 20 December 2020 Published: 24 December 2020
Publisher’s Note: MDPI stays neu- tral with regard to jurisdictional claims in published maps and institutional affiliations.
Copyright:© 2020 by the authors. Li- censee MDPI, Basel, Switzerland. This article is an open access article distributed under the terms and conditions of the Creative Commons Attribution (CC BY) license (https://creativecommons.org/
licenses/by/4.0/).
1 Okinawa Institute of Science and Technology Graduate University, Onna-son, Okinawa 904-0495, Japan
2 National Institute for Environmental Studies, Tsukuba, Ibaraki 305-8506, Japan; [email protected] or [email protected] (S.R.); [email protected] (K.S.)
3 Institute of Physical Chemistry of the Polish Academy of Sciences, 01-224 Warsaw, Poland;
[email protected] or [email protected] (A.K.); [email protected] (R.S.)
* Correspondence: [email protected]
† Currently Institut de recherches sur la catalyse et l’environnement de Lyon (IRCELYON), 69100 Villeurbanne, France.
‡ Currently at Leibniz-Institut für Troposphärenforschung, D-04318 Leipzig, Germany.
Abstract: The atmospheric oxidation of monoterpenes leads to the formation of secondary organic aerosol (SOA). While numerous works have been carried out in the past to characterise SOA at a molecular level, the structural elucidation of SOA compounds remains challenging owing to the lack of authentic standard compounds. In this work, the structures of
α-pinene originating dimericesters in SOA with m/z 357 (C
17H
25O
8-) and m/z 367 (C
19H
27O
7-) were characterised using UPLC/
ESI(-)IMS-TOFMS
2(ultra-performance liquid chromatography coupled to ion mobility spectrometry tandem time-of-flight mass spectrometry). The measured collision cross-section (Ω
N2) values were compared to theoretically calculated
ΩN2values. Selected product ions of dimeric compounds and the authentic standard compounds of product ions were subjected to CO
2-IMS-TOFMS for more detailed structural characterisation. Our results were consistent with previously reported subunits of the m/z 357 (terpenylic acid and cis-pinic acid), and the m/z 367 (10-hydroxy-cis-pinonic acid and cis-pinic acid) ions. The measured and calculated
ΩN2values of m/z 367 ions further support the conclusion of earlier structural characterisation; however, the structure of the m/z 357 ion remains vague and requires further characterisation studies with a synthesised reference compound.
Keywords: SOA; ion mobility; collision cross-section;
α-pinene SOA dimers; stereochemical assign-ment
1. Introduction
Secondary organic aerosol (SOA) plays an important role in the Earth’s climate system by directly or indirectly influencing the planetary energy budget [1]. Besides affecting air quality by reducing visibility, SOA can also potentially damage human health through the inhalation of ultrafine particles to the deepest part of the lungs [2,3]. Annual SOA production can be as high as 910 TgC yr
−1[4], although this estimation is largely uncertain due to a lack of knowledge about the mechanisms leading to SOA formation [1].
Among various known SOA precursor compounds, monoterpenes have been studied extensively because they are emitted in large amounts with an estimated global emission of 155 Tg yr
−1[5], and their oxidation products are found in fine ambient particles at consid- erable levels [6]. Ambient and laboratory monoterpene SOA compounds reported in the literature include multifunctional carboxylic acids, organosulfates, nitrooxy-organosulfates, highly oxidised organic molecules with peroxy functional groups (HOMs), and dimeric esters [6]. While some of these compounds are firmly identified by comparison to authentic standard compounds, many of them remain structurally uncharacterised due to difficulties
Atmosphere2021,12, 17. https://dx.doi.org/10.3390/atmos12010017 https://www.mdpi.com/journal/atmosphere
associated with the synthesis of standard compounds. This hinders our understanding of underlying processes leading to the formation of monoterpene SOA compounds in the atmosphere.
When no authentic standard compound is available for unambiguous identification of a target compound, tandem mass spectrometry (MS
n) experiments are often performed to obtain a piece of structural information such as the presence of functional groups and structural subunits [7]. While MS
nis a powerful tool, it can lead to different structural matches for the same compound as the technique is highly dependent on instrumental set- tings and the interpretation of the mass spectra; it also does not provide information about three-dimensional conformation [8]. One of the ways to support structural identification is to obtain information about the conformation or shape of an ion using advanced mass spec- trometric data. For this purpose, ion mobility spectrometry coupled to time-of-flight mass spectrometry (IMS-TOFMS) is often used to obtain information about the shape besides the elemental formula of a target ion. The IMS-HRMS measures ion mobility, i.e., drift velocity of an ion in an inert gas under the influence of an electric field. Ion mobility can be related to collisional cross-section (Ω
N2), a physicochemical property related to the shape of an ion in the gas phase. This technique is increasingly used in the structural characterisation of small molecules since the introduction of the first commercial IMS-TOFMS in 2006 [9]. In the field of atmospheric science, IMS-TOFMS is successfully used for the molecular characteri- sation of β -pinene originating organosulfates [10], isoprene originating organosulfates [11], aerosol bound alkyl nitrates [12], classification of atmospherically relevant organic com- pounds [13], aqueous phase oligomerisation of α,β-unsaturated carbonyls and acids [14], separation of highly oxygenated molecules in laboratory-generated α -pinene SOA [15], particle-phase reaction products of α -pinene oxidation [16], and heterogeneous oxidation of organic aerosols [17,18].
Past studies showed that dimeric esters with Mw 358 (C
17H
26O
8) and Mw 368 (C
19H
28O
7) are commonly found in laboratory-generated α-pinene SOA [19–22]. They were also found in fine ambient particles influenced by boreal forest emissions [21,23–26], indicating that they contribute importantly to atmospheric SOA mass. The formation mechanisms of these dimeric esters remain uncertain to date, although several mechanisms are proposed in the literature. These include particle-phase esterification of carboxylic acids such as cis-pinic acid and terpenylic acid leading to Mw 358 [21], a gas phase mechanism involving Criegee intermediates [23], and the formation of RO
3R’ from the reaction of RO
2· and R’O · , and the subsequent decomposition of acyl hydroperoxide groups to form stable esters [19]. Other suggested mechanisms that can lead to dimeric SOA compounds that are not exclusive to Mw 358 and Mw 368 include heterogeneous reactions of aldehydes with hydroperoxides [27,28], and more recently a series of organic peroxy and alkoxy radical cross-reactions at the interface forming dimeric compounds [17]. Recent mass spectrometric studies on α-pinene SOA showed that these dimers consist of diaterpenylic acid and cis-pinic acid for Mw 358 [19–21] and of cis-hydroxyl pinonic acid and cis-pinic acid for Mw 368 [19]. While their monomeric units are unambiguously determined from MS
2data, further structural information is required for the determination of their exact conformations and configuration isomers. Such information is especially important for understanding the mechanisms leading to the formation of these compounds, and their roles in particle growth and SOA formation as the conformation of molecules are vital to the condensation process by their influence in inter- and intra-molecular interactions.
In this study, dimeric compounds with Mw 358 and Mw 368 present in laboratory- generated α -pinene SOA were subjected to detailed structural re-elucidation experiments using IMS-TOFMS. Two types of drift gases were compared for the separation of ions in IMS-TOFMS: nitrogen (N
2) and carbon dioxide (CO
2). It is known that highly polarisable CO
2drift gas has different selectivity from N
2drift gas for smaller ions in IMS, e.g., [29–33].
By using CO
2drift gas, we expected to separate the small product ions of dimeric esters
better in IMS-TOFMS
2, enabling us to gather information about the conformation of
these compounds.
2. Experiments
2.1. α-Pinene/O
3SOA Sample Generation and SOA Standard Compound Synthesis
An α -pinene ozonolysis experiment was conducted in a temperature controllable 6 m
3Teflon
®coated stainless steel chamber (ULVAC, Inc., Chigasaki, Japan) at National Institute of Environmental Studies (NIES), Tsukuba, Japan. Detailed explanation of the chamber setup can be found elsewhere [34–36]. SOA was produced from the reaction of 0.19 ppm of α-pinene and 0.21 ppm of ozone. The SOA sample was collected on 47mm Teflon filter (total 0.21 mg, 1 m
3) and stored below − 22
◦C until sample analysis.
A standard compound of terpenylic acid was synthesised following a method de- scribed in Claeys et al., 2009 [37]. The synthesis methods of cis-pinic acid and cis-norpinic acid can be found in Kołodziejczyk et al., 2019 [38].
2.2. Sample Analysis
A portion (2 × 1 cm diameter punch) of a collected filter was extracted in 1 mL of acetonitrile (QTofMS grade, Fujifilm Wako, Tokyo, Japan) using an orbital shaker. Insoluble debris was removed using a PTFE syringe filter (Millex LG 0.20 µm, Merck, Darmstadt, Germany). The extract was dried using a vacuum concentrator and reconstituted in 200 µ L of 1:1 acetonitrile/ultrapure water (v/v) solution.
Ultra-performance liquid chromatography (UPLC, Acquity I-Class, Waters, MA, USA) equipped with a Waters Acquity UPLC T3 column (2.1 mm × 100 mm, 100Å, 1.8 µ m) was used to separate dimeric esters. The eluent programme used was as follows: 99%
(A) ultrapure water with 0.1% formic acid and 1% (B) acetonitrile for 2 min, raised (B) to 100% (B) in 5.5 min, kept constant for 2.5 min, brought back to the initial condition and equilibrated for 3.5 min. The flow rate of the eluent was 0.4 mLmin
−1, and the injection volume of the sample was 1 µ L. The column temperature was kept at 30
◦C, and the sample compartment was kept at 15
◦C.
The ion mobilities of dimeric esters were measured using electrospray ionisation ion mobility spectrometry time-of-flight mass spectrometry in the negative ion mode (ESI(-)- IMS-QTOFMS, Synapt G2S, Waters). All ions reported in this study are (M-H)
-ions. The operational principle of Synapt G2S ESI-IMS-QTOFMS is as follows: The ions formed in the electrospray ionisation source entered through the entrance orifice to the ion guide, then to the quadrupole mass filter. The filtered or non-filtered ions are passed to the “TriWave”
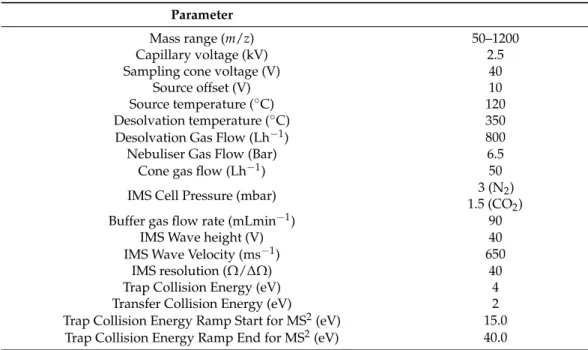
region that consists of a trap ion guide, an ion mobility spectrometer (IMS), and a transfer ion guide. Collision induced dissociation (CID) experiments can be performed in both the trap and transfer ion guides though only the trap was used for CID experiments in this study. This means that a precursor ion and product ions were detected at different drift times, enabling us to obtain collision cross-section (Ω) values of precursor and product ions simultaneously. After the transfer ion guide, the ions were passed into the Time-of-Flight (TOF) analyser and the detector to record m/z values of the ions. The IMS-QTOFMS parameters used for the ion mobility separation are summarised in Table 1.
The purities of the buffer gases used were 99.9995% for N
2made from an N
2generator (KURASEP, Kuraray Chemical, Japan) and 95.5% for CO
2(Iwatani, Japan). The Waters Synapt G2S system was not equipped with a thermostated jacket to keep the drift tube temperature constant. However, our laboratory was kept at 25
◦C to minimise temperature related drift time fluctuation.
To adjust the day-to-day variation of drift times for N
2-IMS and CO
2-IMS, a Waters Ma-
jor Mix IMS/Tof Calibration Kit (Waters, MA, USA) containing standard compounds with
known nitrogen collision cross-section (Ω
N2) values was used. These were acetaminophen
(C
8H
8NO
2-, m/z 150.0555, Ω
N2= 131.5), sulfaguanidine (C
7H
9N
4O
2S
-, m/z 213.0446,
Ω
N2= 145.2), sulfadimethoxine (C
12H
13N
4O
4S
-, m/z 309.0658, Ω
N2= 170.1), and Val-Tyr-
Val (C
19H
28N
3O
5-, m/z 378.2029, Ω
N2= 192.5). In all experimental days, the drift times
of standard compounds stayed the same when the operational conditions were the same
(i.e., no deviation of drift time during the course of the analytical day). It is noted that
Ω
N2measurements using Synapt G2 instruments are highly reproducible, and less than 2%
relative standard deviation (RSD) for Ω
N2values of more than 100 common metabolites is reported from an inter-laboratory comparison study [39].
Table 1. Operating conditions for ESI(-)-IMS-QTOFMS.
Parameter
Mass range (m/z) 50–1200
Capillary voltage (kV) 2.5
Sampling cone voltage (V) 40
Source offset (V) 10
Source temperature (
◦C) 120
Desolvation temperature (
◦C) 350
Desolvation Gas Flow (Lh
−1) 800
Nebuliser Gas Flow (Bar) 6.5
Cone gas flow (Lh
−1) 50
IMS Cell Pressure (mbar) 3 (N
2)
1.5 (CO
2)
Buffer gas flow rate (mLmin
−1) 90
IMS Wave height (V) 40
IMS Wave Velocity (ms
−1) 650
IMS resolution (Ω/∆Ω) 40
Trap Collision Energy (eV) 4
Transfer Collision Energy (eV) 2
Trap Collision Energy Ramp Start for MS
2(eV) 15.0 Trap Collision Energy Ramp End for MS
2(eV) 40.0
ESI(-)-IMS-QTOFMS: electrospray ionisation ion mobility spectrometry time-of-flight mass spectrom- etry in the negative ion mode.The calibration curve for the determination of Ω
N2values was constructed from the measurement of the same calibration standard solution. To obtain Ω
N2values of target analytes, we followed the procedure for Ω
N2calibration curve construction published in Paglia et al., 2014 [39] and Paglia and Astarita, 2017 [40].
2.3. Theoretical Calculation of Collision Cross-Section
Ω
N2values for Mw 358 and Mw 368 dimeric esters, and their MS
2product ions were calculated using N
2-MOBCAL reported by Campuzano et al. [41]. N
2-MOBCAL is based on the MOBCAL developed by Mesleh et al. [42] for the calculation of Ω
Hebased on a He trajectory method. To prepare an input file for the N
2-MOBCAL, we followed a method described in Campuzano et al. [41] except for the initial 2D structural drawing made via ChemDraw Professional ver. 16.0 (PerkinElmer, MA, USA). Owing to the lack of carbon dioxide collision cross-section values (Ω
CO2) for reference compounds, no Ω
CO2values were calculated in this study.
The accuracy of the N
2-MOBCAL for the class of compounds concerned in this study
was assessed from the literature data. Paglia et al., 2014 [39] compared 107 Ω
N2values
of negatively charged ions predicted by N
2-MOBCAL to the measured Ω
N2values deter-
mined by three independent Synapt G2 instruments from different laboratories. Among
their dataset, we selected 13 carboxylic acids (glyceric acid, fumaric acid, succinic acid,
ketoleucine, malic acid, salicylic acid, oxoglutaric acid, mevalonic acid, aconitic acid, ascor-
bic acid, citric acid, glucuronic acid, and gluconic acid) and eight saccharides (fructose,
galactose, glucose, mannose, mannitol, lactose, sucrose, and trehalose) that have the same
functional groups (-OH or -COOH), elements (CHO), and similar m/z values as the com-
pounds studied here for the assessment. In general, the N
2-MOBCAL predicted Ω
N2values
agreed well with the measured Ω
N2values from all three Synapt G2 instruments, with
average relative difference (RD% = (measured Ω − predicted Ω)/(measured Ω)) values
ranging from − 0.1 ± 4.0% to − 1.3 ± 4.3% (µ ± 1σ). Worse RD% values among all data were
found from glyceric acid, fructose, and glucose with RD% of 8.5–9.2, 6.8–10.8, and 6.0–10.1,
respectively. These highly oxygenated compounds (a C/O ratio ≥ 1) may need further
molecular dynamic simulation to accurately represent their molecular conformations, and caution is warranted for the application of N
2-MOBCAL for this class of compounds. Based on this, we concluded that N
2-MOBCAL was suitable for the purpose of this study. In addition to a published dataset, we measured Ω
N2values of cis-norpinic acid, terpenylic acid, and cis-pinic acid, then compared them with N
2-MOBCAL predicted Ω
N2values. The RD% values were 2.4% for terpenylic acid (IMS: 137.7 Å
2, N
2-MOBCAL: 134.4 Å
2), 1.0%
for cis-norpinic acid (IMS: 136.6 Å
2, N
2-MOBCAL: 135.3 Å
2), and 4.5% for cis-pinic acid (IMS: 140.6 Å
2, N
2-MOBCAL: 147.0 Å
2). These RD% values fall within the range of RD%
values obtained from the dataset of Paglia et al., 2014 [39], except for cis-pinic acid. This discrepancy is discussed in a later section.
3. Results and Discussion
3.1. Tandem Mass Spectrometry Analysis of m/z 357 (C
17H
25O
8-) and m/z 367 (C
19H
27O
7-) Ions Figure 1 shows the extracted ion chromatograms (EICs) of m/z 357 (C
17H
25O
8-) and m/z 367 (C
19H
27O
7-) ions detected in a chamber-generated α -pinene/O
3SOA sample.
The EICs showed that no isobaric isomers of these dimers were present in the sample.
Figure 2 shows the high-resolution tandem mass spectrometry data (MS
2) of m/z 357 and m/z 367 ions detected at 4.90 min and 5.41 min, respectively. The MS
2product ions of m/z 357 were m/z 185 (C
9H
13O
4-), m/z 171 (C
8H
11O
4-), m/z 141 (C
8H
13O
2-), and m/z 127 (C
7H
11O
2-). In the MS
2data of m/z 367, product ions detected at a significant level were m/z 199 (C
10H
15O
4-), m/z 185 (C
9H
13O
4-), m/z 167 (C
9H
11O
3-), m/z 141 (C
8H
13O
2-), and m/z 123 (C
8H
11O
-). These product ions were consistent with published data in the literature [19,21,43], although their relative intensities were not the same as the literature data owing to the difference in an MS
2experiment condition in each study. While the product ions were the same, MS
2data alone does not provide sufficient evidence to unambiguously confirm the structures of the two dimers. To obtain further structural information, these ions were subjected to IMS-TOFMS analysis.
Institutional Review Board Statement: Not applicable Informed Consent Statement: Not applicable
Data Availability Statement: The raw data presented in this study are available on request from the corresponding author.
Figure 1
Figure 1. Extracted ion chromatograms (EICs) of m/z 357 (C
17H
25O
8-, top panel) and m/z 367
(C
19H
27O
7-, bottom panel) ions detected in laboratory-generated
α-pinene/O3sample. The time axis
is in minutes.
Figure 2
Figure 2. High-resolution tandem mass spectrometric data of m/z 357 (C
17H
25O
8-, top panel) and m/z 367 (C
19H
27O
7-, bottom panel) ions detected in laboratory-generated
α-pinene/O3sample.
3.2. Ion Mobility Spectrometry Tandem Mass Spectrometry Analysis of m/z 357 (C
17H
25O
8-) and m/z 367 (C
19H
27O
7-) Ions
3.2.1. N
2-IMS-TOFMS
2of m/z 357 (C
17H
25O
8-) Ion
The N
2driftgrams of the major product ions detected in the MS
2experiment of m/z 357 ion are shown in Figure 3. Both Müller et al., 2009 [43] and Kahnt et al., 2018 [19]
attributed the m/z 185 product ion to cis-pinic acid though they assigned the m/z 171 product ion to a different product ion; Müller et al., 2009 [43] assigned it to cis-norpinic acid, whereas Kahnt et al., 2018 [19] assigned it to a diaterpenylic acid. To assign the structures of product ions unambiguously, N
2drift times of cis-pinic acid, cis-norpinic acid, and terpenylic acid was compared to those of product ions (Figure 4). The m/z 185 product ion showed the identical drift time as the standard of cis-pinic acid (1.41), indicating that the product ion was indeed cis-pinic acid. The drift time of the m/z 171 product ion also agreed well with those of m/z 171 producing standard compounds; however, the product ion, cis-norpinic acid, and terpenylic acid produced the same drift time (1.30 msec) and could not be assigned to the definitive structure based on the results from N
2-IMS-QTOFMS
2experiments. To better distinguish cis-norpinic acid and terpenylic acid, the m/z 357 ion and their MS
2product ions were analysed using CO
2as a buffer gas for the ion mobility separation (CO
2-IMS-QTOFMS
2).
Figure 3
Figure 3. N
2-driftgrams of precursor and major product ions originating from m/z 357 ion. The top
panel shows m/z 171 (C
8H
11O
4-), the middle panel shows m/z 185 (C
9H
13O
4-), and the bottom panel
shows m/z 357 (C
17H
25O
8-). The time axis is in milliseconds.
Figure 4
Figure 4. N
2-driftgrams of standard compounds. The top panel shows cis-norpinic acid (m/z 171, C
8H
11O
4-), the middle panel shows terpenylic acid (m/z 171, C
8H
11O
4-), and the bottom panel shows cis-pinic acid (m/z 185, C
9H
13O
4-). The time axis is in milliseconds.
3.2.2. CO
2-IMS-TOFMS
2of m/z 357 (C
17H
25O
8-) Ion
Figure 5 shows the CO
2driftgrams of (a) cis-norpinic acid, (b) terpenylic acid, and (c) cis-pinic acid. As can be seen, the utilisation of a larger and more polarisable CO
2drift gas separated cis-norpinic acid and terpenylic acid well enough, and their drift times can be used for the structural assignment of the m/z 171 product ion. Figure 6 shows the driftgrams of the major product ions detected in the MS
2experiment of m/z 357 ion.
Similar to the N
2-IMS-TOFMS
2experiment, the CO
2drift time of cis-pinic acid was in line with that of the m/z 185 product ion. For the m/z 171 product ion, the CO
2drift time of terpenylic acid matched well with that of the m/z 171 product ion. Note that CO
2drift times were highly reproducible and consistently detected as the same with no deviation. In addition to the main peak, the terpenylic acid and m/z 171 product ion showed a shoulder peak that appeared to encounter another ion. However, the driftgram shown in Figures 5 and 6 were selected ion driftgrams with an m/z 0.02 window; hence it was unlikely that these peaks were contaminated by other ions. One possible explanation for the shoulder peak is that it originated from an open ring structure of terpenylic acid that may have formed in the TriWave region of the instrument. It is known that a travelling wave ion mobility instrument such as Synapt suffers from ion activation due to ion heating, and this causes conformational changes and/or dissociation of the ions to some extent. Further investigation is necessary for the exact cause of the shoulder peak for terpenylic acid and the m/z 171 product ion.
It has been reported that the structure producing the m/z 171 ion from the m/z 357 ion is diaterpenylic acid, which has the non-lactone structure of terpenylic acid [19]. Based on the drift times of the m/z 171 product ion and terpenylic acid, it is likely that the m/z 171 product ion (diaterpenylic acid) led to cyclisation, forming terpenylic acid after collision-induced dissociation during IMS-TOFMS
2experimentation.
While N
2-IMS-TOFMS
2and CO
2-IMS-TOFMS
2experiments provided information about the structures of monomers, they do not provide information about the stereochemi- cal representation of the molecular structure, such as cis-trans isomers or positional isomers.
To assign the stereochemical structure of the m/z 357 ion, measured and theoretical Ω
N2values for previously reported structures were compared, and the results are discussed in
Section 3.3.
Figure 5
Figure 5. CO
2- driftgrams of standard compounds. The top panel shows cis-norpinic acid (m/z 171, C
8H
11O
4-), the middle panel shows terpenylic acid (m/z 171, C
8H
11O
4-), and the bottom panel shows cis-pinic acid (m/z 185, C
9H
13O
4-). The time axis is in milliseconds.
Figure 6
Figure 6. CO
2- driftgrams of precursor and major product ions originating from the m/z 357 ion. The top panel shows m/z 171 (C
8H
11O
4-), the middle panel shows m/z 185 (C
9H
13O
4-), and the bottom panel shows m/z 357 (C
17H
25O
8-). The time axis is in milliseconds.
3.2.3. N
2-IMS-TOFMS
2of the m/z 367 (C
19H
27O
7-) Ion and the Structural Elucidation of the m/z 199 Product Ion from Theoretical and Measured Ω
N2Values
The driftgrams of product ions obtained from N
2-IMS-TOFMS
2experimentation for
the m/z 367 ion are shown in Figure 7. The drift time of the m/z 185 product ion was
identical to that of cis-pinic acid in Figure 3, confirming the presence of cis-pinic acid in
the m/z 367 ion. According to the literature data [19,44], the other product ion detected at
m/z 199 was likely 10-hydroxy-cis-pinonic acid; though no authentic standard compound
was available for the positive identification of the m/z 199 product ion for this study. To
obtain further insights into the structure of the m/z 199 product ion, a comparison was
made between the theoretically calculated Ω
N2value of 10-hydroxy-cis-pinic acid and the
measured Ω
N2value of the m/z 199 product ion.
Figure 7
Figure 7. N
2-driftgrams of precursor and major product ions originating from the m/z 367 ion. The top panel shows m/z 185 (C
9H
13O
4-), the middle panel shows m/z 199 (C
10H
15O
4-), and the bottom panel shows m/z 367 (C
19H
27O
7-). The time axis is in milliseconds.
Table 2 summarises the theoretically calculated Ω
N2values of cis-pinic acid and 10- hydroxy-cis-pinonic acid, and measured Ω
N2values of m/z 185 and m/z 199 product ions from N
2-IMS-TOFMS
2experiment for the m/z 367 ion.
Table 2. Theoretical and measured
ΩN2values of product ions of m/z 367 (C
19H
27O
7-) ion.
Name Formula
m/z ΩN2IMS
ΩN2MOBCAL RD%
(Å
2) (Å
2)
cis-pinic acid C
9H
13O
4-185.0789 140.6 147.0 − 4.5%
cis-pinic acid with an intramolecular hydrogen bond ” ” ” 141.7 − 0.8%
10-Hydroxy-cis-pinonic acid C
10H
15O
4-199.0931 144.3 142.2 1.48%
RD%: relative difference IMS: ion mobility spectrometry;ΩN2: collision cross-section.
For the C
10H
15O
4-product ion, the difference between the theoretical and measured Ω
N2values was within 1.5% relative difference. This agreement further supports the pro- posed structures of 10-hydroxy-cis-pinonic acid for the m/z 199 compound. However, the unambiguous structural identification of the m/z 199 product ion still requires comparison of the Ω
N2and Ω
CO2values between the standard compound of 10-hydroxy-cis-pinonic acid and the m/z 199 product ion, as Ω
N2values may not be sufficiently different for all possible hydroxy-cis-pinonic acid isomers with the -OH group attached to a different position of the carbon skeleton.
Regarding the difference between the predicted and measured Ω
N2values of cis- pinic acid, RD% value was greater than those of terpenylic acid, cis-norpinic acid, and 10- hydroxy-cis-pinic acid. As described in Section 2.3 about the prediction of Ω
N2values, RD%
values of the measured and the predicted Ω
N2values could be larger than 10% for some
of the highly oxygenated compounds, though the C/O ratio of cis-pinic acid was much
lower than 1, and it is unlikely that the predicted Ω
N2value of cis-pinic acid was biased
for this reason. The predicted Ω
N2value of cis-pinic acid became much closer to that of
the measured value when an intra-molecular hydrogen bond between the carboxylate and
carboxylic groups was considered in the modelled structural conformation, indicating the
difficulties of associating with the geometrical optimisation for the prediction of Ω
N2values.
3.3. The Structural and the Comformation Elucidation of m/z 357 and m/z 367 Ions from Theoretical and Measured Values
The theoretical and measured Ω
N2values from N
2-IMS-TOFMS of m/z 357 and 367 ions and their structures considered in this study are summarised in Table 3. In addition to the positional isomers (labelled as 357a, 357b, 367a, and 367b following Kahnt et al., 2018 [19]), we considered (R,R) and (S,S) stereoisomers of m/z 357 ions, and (S,S)(S,S) and (S,S)(R,R) stereoisomers of m/z 367 ions. We note that the m/z 367 ion may have alternative structures that consist of cis-pinic acid and positional isomers of hydroxy-cis- pinonic acid. They were not considered in this study owing to the high computational expenses of Ω
N2prediction. For all modelled structures, theoretical Ω
N2values were much greater than those of measured m/z 357 and m/z 367 ions. As the drift times of product ions from N
2-IMS-TOFMS
2and CO
2-IMS-TOFMS
2experiments agreed very well with authentic standard compounds, it is likely that the discrepancy originates from the conformational isomerism of the m/z 357 and m/z 367 ions. Smaller measured Ω
N2values than the theoretically calculated values suggest that the m/z 357 and m/z 367 ions in the IMS instrument are more spherical in shape than the structures shown in Table 3. To determine the conformation of the m/z 357 and m/z 367 ions, additional conformational candidates were subjected to theoretical Ω
N2calculation. For this purpose, both the dimeric compounds were folded to make a clam shell structure by forming intra-molecular hydrogen bonding between terminal carboxyl groups (Table 4). As expected, the calculated Ω
N2values for the structures with a hydrogen bond became much closer to those of the measured Ω
N2values. Among all the structural candidates, 367bHB(R,R)(S,S) yielded sufficiently small RD of 1.42% to support the structures of the m/z 367 ion. Among all the m/z 357 structures, 357bHB(S)(R,R) resulted in the smallest RD of 2.35%. This supports the structural suggestion by Gao et al. (2010) [22] and Beck and Hoffmann (2016) [20] but contradicts the results of Yasmeen et al. (2010) [21] and Kahnt et al. (2018) [19] in which 357a is suggested as its structure based on the results obtained from LC/MS
2experiments of a methylated m/z 357 ion. While the theoretical Ω
N2value of the m/z 357 ion supports the structure of 357b, the RD value over 2% is larger than the acceptance criterion of the calibration of the Ω
N2values for the instrument [45] and it remains too unclear for conclusive structural elucidation. Further stereochemical assignment study using the authentic standard compound is warranted to unambiguously elucidate the structure of the m/z 357 ion.
Table 3. Structures and
ΩN2values of m/z 357 and m/z 367 ions considered in this study. The ditto mark (”) indicates the formula or number is the same as above.
Abbreviation Structure
m/z ΩN2IMS
ΩN2MOBCAL RD%
(Å
2) (Å
2)
357a(R,R)
Atmosphere 2021, 12, x FOR PEER REVIEW 11 of 17
Table 3. Structures and Ω
N2values of m/z 357 and m/z 367 ions considered in this study. The ditto mark (”) indicates the formula or number is the same as above.
Abbreviation Structure
m/zΩ
N2IMS Ω
N2MOBCAL RD%
(Å
2) (Å
2)
357a(R,R) C
17H
25O
8-357.1549 178.6 191.4 6.91%
357a(S,S) ” ” ” 209.8 16.07%
357b(S,S) ” ” ” 195.1 8.83%
357b(R,R) ” ” ” 196.1 9.36%
367a(S,S)(S,S) C
19H
27O
7-367.1757 182.5 216.4 16.99%
C
17H
25O
8-357.1549 178.6 191.4 6.91%
357a(S,S)
Atmosphere 2021, 12, x FOR PEER REVIEW 11 of 17
Table 3. Structures and Ω
N2values of m/z 357 and m/z 367 ions considered in this study. The ditto mark (”) indicates the formula or number is the same as above.
Abbreviation Structure
m/zΩ
N2IMS Ω
N2MOBCAL RD%
(Å
2) (Å
2)
357a(R,R) C
17H
25O
8-357.1549 178.6 191.4 6.91%
357a(S,S) ” ” ” 209.8 16.07%
357b(S,S) ” ” ” 195.1 8.83%
357b(R,R) ” ” ” 196.1 9.36%
367a(S,S)(S,S) C
19H
27O
7-367.1757 182.5 216.4 16.99%
” ” ” 209.8 16.07%
Atmosphere2021,12, 17 11 of 15
Table 3. Cont.
Abbreviation Structure
m/z ΩN2IMS
ΩN2MOBCAL RD%
(Å
2) (Å
2)
357b(S,S)
Table 3. Structures and Ω
N2values of m/z 357 and m/z 367 ions considered in this study. The ditto mark (”) indicates the formula or number is the same as above.
Abbreviation Structure
m/zΩ
N2IMS Ω
N2MOBCAL RD%
(Å
2) (Å
2)
357a(R,R) C
17H
25O
8-357.1549 178.6 191.4 6.91%
357a(S,S) ” ” ” 209.8 16.07%
357b(S,S) ” ” ” 195.1 8.83%
357b(R,R) ” ” ” 196.1 9.36%
367a(S,S)(S,S) C
19H
27O
7-367.1757 182.5 216.4 16.99%
” ” ” 195.1 8.83%
357b(R,R)
Table 3. Structures and Ω
N2values of m/z 357 and m/z 367 ions considered in this study. The ditto mark (”) indicates the formula or number is the same as above.
Abbreviation Structure
m/zΩ
N2IMS Ω
N2MOBCAL RD%
(Å
2) (Å
2)
357a(R,R) C
17H
25O
8-357.1549 178.6 191.4 6.91%
357a(S,S) ” ” ” 209.8 16.07%
357b(S,S) ” ” ” 195.1 8.83%
357b(R,R) ” ” ” 196.1 9.36%
367a(S,S)(S,S) C
19H
27O
7-367.1757 182.5 216.4 16.99%
” ” ” 196.1 9.36%
367a(S,S)(S,S)
Table 3. Structures and Ω
N2values of m/z 357 and m/z 367 ions considered in this study. The ditto mark (”) indicates the formula or number is the same as above.
Abbreviation Structure
m/zΩ
N2IMS Ω
N2MOBCAL RD%
(Å
2) (Å
2)
357a(R,R) C
17H
25O
8-357.1549 178.6 191.4 6.91%
357a(S,S) ” ” ” 209.8 16.07%
357b(S,S) ” ” ” 195.1 8.83%
357b(R,R) ” ” ” 196.1 9.36%
367a(S,S)(S,S) C
19H
27C O
197H
-27O 367.1757
7-367.1757 182.5 182.5 216.4 216.4 16.99% 16.99%
367a(S,S)(R,R)
Atmosphere 2021, 12, x FOR PEER REVIEW 12 of 17
367a(S,S)(R,R) ” ” ” 227.5 21.93%
367b(S,S)(R,R) ” ” ” 205.7 11.95%
367b(S,S)(S,S) ” ” ” 201.1 9.69%
Table 4. Structures and Ω
N2values of m/z 357 and m/z 367 ions with an intra-molecular hydrogen bond considered in this study.
Abbreviation Structure
m/zΩ
N2IMS Ω
N2MOBCAL RD%
(Å
2) (Å
2)
357aHB(R)(S,S) C
17H
25O
8-357.1549 178.6 188.2 5.27%
357aHB(R)(R,R) ” ” ” 205.0 13.76%
” ” ” 227.5 21.93%
367b(S,S)(R,R)
Atmosphere 2021, 12, x FOR PEER REVIEW 12 of 17
367a(S,S)(R,R) ” ” ” 227.5 21.93%
367b(S,S)(R,R) ” ” ” 205.7 11.95%
367b(S,S)(S,S) ” ” ” 201.1 9.69%
Table 4. Structures and Ω
N2values of m/z 357 and m/z 367 ions with an intra-molecular hydrogen bond considered in this study.
Abbreviation Structure
m/zΩ
N2IMS Ω
N2MOBCAL RD%
(Å
2) (Å
2)
357aHB(R)(S,S) C
17H
25O
8-357.1549 178.6 188.2 5.27%
357aHB(R)(R,R) ” ” ” 205.0 13.76%
” ” ” 205.7 11.95%
367b(S,S)(S,S)
Atmosphere 2021, 12, x FOR PEER REVIEW 12 of 17
367a(S,S)(R,R) ” ” ” 227.5 21.93%
367b(S,S)(R,R) ” ” ” 205.7 11.95%
367b(S,S)(S,S) ” ” ” 201.1 9.69%
Table 4. Structures and Ω
N2values of m/z 357 and m/z 367 ions with an intra-molecular hydrogen bond considered in this study.
Abbreviation Structure
m/zΩ
N2IMS Ω
N2MOBCAL RD%
(Å
2) (Å
2)
357aHB(R)(S,S) C
17H
25O
8-357.1549 178.6 188.2 5.27%
357aHB(R)(R,R) ” ” ” 205.0 13.76%
” ” ” 201.1 9.69%
Table 4. Structures and
ΩN2values of m/z 357 and m/z 367 ions with an intra-molecular hydrogen bond considered in this study.
Abbreviation Structure
m/z ΩN2IMS
ΩN2MOBCAL RD%
(Å
2) (Å
2)
357aHB(R)(S,S)
Atmosphere 2021, 12, x FOR PEER REVIEW 12 of 17
367a(S,S)(R,R) ” ” ” 227.5 21.93%
367b(S,S)(R,R) ” ” ” 205.7 11.95%
367b(S,S)(S,S) ” ” ” 201.1 9.69%
Table 4. Structures and Ω
N2values of m/z 357 and m/z 367 ions with an intra-molecular hydrogen bond considered in this study.
Abbreviation Structure
m/zΩ
N2IMS Ω
N2MOBCAL RD%
(Å
2) (Å
2)
357aHB(R)(S,S) C
17H
25O
8-357.1549 178.6 188.2 5.27%
357aHB(R)(R,R) ” ” ” 205.0 13.76%
C
17H
25O
8-357.1549 178.6 188.2 5.27%
Atmosphere2021,12, 17 12 of 15
Table 4. Cont.
Abbreviation Structure
m/z ΩN2IMS
ΩN2MOBCAL RD%
(Å
2) (Å
2)
357aHB(R)(R,R)
367a(S,S)(R,R) ” ” ” 227.5 21.93%
367b(S,S)(R,R) ” ” ” 205.7 11.95%
367b(S,S)(S,S) ” ” ” 201.1 9.69%
Table 4. Structures and Ω
N2values of m/z 357 and m/z 367 ions with an intra-molecular hydrogen bond considered in this study.
Abbreviation Structure
m/zΩ
N2IMS Ω
N2MOBCAL RD%
(Å
2) (Å
2)
357aHB(R)(S,S) C
17H
25O
8-357.1549 178.6 188.2 5.27%
357aHB(R)(R,R) ” ” ” ” ” ” 205.0 205.0 13.76% 13.76%
357bHB(R)(R,R)
Atmosphere 2021, 12, x FOR PEER REVIEW 13 of 17
357bHB(R)(R,R) ” ” ” 182.8 2.35%
357bHB(S)(S,S) ” ” ” 198.4 10.50%
367aHB(S,S)(R,R) C
19H
27O
7-367.1757 182.5 192.2 5.19%
367aHB(R,R)(R,R) ” ” ” 193.0 5.56%
367bHB(R,R)(R,R) ” ” ” 185.1 1.42%
” ” ” 182.8 2.35%
357bHB(S)(S,S)
Atmosphere 2021, 12, x FOR PEER REVIEW 13 of 17
357bHB(R)(R,R) ” ” ” 182.8 2.35%
357bHB(S)(S,S) ” ” ” 198.4 10.50%
367aHB(S,S)(R,R) C
19H
27O
7-367.1757 182.5 192.2 5.19%
367aHB(R,R)(R,R) ” ” ” 193.0 5.56%
367bHB(R,R)(R,R) ” ” ” 185.1 1.42%
” ” ” 198.4 10.50%
367aHB(S,S)(R,R)
Atmosphere 2021, 12, x FOR PEER REVIEW 13 of 17
357bHB(R)(R,R) ” ” ” 182.8 2.35%
357bHB(S)(S,S) ” ” ” 198.4 10.50%
367aHB(S,S)(R,R) C
19H
27O
7-367.1757 182.5 192.2 5.19%
367aHB(R,R)(R,R) ” ” ” 193.0 5.56%
367bHB(R,R)(R,R) ” ” ” 185.1 1.42%
C
19H
27O
7-367.1757 182.5 192.2 5.19%
367aHB(R,R)(R,R)
Atmosphere 2021, 12, x FOR PEER REVIEW 13 of 17
357bHB(R)(R,R) ” ” ” 182.8 2.35%
357bHB(S)(S,S) ” ” ” 198.4 10.50%
367aHB(S,S)(R,R) C
19H
27O
7-367.1757 182.5 192.2 5.19%
367aHB(R,R)(R,R) ” ” ” 193.0 5.56%
367bHB(R,R)(R,R) ” ” ” 185.1 1.42%
” ” ” 193.0 5.56%
367bHB(R,R)(R,R)
Atmosphere 2021, 12, x FOR PEER REVIEW 13 of 17
357bHB(R)(R,R) ” ” ” 182.8 2.35%
357bHB(S)(S,S) ” ” ” 198.4 10.50%
367aHB(S,S)(R,R) C
19H
27O
7-367.1757 182.5 192.2 5.19%
367aHB(R,R)(R,R) ” ” ” 193.0 5.56%
367bHB(R,R)(R,R) ” ” ” ” ” ” 185.1 185.1 1.42% 1.42%
367bHB(R,R)(S,S)
Atmosphere 2021, 12, x FOR PEER REVIEW 14 of 17