Full Terms & Conditions of access and use can be found at
http://www.tandfonline.com/action/journalInformation?journalCode=iceh20
Download by: [61.22.70.32] Date: 14 September 2015, At: 16:29
Clinical and Experimental Hypertension
ISSN: 1064-1963 (Print) 1525-6006 (Online) Journal homepage: http://www.tandfonline.com/loi/iceh20
Association between the severity of coronary artery stenosis and the combination of the
difference in blood pressure between arms and brachial-ankle pulse wave velocity
Yuiko Miyase, Shin-ichiro Miura, Yuhei Shiga, Masaya Yano, Yasunori Suematsu, Sen Adachi, Kenji Norimatsu, Ayumi Nakamura & Keijiro Saku
To cite this article: Yuiko Miyase, Shin-ichiro Miura, Yuhei Shiga, Masaya Yano, Yasunori Suematsu, Sen Adachi, Kenji Norimatsu, Ayumi Nakamura & Keijiro Saku (2015): Association between the severity of coronary artery stenosis and the combination of the difference in blood pressure between arms and brachial-ankle pulse wave velocity, Clinical and Experimental Hypertension
To link to this article: http://dx.doi.org/10.3109/10641963.2015.1060987 Published online: 11 Sep 2015.
Submit your article to this journal
View related articles
View Crossmark data
ISSN: 1064-1963 (print), 1525-6006 (electronic)
Clin Exp Hypertens, Early Online: 1–8
!2015 Taylor & Francis Group, LLC. DOI: 10.3109/10641963.2015.1060987
Association between the severity of coronary artery stenosis and the combination of the difference in blood pressure between arms and brachial-ankle pulse wave velocity
Yuiko Miyase1, Shin-ichiro Miura1,2, Yuhei Shiga1, Masaya Yano1, Yasunori Suematsu1, Sen Adachi1, Kenji Norimatsu1, Ayumi Nakamura1, and Keijiro Saku1,2
1Department of Cardiology and2Department of Molecular Cardiovascular Therapeutics, Fukuoka University School of Medicine, Fukuoka, Japan
Abstract
Background: A difference in systolic blood pressure (SBP) 10 mmHg between the arms is associated with an increased risk of coronary artery disease (CAD) and mortality in high-risk patients.Methods and results: Four hundred and fourteen patients were divided into three groups according to the percent most severe luminal narrowing of a coronary artery as diagnosed by coronary computed tomography angiography: no or mild coronary stenosis (0–49%), moderate stenosis (50–69%) and severe stenosis (70%) groups. The relative difference in SBP between arms in the severe group was significantly lower than those in the no or mild and moderate groups. The brachial-ankle pulse wave velocity (baPWV) significantly increased as the severity of coronary stenosis increased. We confirmed that severe coronary stenosis was independently associated with both the relative difference in SBP between arms and baPWV, in addition to age, gender, hypertension, dyslipidemia, diabetes mellitus and ankle- brachial index by a logistic regression analysis. The group with a relative difference in SBP between arms of51 mmHg and baPWV1613 cm/s showed a higher percentage of patients with severe coronary stenosis than groups that met neither or only one of these criteria.
Conclusion: The combination of the relative difference in SBP between arms and baPWV may be a more effective approach for the non-invasive assessment of the severity of CAD.
Keywords
Brachial-ankle pulse wave velocity, coronary computed tomography angiography, coronary stenosis, coronary artery disease, difference in blood pressure between arms
History
Received 12 March 2015 Revised 18 May 2015 Accepted 23 May 2015
Published online 1 September 2015
Introduction
A difference in systolic blood pressure (SBP) between arms has been linked to peripheral vascular disease, cerebrovascu- lar disease and cardiovascular mortality (1–4), and is most commonly observed in patients with hypertension (HTN) (5), diabetes mellitus (DM) (6) and chronic renal disease (CKD) (7). The presence of an inter-arm difference has been associated with the delayed diagnosis (8) and poor control of HTN (9), and bilateral BP should be measured for the assessment of HTN (10,11). Recent studies have shown that a difference in SBP of 10 mmHg between the arms is associated with an increased risk of coronary artery disease (CAD) mortality in high-risk patients (5,12,13). Despite these associations, the value of differences in BP between arms and between the lower limbs for predicting the presence and severity of CAD is still not well-established.
Brachial ankle pulse wave velocity (baPWV) can be automatically obtained with non-invasive devices and is currently a conventional measurement for evaluating arterial stiffness in a clinical setting (14). Many studies have
demonstrated that baPWV predicts cardiovascular events in a general population or in patients with HTN, DM, end-stage renal failure or acute coronary syndrome (15–19). Thus, baPWV is a non-invasive means for predicting cardiovascular events. Coronary computed tomography angiography (CTA) has become more widely available in many general hospitals and enables the assessment of coronary artery stenosis (20), calcification (21) and plaque imaging (22) for the diagnosis of CAD. Therefore, we hypothesized that a difference between right (rt.) and left (lt.) BP could be associated with the severity of CAD, and evaluated the relationship between differences in BP between arms and the severity of coronary stenosis in patients who underwent CTA. Moreover, we determined whether a difference in BP could be used in addition to baPWV for predicting the severity of CAD.
Methods
Study population
A total of 414 consecutive patients who were clinically suspected of having CAD, and who had at least one cardiac risk factor or who had an abnormality in their electrocardio- gram, such as ST depression, negative T wave or left bundle branch block, were enrolled in this study. All patients underwent CTA and an assessment of baPWV. We excluded Correspondence: Shin-ichiro Miura, Department of Cardiology, Fukuoka
University School of Medicine, 7-45-1 Nanakuma, Jonan-ku, Fukuoka, 814-0180, Japan. Tel: +81-92-801-1011. Fax: +81-91-865-2692. E-mail:
Downloaded by [61.22.70.32] at 16:29 14 September 2015
patients with acute coronary syndrome, peripheral artery disease or CKD with hemodialysis. The protocol in this study was approved by the ethics committee of Fukuoka University Hospital [IRB No. 11-06(09-089)] and registered under UMIN000016641, and all subjects gave their written informed consent to participate.
Evaluation of coronary stenosis using multi-detector row computed tomography
We evaluated coronary stenosis using multi-detector row computed tomography (MDCT) as described previously (23).
Three hundred and seventeen patients underwent MDCT were scanned by 64-MDCT on an Aquilion 64 (TOSHIBA, Tokyo, Japan), and 97 patients who underwent MDCT were scanned by 320-MDCT on an Aquilion ONE ViSION (TOSHIBA, Tokyo, Japan). The use of b-blockers and nitroglycerine before scanning was left to the physician’s discretion. When we used the first MDCT, a 70-mL bolus of contrast medium was injected at a flow rate of 3.6 mL/s, followed by 35 mL contrast agent and 30 mL saline solution, each at a flow of 1.8 mL/s, with a dual injector. With the second MDCT, 21.5 mg iodine /kg/s contrast medium equivalent for the patient’s body weight0.7 mL was injected at 10 s fixed, followed by 35 mL contrast agent and 30 mL saline solution, each at a flow of 1.8 mL/s, with a dual injector.
The region of interest was placed within the ascending aorta, and the scan was started when the CT density reached 100 Hounsfield Units higher than the baseline CT density.
The scan was performed between the tracheal bifurcation and diaphragm with the following parameters: 64-MDCT-colli- mation width 0.5 mm, rotation speed 0.4 s/rotation, tube voltage 135 kV and effective tube current 360 mA; 320- MDCT-collimation width 0.5 mm, rotation speed 0.275 s/rotation, tube voltage 120 kV and auto tube current.
All segments were assessed according to the 15-segment American Heart Association (AHA) coronary artery model (24). Overall, 15 coronary artery segments were assessed in each of the 414 patients (total 6210). Of these 6210 segments, 104 (1.7%) and 23 (0.4%) segments could not be evaluated by MDCT because of severe calcification or motion artifacts, respectively, and we used 6083 segments (98.0%) for further analysis. The most severe narrowing of the normal contrast- enhanced lumen of a coronary artery that could be identified in multiple reconstructions or cross-sectional images was defined and the percentage of coronary stenosis was analyzed.
Evaluation of cardiovascular risk factors
Body mass index (BMI), SBP, diastolic BP (DBP), serum levels of total cholesterol, triglycerides (TG), high-density lipoprotein cholesterol (HDL-C), low-density lipoprotein cholesterol (LDL-C), creatinine (Cr), estimated glomerular filtration rate (eGFR), uric acid (UA), random blood glucose (BG) and hemoglobin A1c (HbA1c), smoking status (current versus non-smokers), family history (myocardial infarction, angina pectoris or sudden death) and medication use were collected as cardiovascular risk factors in all patients. In all the subjects, we also measured the visceral fat area (VFA), subcutaneous fat area (SFA) and waist circumference as components of metabolic syndrome (MetS).
BP was determined as the mean of two measurements obtained in an office setting by the conventional cuff method using a mercury sphygmomanometer. Chronic kidney disease (CKD) was defined as an eGFR560 ml/min. The patients’
characteristics were obtained from medical records with regard to the history of HTN, dyslipidemia (DL), DM, history of smoking (past and current smokers) and medication use.
Patients who had a current SBP/diastolic BP (DBP)140/
90 mmHg or who were receiving antihypertensive therapy were considered to have HTN. Patients with LDL- C140 mg/dl, TG150 mg/dl and/or HDL-C540 mg/dl, or who were receiving lipid-lowering therapy, were con- sidered to have DL. Patients with random BG200 mg, fasting BG126 mg, HbA1c6.5% or who were taking a glucose-lowering drug were considered to have DM.
Hyperuricemia (HU) was defined as a serum UA level7.0 mg/dl or the use of UA-lowering drugs. For the measurement of VFA, SFA and waist circumference, CT scan was performed. These values were measured from CT cross- sectional scans at the level of the umbilicus using software (Fat Scan; N2 System, Hyogo, Japan).
Measurements of baPWV, ankle brachial index and BP in the arms
The baPWV and ABI were measured while each subject was supine, using a volume-plethysmographic device (PWV/ABI;
Colin Co., Aichi, Japan) (25). The following equation was used to obtain baPWV:baPWV¼[La (the path length from the suprasternal notch to the ankle) Lb (the path length from the suprasternal notch to the brachium)/DTba (the time interval between the brachium and ankle). In all studies, baPWV was obtained after at least 5 min of rest. We measured BP in the arms and lower limbs using a volume-plethysmo- graphic device and calculated the absolute (jrt. BPlt. BPj) and relative (rt. BPlt. BP) differences in SBP and DBP between arms.
Statistical analysis
Statistical analysis was performed using Excel 2010 (SSRI;
Tokyo, Japan) and the Stat View statistical software package (Stat View 5; SAS Institute Inc., Cary, NC). Data are shown as the mean ± standard error (SE). Categorical and continuous variables were compared between the groups by a2analysis and Student’s t-test, respectively. A multivariate analysis was performed using a logistic regression analysis for independent variables that were related to severe coronary stenosis. A receiver-operating characteristic (ROC) curve analysis was used to determine the cut-off values of lt.
baPWV and the relative SBP between arms to distinguish between no or mild and severe stenosis at the highest possible sensitivity and specificity. A value ofp50.05 was considered significant.
Results
Patient baseline clinical characteristics and various parameters
The patients were divided into three groups according to the percent most severe luminal narrowing of a coronary artery as
2 Y. Miyase et al. Clin Exp Hypertens, Early Online: 1–8
Downloaded by [61.22.70.32] at 16:29 14 September 2015
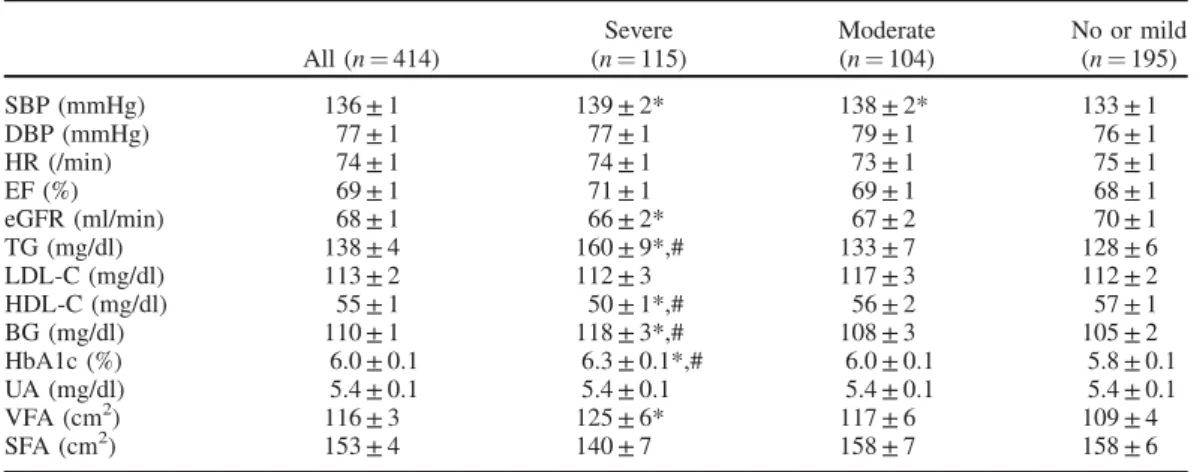
diagnosed by CTA: no or mild coronary stenosis (0–49%), moderate stenosis (50–69%) and severe stenosis (70%) groups. Table 1 shows the baseline clinical characteristics of the 414 patients in the three groups. The percentages of patients in the no or mild, moderate and severe groups were 47% (n¼195), 25% (n¼104) and 28% (n¼115), respect- ively. The overall patients consisted of 219 (53%) male and 195 (47%) female. In the severe group, the percentages of HTN, DL, DM, CKD and smoking were 86, 78, 42, 19 and 57%, respectively, which were significantly higher than those in the no or mild group. In addition, the percentages of angiotensin II receptor blocker (ARB)/angiotensin-converting enzyme inhibitor (ACEI),b-blocker, calcium channel blocker (CCB), statin, biguanide, sulfonylurea (SU) and dipeptidyl peptidase-4 inhibitor (DPP4-I) in the severe group were 54, 14, 45, 42, 17, 14 and 18%, respectively, which were higher than those in the no or mild group. SBP, TG, BG, HbA1c and VFA in the severe group were significantly higher than those in the no or mild group (Table 2). The severe group showed significantly lower levels of HDL-C and eGFR.
baPWV and ABI
Rt. baPWV, lt. baPWV and mean baPVW [(rt. baPWV + lt.
baPWV)/2] in the moderate and severe groups were significantly higher than those in the no or mild group (Table 3). Rt. ABI and lt. ABI in the severe group were significantly lower than those in the no or mild group.
Rt. and Lt. SBP and DBP in the Arms
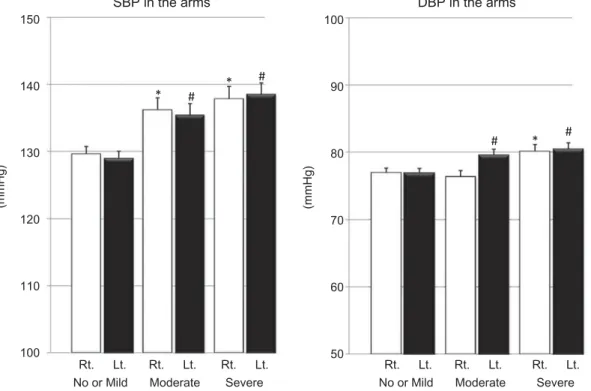
Rt. and lt. SBP in the arms in the moderate and severe groups were significantly higher than those in the no or mild group (Figure 1). Lt. DBP in the arms in the moderate and severe groups, and rt. DBP in the arms in the severe group, were significantly higher than those in the no or mild group. Both SBP and DBP in the rt. and lt. (p for trend50.05) arms significantly rose as the severity of coronary stenosis increased.
Absolute and relative differences in SBP and DBP between the arms
The relative difference in SBP, but not DBP, between the arms in the severe group was significantly lower than those in the no or mild and moderate groups (Figure 2). On the other hand, there were no associations between the absolute differences in BP between the arms among the three groups.
Association between the number of diseased vessels with significant stenosis (VD) or significant coronary stenosis in the left anterior descending artery (LAD) and the relative difference in SBP between arms and/
or baPWV
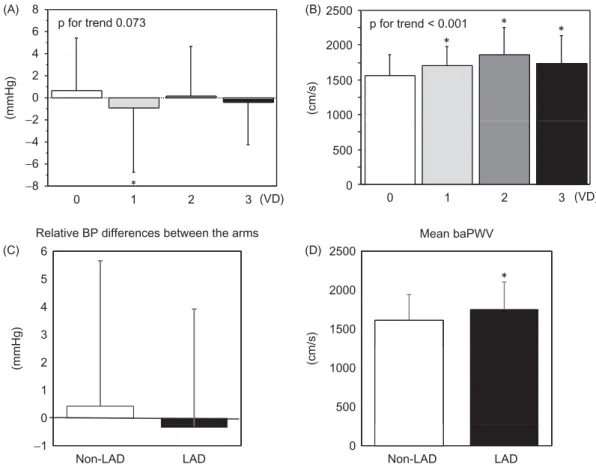
As shown in Figure 3, baPWV significantly increased as the number of VD increased, while the relative difference in SBP between arms did not decrease as VD increased. In addition, we divided the patients into two groups; those who had significant coronary stenosis in the LAD (LAD group) and those who did not (non-LAD group). The LAD group showed a significantly higher baPWV than the non-LAD group, whereas there was no difference in the relative difference in SBP between arms between the groups.
baPWV and ABI
baPWV significantly increased as the severity of coronary stenosis increased (pfor trend50.0001) (Figure 4). Mean ABI in the severe group was not significantly lower than that in the no or mild and moderate groups.
Predictors of severe coronary stenosis
To confirm the parameters that predicted the presence of severe coronary stenosis in comparison to the no or mild coronary stenosis group, we performed a logistic regression analysis using independent variables [relative difference in SBP between the arms, mean baPWV, rt. ABI and lt. ABI, in addition to conventional risk factors (age, gender, VFA, HTN, DL, DM, smoking and CKD)] that were related to severe Table 1. Baseline clinical characteristics in all patients, no or mild, moderate and severe coronary stenosis groups.
All (n¼414) Severe (n¼115) Moderate (n¼104) No or mild (n¼195)
Age (years) 65.4 ± 0.6 68.7 ± 0.9*,# 67.9 ±1.0* 62.2 ± 0.9
Male,n(%) 219 (53) 76 (66)* 54 (52) 89 (46)
BMI (kg/m2) 24.0 ± 0.2 24.0 ± 0.4 23.8 ± 0.3 24.1 ± 0.3
HTN,n(%) 292 (71) 99 (86)*,# 76 (73)* 117 (60)
DL,n(%) 273 (66) 90 (78)*,# 67 (64) 116 (60)
DM,n(%) 96 (23) 48 (42)*,# 18 (17) 30 (15)
HU,n(%) 57 (14) 17 (15) 18 (17) 22 (12)
CKD,n(%) 58 (14) 22 (19)* 16 (15) 20 (10)
Smoking,n(%) 178 (43) 65 (57)* 43 (41) 70 (36)
Medication
ARB/ACE-I,n(%) 166 (40) 62 (54)* 43 (41) 61 (31)
b-Blocker,n(%) 44 (11) 16 (14)* 15 (14)* 13 (7)
CCB,n(%) 149 (36) 51 (45)* 42 (40)* 56 (29)
Diuretics,n(%) 41 (10) 10 (9) 13 (13) 18 (9)
Statin,n(%) 139 (34) 48 (42)* 39 (38) 52 (27)
EPA,n(%) 11 (3) 4 (4) 4 (4) 3 (2)
SU,n(%) 30 (7) 19 (17)*,# 4 (4) 7 (4)
Biguanide,n(%) 29 (7) 16 (14)*,# 3 (3) 10 (5)
DPP4-I,n(%) 45 (11) 21 (18)* 10 (10) 14 (7)
EPA, eicosapentaenoic acid.
*p50.05 versus no or mild stenosis; #p50.05 versus moderate stenosis.
Downloaded by [61.22.70.32] at 16:29 14 September 2015
coronary stenosis (Table 4). The severe group was independ- ently associated with a relative difference in SBP between the arms, baPWV and rt. ABI, in addition to age, gender, HTN, DL and DM.
Comparison of patients in the no or mild and severe stenosis groups
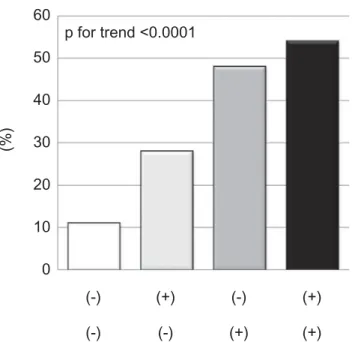
An ROC curve analysis showed a higher area under the curve for a relative difference in SBP between the arms (0.578) and baPWV (0.695). The cut-off levels for the relative difference in SBP between the arms and baPWV with the greatest sensitivity and specificity for the diagnosis of severe CAD were 1 mmHg (sensitivity 0.472, specificity 0.643) and 1613 cm/s (sensitivity 0.636, specificity 0.687), respectively. Using these two cut-off levels, we divided the patients into four groups; a relative difference in SBP between arms 1 mmHg and baPWV 51613 cm/s, a relative difference in SBP between arms 51 mmHg and baPWV51613 cm/s, a relative difference in SBP between arms 1 mmHg and baPWV1613 cm/s, a relative difference in SBP between arms 51 mmHg and baPWV1613 cm/s (Figure 5). The figure shows the per- centages of patients with severe coronary stenosis as determined by this analysis in the no or mild and severe stenosis groups. The group with a relative difference in SBP between arms51 mmHg and baPWV1613 cm/s showed a higher percentage of patients with severe coronary stenosis than groups that met neither or only one of these criteria (pfor trend50.0001).
Discussion
In the present study, we investigated the relationship between differences in BP between the arms and the severity of
coronary artery stenosis, and determined whether the differ- ences in BP could be used in addition to baPWV for predicting the severity of coronary stenosis.
We found that a lower relative difference in SBP between arms; baPWV and rt. ABI in addition to conventional coronary risk factors (age, male, HTN, DL and DM) were independently associated with severe coronary stenosis.
Generally, little attention is paid to a difference in BP between arms as a risk marker for severe coronary stenosis.
Although some studies have shown a correlation between a difference in SBP between the arms and central or peripheral vascular disease or mortality (1–4), this is the first study to evaluate the relationship between a difference in SBP between arms and the severity of CAD. Finally, we concluded that the combination of a relative difference in SBP between the arms and baPWV may be a better approach to the non-invasive assessment of the severity of coronary stenosis than either of these alone, although a higher level of baPWV is known to be a powerful predictor of cardiovascular events and the severity of CAD, and baPWV can be a risk stratification index for predicting the prognosis in clinical practice (15–19). Both factors baPWV and a difference in BP between the arms, become worse as atherosclerosis progressed. In this study, since a relative difference in SBP between arms was not completely associated with baPWV (r¼0.007,p¼0.887) in all patients, the role of a relative difference in SBP between arms might be much different from that of baPWV in the progression of atherosclerosis.
Generally, BP in the right arm is several mmHg higher than that in the left arm. A previous study reported that, in 1000 normotensive subjects, 70% showed higher pressures in the right arm and only 6% had higher pressures in the left arm (26). In this study, we found that a lower relative difference in Table 2. Various parameters in all patients, no or mild, moderate and severe stenosis groups.
All (n¼414)
Severe (n¼115)
Moderate (n¼104)
No or mild (n¼195)
SBP (mmHg) 136 ± 1 139 ± 2* 138 ± 2* 133 ± 1
DBP (mmHg) 77 ± 1 77 ± 1 79 ± 1 76 ± 1
HR (/min) 74 ± 1 74 ± 1 73 ± 1 75 ± 1
EF (%) 69 ± 1 71 ± 1 69 ± 1 68 ± 1
eGFR (ml/min) 68 ± 1 66 ± 2* 67 ± 2 70 ± 1
TG (mg/dl) 138 ± 4 160 ± 9*,# 133 ± 7 128 ± 6
LDL-C (mg/dl) 113 ± 2 112 ± 3 117 ± 3 112 ± 2
HDL-C (mg/dl) 55 ± 1 50 ± 1*,# 56 ± 2 57 ± 1
BG (mg/dl) 110 ± 1 118 ± 3*,# 108 ± 3 105 ± 2
HbA1c (%) 6.0 ± 0.1 6.3 ± 0.1*,# 6.0 ± 0.1 5.8 ± 0.1
UA (mg/dl) 5.4 ± 0.1 5.4 ± 0.1 5.4 ± 0.1 5.4 ± 0.1
VFA (cm2) 116 ± 3 125 ± 6* 117 ± 6 109 ± 4
SFA (cm2) 153 ± 4 140 ± 7 158 ± 7 158 ± 6
HR, heart rate; EF, ejection fraction.
*p50.05 versus no or mild stenosis; #p50.05 versus moderate stenosis.
Table 3. baPWV and ABI in all patients, no or mild, moderate and severe stenosis groups.
All (n¼414) Severe (n¼115) Moderate (n¼104) No or mild (n¼195)
Rt. baPWV (cm/s) 1669 ± 17 1788 ± 34* 1736 ± 34* 1562 ± 22
Lt. baPWV (cm/s) 1672 ± 17 1784 ± 35* 1749 ± 36* 1565 ± 21
Mean baPWV (cm/s) 1670 ± 17 1786 ± 34* 1743 ± 35* 1564 ± 21
Rt. ABI 1.14 ± 0.004 1.12 ± 0.009* 1.15 ± 0.008 1.15 ± 0.006
Lt. ABI 1.13 ± 0.004 1.11 ± 0.010* 1.13 ± 0.008 1.14 ± 0.006
Mean ABI 1.13 ± 0.005 1.12 ± 0.009 1.14 ± 0.007 1.15 ± 0.005
*p50.05 versus no or mild stenosis.
4 Y. Miyase et al. Clin Exp Hypertens, Early Online: 1–8
Downloaded by [61.22.70.32] at 16:29 14 September 2015
SBP between the arms, i.e. higher left-arm pressure, was associated with severe coronary stenosis. It is widely known that BP is lower in the arm on the side with advanced arteriosclerosis (or atherosclerosis) and such an inter-arm difference significantly widens as arteriosclerosis advances.
Some studies have revealed that there is also a high
prevalence of an inter-arm difference in subclavian steal syndrome (27–30) and the severity of stenosis has been associated with the size of the BP difference (31). However, a difference in SBP between arms has historically been dismissed as a normal variant (32,33). Although a previous study proposed an anatomical explanation regarding a Absolute BP differences between the arms
5 2.5
Relative BP differences between the arms
4.5 1.5
2
(mmHg) (mmHg)
4
0.5 1
3 3.5
−0.5 0
2.5 −1.5
−1
2 −2.5
−2
* No or Mild
SBP DBP SBP DBP SBP DBP
Moderate Severe No or Mild
SBP DBP SBP DBP SBP DBP
Moderate Severe
Figure 2. Absolute and relative differences in SBP or DBP between the arms in the no or mild, moderate and severe coronary stenosis groups. *p50.05 versus the no or mild and moderate stenosis groups.
SBP in the arms
150 100
DBP in the arms
140 *
* #
# 90
(mmHg) (mmHg)
* #
130 #
120
80
70
110 60
100
Rt. Lt. Rt. Lt. Rt. Lt. 50
No or Mild Moderate Severe
Rt. Lt. Rt. Lt. Rt. Lt.
No or Mild Moderate Severe
Figure 1. Blood pressure in the arms in the no or mild, moderate and severe coronary stenosis groups. *p50.05 versus rt. BP in the no or mild stenosis group. #p50.05 versus lt. BP in the no or mild stenosis group.
Downloaded by [61.22.70.32] at 16:29 14 September 2015
difference in SBP between arms (34), the reason for higher left-arm pressures is still not clear. We have thought that a
normal anatomy alone cannot explain the correlation between a lower relative difference in SBP between the arms and the 6
8
(A) (B)
(C) (D)
Relative BP differences between the arms Mean baPWV
2000 2500
(cm/s)(cm/s)
p for trend < 0.001 p for trend 0.073
*
* *
0 2 4
1000 1500
−8
−6
−4
−2
0 1 2 3 (VD)
0 500
0 1 3 (VD)
*
6 2500
2 Relative BP differences between the arms Mean baPWV
3 4 5
1500 2000
(mmHg)(mmHg)
*
0 1 2
500 1000
−1 0
LAD
Non-LAD Non-LAD LAD
Figure 3. Association between the VD or significant coronary stenosis in the LAD and the relative difference in SBP between arms and/or mean baPWV. *p50.05 versus the 0 VD or Non-LAD.
Mean baPWV Mean ABI
1.3 2000 1.4
*
Not significant.
(cm/s)
1.2 1800
1.1 1400
1600
1
1200
0.8 0.9
1000
No or Mild Moderate Severe No or Mild Moderate Severe
*
Figure 4. Mean baPWV and mean ABI in the no or mild, moderate and severe coronary stenosis groups. *p50.05 versus the no or mild stenosis group.
6 Y. Miyase et al. Clin Exp Hypertens, Early Online: 1–8
Downloaded by [61.22.70.32] at 16:29 14 September 2015
severity of CAD. Nevertheless, in our study, the severe coronary stenosis group had a high proportion of patients with higher left-arm pressures. Further studies will be needed to clarify this point.
We found that a relative difference in SBP between arms was associated with the severity of CAD, whereas there was no relationship between an absolute difference in SBP between arms and the severity of CAD. In this study, the prevalence of an absolute difference in SBP between arms of 10 mmHg or15 mmHg was 3.4 and 1.2% respectively, and these values were much lower than those in previous studies (7.1–7.8%, 9.7%) (2,16). This low prevalence of an inter-arm SBP difference of 10 mmHg or 15 mmHg may have affected the clinical outcome in this study. In addition, 66% of all patients in this study showed a relative difference in SBP
between arms of51 mmHg, and the percentages of patients who had a relative difference in SBP between arms of 51 mmHg in the severe, moderate and no or mild groups were 74, 63 and 63%, respectively. Although the greatest sensitivity and specificity for the diagnosis of severe CAD were not very high, the relative difference in SBP between arms was an independent predictor of severe coronary stenosis. To confirm the significance of the two cut-off values (a relative difference in SBP between arms of 51 mmHg and baPWV1613 cm/s), prospective studies will be needed to analyze the association between the two cut-off values and cardiovascular events.
Among conventional risk factors, age, gender, HTN, DL, DM, baPWV and rt. ABI were independent predictors of severe coronary stenosis in this study. The associations between age, HTN and DM and severe coronary stenosis were particularly strong. Although we previously reported that the level of HDL-C, but not LDL-C, predicted the presence or severity of CAD (35), HDL-C in the severe coronary stenosis group was significantly lower than those in the no or mild and moderate groups. In addition, mean baPWV and rt. ABI were independent predictors of severe coronary stenosis, and there was no association between mean baPWV and rt. ABI (r¼0.024,p¼0.631). This result may be reasonable because a higher mean baPWV and lower ABI are separately associated with the progression of atherosclerosis.
Moreover, these results indicated that the patients in this study did not represent any specific patient group.
Study limitations
First, the study was cross-sectional. Second, non-invasive measurements were performed after treatment for HTN. Many of the patients were taking antihypertensive medications that might have affected the inter-arm BP difference. CAD patients were understandably taking more medications than non-CAD patients. Third, although coronary stenosis with severe coronary calcification was not evaluated using MDCT, recent studies have shown that both the sensitivity and specificity of MDCT for the identification of significant coronary stenosis were approximately 95%, compared with invasive coronary angiography (36). In this study, we could evaluate 98% of all segments.
Conclusions
We found that a lower relative difference in SBP between arms and baPWV were independently associated with severe coronary stenosis. The combination of relative differences in SBP between the arms and baPWV may be a better approach for the non-invasive assessment of the severity of CAD than either method alone.
Declaration of interest
The authors report no conflicts of interest. The authors alone are responsible for the content and writing of this article.
K.S. is a Chief Director and S.M. is a Director of NPO Clinical and Applied Science, Fukuoka, Japan. K.S. has an Endowed ‘‘Department of Molecular Cardiovascular Therapeutics’’ supported by MSD, Co. LTD. S.M. belongs 50
60
(%)
p for trend <0.0001
30 40
10 20
0
(-) (+)
(+) (+) (+)
(-) (-)
(-)
Figure 5. The percentages of patients with severe coronary stenosis as determined by the cut-off levels for the relative difference in SBP between the arms and baPWV in the no or mild and severe stenosis groups.
Table 4. Predictors for the severe coronary stenosis.
Factors OR (95% CI) pvalue
Age 1.05 (1.02–1.09) 0.005
Gender (male) 2.88 (1.39–5.95) 0.004
HTN 2.87 (1.38–6.00) 0.005
DL 2.37 (1.19–4.74) 0.014
DM 2.98 (1.52–5.85) 0.002
Smoking 1.76 (0.87–3.56) 0.116
CKD 1.71 (0.74–3.99) 0.212
Mean baPWV 1.001 (1.000–1.002) 0.017
Relative differences in SBP between the arms
0.93 (0.87–0.99) 0.014
Rt. ABI 0.024 (0.001–0.714) 0.031
Lt. ABI 1.01 (0.99–1.04) 0.346
VFA 0.10 (0.99–1.00) 0.185
OR, odds ratio; CI, confidence interval; ABI, ankle-brachial index.
Downloaded by [61.22.70.32] at 16:29 14 September 2015
to the Department of Molecular Cardiovascular Therapeutics, which is supported by MSD, Co. LTD.
References
1. Clark CE, Taylor RS, Shore AC, et al. Association of a difference in systolic blood pressure between arms with vascular disease and mortality: a systematic review and meta-analysis. Lancet 2012;379:
905–14.
2. Weinberg I, Gona P, O’Donnell CJ, et al. The systolic blood pressure difference between arms and cardiovascular disease in the Framingham Heart Study. Am J Med 2014;127:209–15.
3. Su HM, Lin TH, Hsu PC, et al. Association of interarm systolic blood pressure difference with atherosclerosis and left ventricular hypertrophy. PLoS One 2012;7:e41173.
4. Clark CE, Campbell JL, Powell RJ, Thompson JF. The inter-arm blood pressure difference and peripheral vascular disease: cross- sectional study. Fam Pract 2007;24:420–6.
5. Clark CE, Taylor RS, Shore AC, Campbell JL. The difference in blood pressure readings between arms and survival: primary care cohort study. BMJ 2012;344:e1327.
6. Clark CE, Greaves CJ, Evans PH, et al. Inter-arm blood pressure difference in type 2 diabetes: a barrier to effective management? Br J Gen Pract 2009;59:428–32.
7. Agarwal R, Bunaye Z, Bekele DM. Prognostic significance of between-arm blood pressure differences. Hypertension 2008;51:
657–62.
8. Banks MJ, Erb N, George P, et al. Hypertension is not a disease of the left arm: a difficult diagnosis of hypertension in Takayasu’s arteritis. J Hum Hypertens 2001;15:573–5.
9. Aboyans V, Criqui MH, McDermott MM, et al. The vital prognosis of subclavian stenosis. J Am Coll Cardiol 2007;49:1540–5.
10. Chobanian AV, Bakris GL, Black HR, et al. Seventh report of the Joint National Committee on Prevention, Detection, Evaluation, and Treatment of High Blood Pressure. Hypertension 2003;42:
1206–52.
11. Shimamoto K, Ando K, Fujita T, et al. The Japanese Society of Hypertension Guidelines for the Management of Hypertension (JSH 2014). Hypertens Res 2014;37:253–390.
12. Clark CE, Campbell JL, Powell RJ. The interarm blood pressure difference as predictor of cardiovascular events in patients with hypertension in primary care: cohort study. J Hum Hypertens 2007;
21:633–8.
13. White J, Mortensen LH, Kivimaki M, et al. Interarm differences in systolic blood pressure and mortality among US army veterans:
aetiological associations and risk prediction in the Vietnam experience study. Eur J Prev Cardiol 2014;21:1394–400.
14. Kawai T, Ohishi M, Takeya Y, et al. Carotid plaque score and intima media thickness as predictors of stroke and mortality in hypertensive patients. Hypertens Res 2013;36:902–9.
15. Munakata M, Konno S, Miura Y, Yoshinaga K. Prognostic significance of the brachial-ankle pulse wave velocity in patients with essential hypertension: final results of the J-TOPP study.
Hypertens Res 2012;35:839–42.
16. Yoshida M, Mita T, Yamamoto R, et al. Combination of the Framingham risk score and carotid intima-media thickness improves the prediction of cardiovascular events in patients with type 2 diabetes. Diabetes Care 2012;35:178–80.
17. Tomiyama H, Koji Y, Yambe M, et al. Brachial – ankle pulse wave velocity is a simple and independent predictor of progno- sis in patients with acute coronary syndrome. Circ J 2005;69:
815–22.
18. Laurent S, Boutouyrie P, Asmar R, et al. Aortic stiffness is an independent predictor of all-cause and cardiovascular mortality in hypertensive patients. Hypertension 2001;37:1236–41.
19. Guerin AP, Blacher J, Pannier B, et al. Impact of aortic stiffness attenuation on survival of patients in end-stage renal failure.
Circulation 2001;103:987–92.
20. Rumberger JA, Sheedy 3rd PF, Breen JF, Schwartz RS. Coronary calcium, as determined by electron beam computed tomography, and coronary disease on arteriogram. Effect of patient’s sex on diagnosis. Circulation 1995;91:1363–7.
21. Nitta K, Akiba T, Suzuki K, et al. Assessment of coronary artery calcification in hemodialysis patients using multi-detector spiral CT scan. Hypertens Res 2004;27:527–33.
22. Achenbach S, Ropers D, Hoffmann U, et al. Assessment of coronary remodeling in stenotic and nonstenotic coronary athero- sclerotic lesions by multidetector spiral computed tomography. J Am Coll Cardiol 2004;43:842–7.
23. Mitsutake R, Niimura H, Miura S, et al. Clinical significance of the coronary calcification score by multidetector row computed tomography for the evaluation of coronary stenosis in Japanese patients. Circ J 2006;70:1122–7.
24. Dodge Jr JT, Brown BG, Bolson EL, Dodge HT. Intrathoracic spatial location of specified coronary segments on the normal human heart. Applications in quantitative arteriography, assessment of regional risk and contraction, and anatomic display. Circulation 1988;78:1167–80.
25. Mitsutake R, Miura S, Saku K. Association between coronary artery calcification score as assessed by multi-detector row computed tomography and upstroke time of pulse wave. Intern Med 2007;46:1833–6.
26. Amsterdam B, Amsterdam A. Disparity in blood pressures in both arms in normals and hypertensives and its clinical significance. A study of 1000 normals and 272 hypertensives. NY State J Med 1943;43:2294–300.
27. Hennerici M, Klemm C, Rautenberg W. The subclavian steal phenomenon: a common vascular disorder with rare neurologic deficits. Neurology 1988;38:669–73.
28. Lawson JD, Petracek MR, Buckspan GS, Dean RH. Subclavian steal: review of the clinical manifestations. South Med J 1979;72:
1369–73.
29. Aboyans V, Kamineni A, Allison MA, et al. The epidemiology of subclavian stenosis and its association with markers of subclinical atherosclerosis: the Multi-Ethnic Study of Atherosclerosis (MESA).
Atherosclerosis 2010;211:266–70.
30. Baribeau Y, Westbrook BM, Charlesworth DC, et al.
Brachial gradient in cardiac surgical patients. Circulation 2002;
106:I11–13.
31. Tan TY, Schminke U, Lien LM, Tegeler CH. Subclavian steal syndrome: can the blood pressure difference between arms predict the severity of steal?. J Neuroimaging 2002;12:131–5.
32. Clark CE, Campbell JL, Evans PH, Millward A. Prevalence and clinical implications of the inter-arm blood pressure difference: A systematic review. J Hum Hypertens 2006;20:923–31.
33. Okada H, Fukui M, Tanaka M, et al. A difference in systolic blood pressure between arms and between lower limbs is a novel risk marker for diabetic nephropathy in patients with type 2 diabetes.
Hypertens Res 2013;36:403–7.
34. O’Shea JC, Murphy MB. Ambulatory blood pressure monitoring:
which arm? J Hum Hypertens 2000;14:227–30.
35. Shiga Y, Miura S, Mitsutake R, et al. Significance of serum high- density lipoprotein cholesterol levels for diagnosis of coron- ary stenosis as determined by MDCT in patients with sus- pected coronary artery disease. J Atheroscler Thromb 2010;17:
870–8.
36. Ropers D, Rixe J, Anders K, et al. Usefulness of multidetector row spiral computed tomography with 64- x 0.6-mm collimation and 330-ms rotation for the noninvasive detection of significant coronary artery stenoses. Am J Cardiol 2006;97:343–8.
8 Y. Miyase et al. Clin Exp Hypertens, Early Online: 1–8
Downloaded by [61.22.70.32] at 16:29 14 September 2015