42
International review for spatial planning and sustainable development, Vol.2 No.1 (2014), 42-62 ISSN: 2187-3666 (online)
DOI: http://dx.doi.org/10.14246/irspsd.2.1_42
Copyright@SPSD Press from 2010, SPSD Press, Kanazawa
Assessing the Social and Economic Vulnerability of Urban Areas to Disasters: A case study in Beijing, China
Xiaolu Gao1, Haihong Yuan1, 2*, Wei Qi1, 2, Shenghe Liu1
1 Key Laboratory of Regional Sustainable Development Modeling, Institute of Geographic Sciences and Natural Resources Research, China
2 University of Chinese Academy of Sciences, China
*Corresponding Author, Email:[email protected] Received 12 June 2013; Accepted 3 November 2013
Key words: Population vulnerability, Economic vulnerability, Assessment model, Haidian district
Abstract: For urban areas with complicated functions and facing rapidly increasing exposure to disaster risks, reducing vulnerability is the most effective way to alleviate damages and losses, which requires first and foremost precise assessment of the social and economic system’s vulnerability. Considering the strong variations of social and economic factors by location and convenience for emergency management, it is very important to take small blocks as the basic spatial unit for vulnerability assessment. However, thus far appropriate evaluation method at such scale is quite inadequate in terms of theoretical framework, data acquisition method and analytical model. Taking Haidian district in Beijing as an example, a set of models was developed to solve these problems. Day and night population estimation model, population vulnerability assessment model, economic scale model, and economic vulnerability assessment model were designed to assess the population and economic vulnerability of urban areas. Results of the case study in Beijing demonstrated the population and economic vulnerability of each block in the study area, and suggested a difference between daytime and nighttime. The hotpots of high vulnerability were also identified and the land use characteristics and function agglomeration of these areas were discussed.
Clearly, these results provided an important base for making effective disaster prevention plan and emergency management.
1. INTRODUCTION
In 2010, Beijing has a total of 19.61 million residential populations (Zhu, 2012). It is a mega-city with a huge size and increasingly complex urban structures. In the rapid urbanization process of China, Beijing is the most attractive place in north China where population and industries consistently agglomerate, which has brought about large-scale urban expansion.
Nonetheless, Beijing is located in disaster-prone areas (Wang, 2008). This situation brings many potential factors that could contribute to disasters, such as high population density, overcrowded and unsafe living environment, pollution and garbage, hazardous industries, under-developed and complicated lifeline system, environmental deterioration, poverty and inequality, and a huge temporary population (mostly consists of low-skilled migrant workers). All these factors make Beijing very vulnerable to disasters.
Like Beijing, most cities in China face high and rapidly increasing exposure to natural hazards and the risks of public safety events, calling for in-time and effective countermeasures. However, as revealed by catastrophes such as SARS, 2008 Wenchuan earthquake, 2010 Zhouqu Large debris flow, and 2010 Yushu earthquake, there are still many obstacles for the implementation of effective control and prevention strategies over public safety events (Wang, 2012). One of the main obstacles is inadequate studies on the uncertainty of public safety events, on the formation, transition and chaining of disasters, and on disaster forecasting and precaution. As these problems are hard to be solved for the time being, reducing disaster vulnerability is recognized as a more direct and effective way to reduce disaster risks.
Besides the vulnerability of infrastructure and physical environments, that of social and economic system is an essential part of disaster risk assessment.
It may provide crucial information necessary for emergency management and making recovery plans, because risk reduction and disaster preparedness to hazards require the precise assessment of vulnerability of different places, people and industries (Birkmann, 2006).
A review of literature indicates that vulnerability has as many as a dozen different definitions, depending on the purpose and perspective of research (Cutter et al., 2003). No consensus has been achieved on what should and should not be included in vulnerability assessment, and different evaluation models were used by researchers, planners, and disaster managers (Alaghi, 2012). While definitions and approaches diverse, it is commonly agreed that vulnerability should take into account of exposure, sensitivity, and the capacity to adapt to perturbations or stresses. Exposure is the nature and degree to which a system experiences perturbations or stresses. Sensitivity is the predisposition and degree to which a system is modified or affected (Adger, 2006; Field et al., 2012). Adaptive capacity the ability or capacity or resilience of the system to cope, adapt or recover from the effects of hazardous conditions. In general, a system which is more exposed and sensitive to disasters is more vulnerable, and vice versa, one with higher adaptive capacity less vulnerable (Smit and Wandel, 2006). In this paper, we define population vulnerability as the state of susceptibility for population to be harmed from exposure to disasters and economic vulnerability as the potential loss from disasters.
Many studies have been conducted on social vulnerability and a variety of indices and approaches at different scales were proposed. For example, Adger et al. (2004) developed predictive indicators of vulnerability at the national level and made country comparisons; Cutter et al. (2003), Cutter and Finch (2008), and Fekete (2010) presented county-level social vulnerability indices to natural hazards. In contrast, Rygel et al. (2006), Granger et al. (1999) and Dwyer et al. (2004) have elaborated social vulnerability at census block, community, and even household levels. It is noticed that the selection of spatial scale was largely determined by availability of data at the concerned scale. Moreover, if the basic study unit was too large, it is usually hard to provide practical information to emergency management.
Significant progress has been made in recent years on economic analysis of disasters, such as modeling for and empirical analysis on the economic impact of disasters (Okuyama, 2007; Rose, 2004; Tierney, 1997; Wagner and Neshat, 2010). The theoretical assessment of economic vulnerability has also been addressed, despite relatively small number of researches (Chang, 2002;
Wagner and Bode, 2006; Hiete and Merz, 2009). Empirical studies on
economic vulnerability have mainly focused on business vulnerability (Zhang et al., 2009), and economic system’s vulnerability at regional scale such as islands (Adrianto and Matsuda, 2002) and national scale (Saldaña-Zorrilla, 2006), but few have been conducted at small scale within cities. To some extent, this reflected the view that the economic system is interrelated and the direct and indirect effects of disasters on economic system are not limited to a predefined scope like a city. But still, we think that evaluation of economic vulnerability at a local scale is highly meaningful from the perspective of emergency management and mitigation of direct damages.
Social vulnerability is most often described using the characteristics of people (Cutter et al., 2003), and since people are the core and the main hazard-bearing bodies of the human social system, this paper conducts study on population vulnerability directly.
For Chinese cities, the assessment of social (population) and economic vulnerability is a relatively new research theme. Some studies were conducted (Xu, 1998; Ge et.al., 2005; Lin, 2007; Du et.al., 2008; Zhang et al., 2012; Nie, 2012;Shi, 2013), however , most studies had been carried out on highly aggregated spatial units in the form of administrative units like district, town, county, and prefecture (Zhou et al., 2009; Lou et al., 2009 ; Chen et al., 2012;
Shi, 2013). Although they helped in understanding the social and economic vulnerability to disasters at national and regional level, such over-aggregated scale may obscures the different impacts of disasters on population and economy within the affected region (Zhang et al., 2009). Therefore, wherever strong spatial variation in vulnerability exists, micro-scale analysis is indispensable (Turner, 2003). Doubtlessly, this is the case for large metropolitan areas such as Beijing.
In this paper, we attempt to conduct a micro-scale assessment on the social and economic vulnerability of urban areas. We intend to develop some new theoretical framework, data acquisition methods and analytical models.
2. DATA AND METHODOLOGY 2.1 The study area and data
With the support of Beijing Institute of Surveying and Mapping (BISP) on detailed spatial data, we selected Haidian, one of the 16 administrative districts in Beijing as the study area. The district covers an area of 431 km2, and is located in north-west Beijing, with the southern part being built-up areas and the northern part hilly mountain areas. The district has 29 lower level administrative units, called Jiedaos and townships, where the basic population and economic statistics were publicized.
(1) The definition of spatial unit
Appropriate scale should be predicated upon research goals. In order to identify the vulnerable places, people, and industries in urban areas as well as to draw useful implications for relevant policies, we took blocks as the basic spatial unit of this study, considering that blocks, which are confined by urban roads, constitute the basic unit of urban fabric and the smallest component in urban planning and spatial governance.
To focus on urban areas, the northern part of the district which was mostly forest and agricultural land use was taken out from the study area.
Then, with ArcGIS application, the study area was divided by urban roads into
647 blocks.
(2) Data for population vulnerability assessment
For population vulnerability assessment, permanent resident population data of Haidian district from the sixth national census in 2010, and employment data from the second Economic Census Yearbook were used.
According to the age classification, infant and aging people referred to children under 4 years old and people above 60 respectively. In addition, population related to schools, hospitals, and tourism from the Statistic Yearbook of Haidian District in 2010, and land use survey data were employed. The daily numbers of tourists, outpatient and hospitalization population were calculated with the annual average.
As most data were aggregated at district or Jiedao scales, we used a population estimation model to calculate the block-level data. To do so, spatial data on buildings, including floor area and usage, and on hospitals, nursery, primary and secondary schools, nursing home, and land use map provided by BISP were used. The detailed information of buildings was used to estimate the population of blocks from that of larger scales.
(3) Data for economic vulnerability assessment
Lack of appropriate data is a big difficulty for economic vulnerability assessment. Only a limited part of economic data was available from statistic books, including GDP of the district, total assets of industries, education and professional levels of employees, water and electricity consumption of each Jiedao, and the total amount of transportation infrastructure in the district. In 2010, Beijing had also publicized the input-output table of 42 industrial sectors.
The above data were helpful for identifying the relative importance and interaction of various industrial sectors. However, as most data were aggregated at district or Jiedao scales, spatial attributes were deficient. To solve this problem, we used the data of registered enterprises in Beijing Haidian district in 2010.The dataset included 138,380 firms and provided a wide range of information including annual turnover, total assets, number of employees, registered capital, industry code (in two-, three- and four-digit), ownership type, founding time, and location. The enterprises were mapped as a point layer by the geo-coding function of ArcGIS (Fig.1).
Screening the original data, we found that data of some firms were incomplete. Therefore, we tested the distribution of founding time and location of enterprises with incomplete attribute data. If they were randomly distributed over time and space, the records with incomplete data could just be removed. If not, a conditional mean imputation could be employed, i.e.
stratified the firms according to predictor variables such as industrial type and enterprise scale, then replaced the missing value of firms with the average value of the layer to which they belong. Previous study of Mao (2005) showed that conditions mean imputation was suitable if missing data rate was 20% - 30 %, which is alike the missing data rate of our dataset.
Figure 1. Distribution of enterprises in Haidian district, Beijing
2.2 Method for population vulnerability assessment
Presumably, population vulnerability differs across person and varies over space and time. Therefore, we evaluated it from three dimensions:
demographic feature, space and time. Specifically, which groups of people are vulnerable, the difference of day and night, and the spatial distribution of population were considered.
Three steps were followed to conduct population vulnerability assessment. Firstly, theoretical indicator framework for population vulnerability assessment was established. Secondly, the day and night population of each spatial unit were calculated. Then, the population vulnerability of each unit was evaluated.
(1) Indicators of population vulnerability
Vulnerable population groups were defined, including females, who are generally less strong than males; the elderly over 65, whose mobility and physical function of bodies decline; minors under 16, whose mental and physical development are immature; the sick, whose physical functions are worse than healthy people; unemployed and poorly educated people, who get fewer organized assistance and are usually from low income families. When it comes to the population vulnerability of megacities in China, we also need to consider floating (temporary) population and population density.
Accordingly, an indicator system composed by physiological, social and spatial aspects was constructed as shown in Fig. 2. The sub-indicators of physiological factors include gender, age and health. As a result, eleven sub-indicators were included.
Figure 2. The indicator system of population vulnerability assessment
(2) Method for calculating day and night population
Spatial distribution of the population changes significantly between day and night, and across different land use types, we already have the night resident population data, and we need to calculate the daytime population, here we introduced population disaggregate model to solve this problem.
Urban land uses in this paper were divided into 15 subtypes, including urban residential land, industrial land, mining land, warehouse space etc., additionally, we paid special attention to 7 types of space where the vulnerable populations were located, such as hospitals, kindergartens, and nursing homes.
The basic idea of population disaggregate modeling is: (1) for people inside buildings, per capita land use was assumed to be the same on land of the same type. Then, given the area of per capita land use for certain land use type (employee population divided by the construction area) and the gross floor area of buildings (provided by building database), we can get the population of the buildings; (2) for people in the tourist attractions, we also assumed that per capita land use is identical. Then given per capita land use area of tourist attractions and the area of scenic spots, we can calculate the tourism population; (3) for people on farmland, woodland or other areas, the similar assumption was made, and we used the patch area to estimate the population.
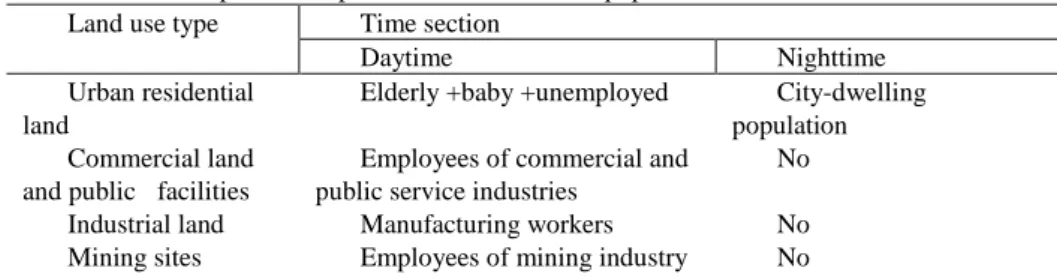
The temporal and spatial distribution characteristics of the population are shown in Table 1. Accordingly, the populations of different spatial units were estimated.
Table 1.Temporal and spatial distribution of the population Land use type Time section
Daytime Nighttime
Urban residential land
Elderly +baby +unemployed City-dwelling population Commercial land
and public facilities
Employees of commercial and public service industries
No Industrial land Manufacturing workers No Mining sites Employees of mining industry No
Warehouse land Warehousing workers No Rural residential
land
Elderly +baby +unemployed Rural residential population
Colleges College Student +college teacher
College students
Hospitals Healthcare workers+
emergency patients+ outpatient+
inpatients
Inpatient +healthcare workers (partial) Nursery schools Preschool children + preschool
staff
No Primary schools Primary
school students+ faculty
No High schools Secondary school students+
faculty
No Charity
organizations
The elderly and
children + charity organization staff
The elderly and children +
nursing home staff (partial)
Tourist attractions Tourists+ staffs No
Arable land Primary industry workers No
(3) Evaluation of population vulnerability First, population data was normalized:
min
max min
ij j
ij
j j
x x
y x x
, (1)
Where, yij is the standardized values of indicators j of unit i, xij is the original data of indicators j of unit i, max
xj and min
xj are themaximum and minimum values of indicators j among all units.
The population vulnerability of each unit was calculated with equation (2):
1 n
i j j
i i
j
y k
M k
(2)Where, Mi is population vulnerability of unit i, kj the weight of indicators j, and yij the standardized values of indicators j in unit i. The standardized value of each indicator stands for its state of susceptibility, and their different influences on population vulnerability were reflected by the weights. kj were obtained with a Delphi method based on an expert knowledge survey.
Accordingly, we could calculate population vulnerability of daytime Mdayi and nighttime Mnigi separately.
Based on Mdayi and Mnigi, we also calculated the comprehensive population vulnerability, Mi, which is necessary for daily risk management.
Mi=a1×Mdayi+ a2×Mnigi (3)
In Haidian district, day and night population are both very large and population is more concentrated at night. Based on the survey of expert knowledge, 0.4 and 0.6 were assigned to a1 and a2 in equation (3), respectively.
2.3 Method for economic vulnerability assessment
(1) Factors and assessment model
Economic vulnerability to disasters refers to the potential economic loss.
In practice, it is fairly complex and difficult to quantify the economic loss from disasters, because direct loss, indirect and secondary loss, and other losses should all be included. So far, methods for evaluating indirect disaster loss and vulnerability are immature (Okuyama, 2007; Hiete and Merz, 2009).
In the literature, more efforts have been delivered to the development of theoretical models than empirical studies. The number of empirical studies is limited, probably due to the complexity of the problem and insufficient data.
Among the three components of vulnerability (exposure, sensitivity or susceptibility, and coping ability), we focus more on the former two. In particular, we attempt to assess relative vulnerability, which is measured by the product of exposure and sensitivity of economic system.
Tierney (1997) ever pointed out that economic losses are mainly due to three causes: first, physical damage such as that of raw materials, equipment and products in stock; second, production interruptions due to industrial process interruptions; and third, the disruptions of critical infrastructure.
For individual enterprises, exposure can be roughly measured by total assets of the enterprises. Because the number of individual enterprises is very large (about 15 0000), we estimated the sensitivity of industrial sectors in the three-digit(most are three-digit, still some are two-digit or four-digit) list of industries announced by National Statistics Bureau of China, and used the sensitivity of industrial sectors to which the enterprises belong to substitute the sensitivity of enterprises.
The sensitivity levels were estimated by combining the susceptibility and importance indices of each industrial sector. Susceptibility reflects the possibility of loss, and different industries have distinct sensitivities to disasters. Importance reflects the role of certain industries in emergency management and emergency rescue such as food and water supply and medical production, and that the disruption of some crucial industries to daily running of cities may lead to serious consequential damages. First, a semi-quantitative approach was adopted to select susceptible and important industries. Based on the selected industries, the industrial susceptibility and importance can be quantified by Delphi method.
We also took economic density as a supplement of the economic exposure to disasters. Given the limited emergency resources, priority should be given to regions with higher economic density and those which can bring greater economic benefits.
Next, we studied the functional relationship between the above factors in order to establish the evaluation model. Vulnerability can be assessed by the product of exposure and sensitivity (Adger, 2006), therefore, the product of economic exposure and the sum (which can represent the sensitivity) of susceptibility and importance of industries can measure the vulnerability of the enterprises. The vulnerability of enterprises and the economic density are two complementary components. Therefore, the following assessment model was established:
V=α*S*(β*X1 + (1-β)*X2) + (1-α)* X3 (4)
Where V is the regional economic vulnerability, S enterprise’s scale representing the exposure, X1 and X2 are indices of industrial susceptibility and importance, respectively, X3 the economic density, and α, β∈[0,1] are weighting parameters.
As X1, X2 and X3 are different in physical meaning; their values should be standardized in order to obtain the overall level of economic vulnerability of the concerned region.
(2) Susceptibility assessment by industrial types
Some industries may experience secondary disasters (such as fire and explosion), such as chemical industry, and special industry may lead to unconventional emergencies, such as nuclear power industry. They are typical susceptible industries. Industrial susceptibility is affected by such factors as input factor dependency, supply chain dependency, infrastructure dependency and the local concentration of industries. They were summarized in Table 2.
Table 2.Influencing factors of industrial vulnerability and underlying mechanism
Influencing factors Mechanism
1. Supply shortage or damage of input factors (labor, capital, equipment, raw material, etc.)
An industry is more susceptible if its input requirements are higher and more specialized, e.g., highly educated and skilled workers, high value equipment, high intermediate input rate, capital requirements, because such industries may encounter greater direct losses and the possibility of production interruption due to poor input factor substitution is higher.
2. Disruption of lifeline systems (water, electricity, transportation volume)
An industry is susceptible if it is highly dependent on lifeline systems, e.g., extensive consumption of electricity, water and energy and transportation facilities, because it is more likely to be affected by the disruption of lifeline systems.
3. Supply chain interruption Industries with large backward linkage effect (demand for the upstream industries) are more susceptible to the interruption of upstream industries.
4. Degree of industrial agglomeration
An area is expected to be more susceptible if the industries are more agglomerated in this area because of greater exposure to disasters.
Influence coefficient was introduced to reflect the relative dependence degree of certain industrial sectors on the supply chain, which was computed using Input-Output Table. The Input-Output Table is based on the balance between input and output of various sectors of national or regional economy.
It can be used to reveal the quantitative relation of economic and technological interdependence and mutual restraint in various sectors. Larger influence coefficients indicate that the industries need more input from the other sectors.
As lifeline systems are particularly susceptibility to disasters, industries highly dependent on lifeline systems are more vulnerable. Therefore, we chose water consumption, electricity consumption and transportation volume (road and railway) of each industrial sector as indicators to measure the industry’s dependence on lifeline systems; the gross production (GDP) of the industries were used to measure the spatial agglomeration degree of the industries. Scrutinizing the summing up values of the indicators, 69 susceptible industries were identified.
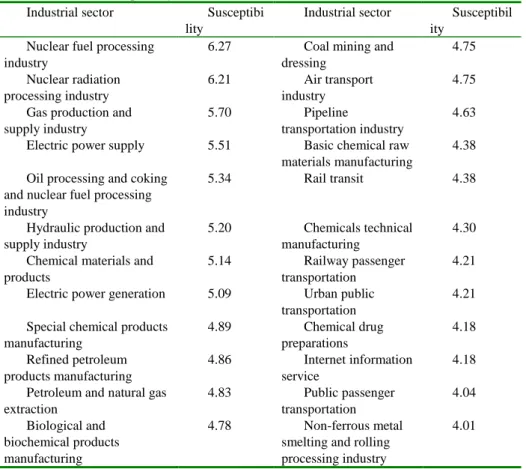
A Delphi method was adopted to assess the susceptibility of them. We conducted a questionnaire survey and asked 70 experts in the field of regional economics and disaster science to classify and score the selected industrial sectors: 7 for highly susceptible, 5 for very susceptible, 3 for medium susceptible, and 1 for low susceptible. With the answers, the standardized average scores of industrial susceptibility were calculated.
Table 3 demonstrates the results for industrial sectors with high susceptibility.
Table 3. The susceptibility level of industrial sectors Industrial sector Susceptibi
lity
Industrial sector Susceptibil ity
Nuclear fuel processing industry
6.27 Coal mining and
dressing
4.75 Nuclear radiation
processing industry
6.21 Air transport
industry
4.75 Gas production and
supply industry
5.70 Pipeline
transportation industry
4.63 Electric power supply 5.51 Basic chemical raw
materials manufacturing
4.38 Oil processing and coking
and nuclear fuel processing industry
5.34 Rail transit 4.38
Hydraulic production and supply industry
5.20 Chemicals technical manufacturing
4.30 Chemical materials and
products
5.14 Railway passenger
transportation
4.21 Electric power generation 5.09 Urban public
transportation
4.21 Special chemical products
manufacturing
4.89 Chemical drug
preparations
4.18 Refined petroleum
products manufacturing
4.86 Internet information service
4.18 Petroleum and natural gas
extraction
4.83 Public passenger transportation
4.04 Biological and
biochemical products manufacturing
4.78 Non-ferrous metal
smelting and rolling processing industry
4.01
(3) Importance assessment by industrial types
Important industries include the industries which are crucial to emergency management and the industries that are significant to the production of other industries, we could identify the first kind of industries through qualitative analysis methods (e.g. literature and media information), and we used inducing coefficients to choose the second kind of industries, inducing coefficient refers to a comparison of the production needs of one industrial sectors caused by one more unit of final product of all industrial sectors and the average level of production needs of the various industrial sectors caused by one more unit of final product of all industrial sectors.
Larger inducing coefficient indicates that the industry is the basic industry;
the inducing coefficient can be calculated with regional Input-Output Table.
Finally, 49 important industries were selected.
With the Delphi method, the average scores of the industrial importance were computed, as shown in Table 4.
Table 4 .The importance level of industrial sectors
Industrial sector Import ance
Industrial sector Importa nce
Hospital 6.61 Railway freight
transportation
5.31 Hydraulic production and
supply industry
6.49 Pharmaceutical industry 5.25 Disease prevention and
control and epidemic prevention activities
6.38 Hygienic material and medical supplies
manufacturing
5.23
Electric power supply 6.32 Road passenger transportation
5.23 Hospitals and community
health care activities
6.07 Social security 5.23
Electric power generation 5.96 Satellite transmission service
5.2 Gas production and supply
industry
5.96 Food manufacturing industry
5.17 Telecommunications
profession
5.73 Radio and television transmission service
5.06
Internet information service 5.51 Rail transit 4.94
Railway passenger transportation
5.45 Environmental management
4.92 Urban public transportation 5.39 Municipal public
facilities management
4.92 Road freight transportation 5.34 Public trolley bus and
bus passenger transportation
4.89
(4) Estimation of the size of individual enterprises
The scale of enterprises can be reflected by annual turnover, number of employees and total assets. In order to get a comprehensive evaluator from the three factors, we extracted common factors from them with factor analysis method. If the values of the obtained common factors were negative, they were transferred to a positive set by adding the absolute value of the minimum value.
The estimated sizes of individual enterprises were then aggregated for each block. Fig. 3 shows the result.
Figure 3.Distribution of enterprise scales of blocks in Haidian district, Beijing
(5) Economic density of blocks
According to Alaghi (2012), any tangible or intangible economic resources that are capable of producing value and that hold some positive economic value can be considered as an asset. Thus total asset is a better representative of economic scale than GDP.
At the block level, no economic data in China is publicly available.
Therefore, we need to divide the economic data of Haidian district into the block level. As the total assets and total floor area of buildings in each industrial sector at the district level, and the gross floor area of buildings in these sectors at the block level are available, we could just allocate the asset values to each block by the proportion of gross floor area of each block in the district, assuming that per unit area asset values are equal. This assumption is somewhat arbitrary, and there might be significant difference between different blocks. In-depth study is necessary for improving the accuracy of spatial data.
With formula (5), the asset value of the j-th block, Ej, was estimated.
i ij
Ej *
i
, (5)
where, i indicates industrial types, λij is the proportion of gross floor area for sector i in the j-th block in the whole district, and εi is the total asset value of the i-th industrial sector in the district. Fig. 4 shows the result.
Figure 4. Distribution of economic density levels in Haidian district, Beijing
3. ANALYSIS RESULT OF POPULATION VULNERABILITY
3.1 Spatial pattern of population vulnerability
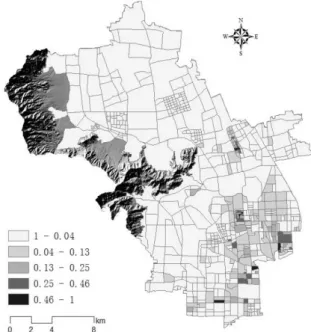
With the method described in section 2.2, the population vulnerability index of every block was obtained. Among the methods for the classification and grading a single variable, such as equal interval, equal proportion, standard deviation, and natural breaks, appropriate one should be chosen according to the specific distribution of data set (Huang, 2007; Gao et al, 2012). For the convenience of emergency management and planning, objectivity and clear physical significance are required. So we chose standard deviation method for the population vulnerability classification.
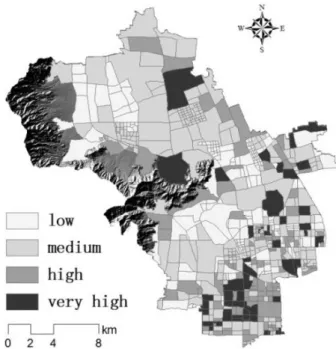
As a result, the 647 blocks of Haidian district were classified into four levels, with population vulnerability within the interval of <-0.5 standard deviation (low vulnerability), of±0.5 standard deviation (medium vulnerability), from +0.5 to +1.5 standard deviation (high vulnerability), and >1.5 standard deviation (very high vulnerability). The population vulnerability of blocks was mapped in Fig. 2 and Fig. 3 (upper left part is the hill-shade of mountain areas).
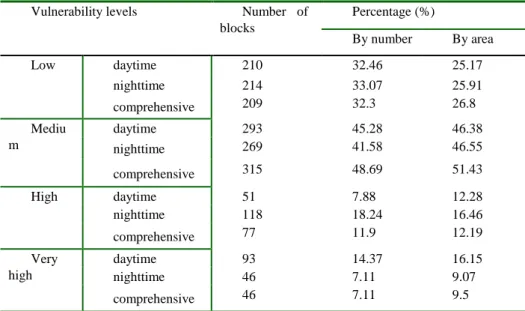
Table 5. Result of population vulnerability assessment Vulnerability levels Number of
blocks
Percentage (%)
By number By area
Low daytime 210 32.46 25.17
nighttime 214 33.07 25.91
comprehensive 209 32.3 26.8
Mediu m
daytime 293 45.28 46.38
nighttime 269 41.58 46.55
comprehensive 315 48.69 51.43
High daytime 51 7.88 12.28
nighttime 118 18.24 16.46
comprehensive 77 11.9 12.19
Very high
daytime 93 14.37 16.15
nighttime 46 7.11 9.07
comprehensive 46 7.11 9.5
Table 5 presents the overall daytime, nighttime, and comprehensive population vulnerability. 144 out of 647 blocks (accounting for 28.4% of the total area of Haidian district), 164 blocks (25.5% of the area of the district), and 123 blocks (21.7% of the area of the district) are at high and very high levels of population vulnerability in daytime, nighttime, and comprehensively.
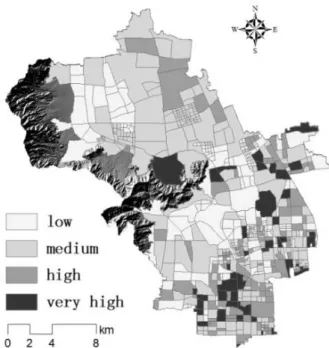
Fig. 5 and Fig. 6 suggest that blocks with high and very high population vulnerability concentrate in residential and service areas in the south and Hi-Tech Park areas in the east part of the study area. West and north areas for tourism and agricultural use are relatively less vulnerable.
The common spatial agglomeration areas of high and very high in daytime, nighttime and comprehensive population vulnerability are Balizhuang, Qinghuayuan, Wanshoulu, Xisanqi, Qinghe Jiedaos and Baiwangshan area.
However, the spatial agglomeration of some vulnerable places has significantly shifted over time. For example, Zhongguancun Jiedao is the most vulnerable area at daytime because this is the center of Hi-tech industry in Beijing and many people come to work in the office buildings in this area, but at night the vulnerability level is significantly lower.
In addition, we found that at nighttime the maximum and average levels of population vulnerability were higher than that of daytime. This could be explained by the fact that Haidian district generally loses more working population at daytime. Moreover, in the daytime, population is scattered in residential land,commercial land,and industrial land, but they gather in residential land at night. Although the area ratio of high and very high vulnerability classes is lower in nighttime, net population density in residential blocks is much higher.
We calculated comprehensive population vulnerability index by considering both day and night time. This is beneficial to daily risk management and planning. For instance, more emergency facilities and resources should be placed to vulnerable areas.
Figure 5. Distribution of population vulnerability levels in daytime
Figure 6. Distribution of population vulnerability levels in nighttime
Figure 7.Spatial pattern of the comprehensive population vulnerability
3.2 Hotspots of population vulnerability
Getis-Ord Gi* is a statistic for significant spatial clusters of high values (hot spots) and low values (cold spots) (Wang & Duan, 2010), which is calculated by:
, (7)
(6)
Where xj is the vulnerability index at j block, and wij is a spatial weighting matrix. Positive and negative Gi* statistic with high absolute values implies
) ( ) w
* (
j x i
x G
j j
j ij j
i
clusters of high- and low-value events, a Gi* close to zero indicates a random distribution of events.
Here, we used inverse distance method to create the weighting matrix. The significance level of 0.05 is chosen to identify the hotspots of population vulnerability. The result is shown in Figure 8.
Figure 8. Hotspots of comprehensive population vulnerability
4. ANALYSIS RESULT OF ECONOMIC VULNERABILITY
4.1 Spatial pattern of economic vulnerability
With an indicator system approach, it is hard to determine the parameters of economic vulnerability assessment model in equation (4). In previous studies on economic vulnerability assessment, weights were often artificially assigned (e.g. based on expert knowledge or on experience).
To determine the appropriate parameters, we tested the stability of economic vulnerability while changing the two parameters in equation (4).
With α and β taking values at intervals of 0.1 between 0.3 and 0.7, their combinations were applied to the model. The results showed that the coefficient of variation was less than 30% for all 647 blocks, and that of blocks at the level of high economic vulnerability was less than 20%. This indicated that the economic vulnerability was not sensitive to weight parameters when they were set between 0.3 and 0.7. Taking this into account and referring to some relevant literature (Adrianto and Matsuda, 2002; Cutter, 2003), we assigned 0.5 and 0.6 to α and β, respectively.
A standard deviation method was used for classifying the economic vulnerability index of blocks. As a result, four levels of economic vulnerability were obtained, low for <-0.5 standard deviation, medium for within±0.5 standard deviations, high for between +0.5 to +1.5 standard deviations, very high for >+1.5 standard deviations.
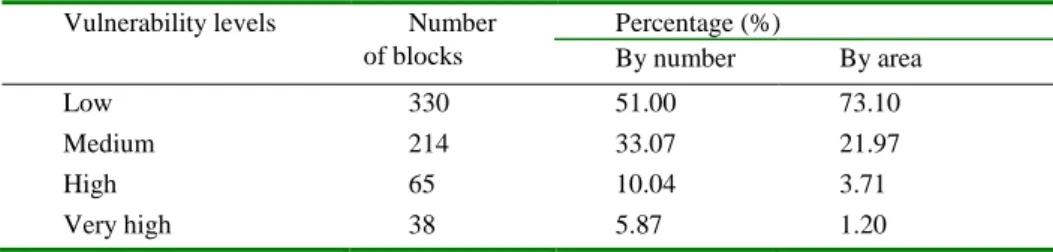
Table 6 shows the overall economic vulnerability of Haidian district. 103
out of 647 blocks which account for 4.91% of the area of Haidian district are at the level of high and very high economic vulnerability.
Table 6.Statistics of blocks by economic vulnerability levels Vulnerability levels Number
of blocks
Percentage (%)
By number By area
Low 330 51.00 73.10
Medium 214 33.07 21.97
High 65 10.04 3.71
Very high 38 5.87 1.20
Fig. 9 shows that blocks with high and very high economic vulnerability are mainly concentrated in the southern urban living and service area and the eastern Hi-Tech Park. Western tourism and agricultural areas have low vulnerability.
The spatial agglomeration areas of high and very high economic vulnerability are Zhongguancun, Haidian, North taipingzhuang, Ganjiakou, Shangdi, North Xiaguan, Yangfangdian, Wanshoulu , and Zizhuyuan Jiedaos, specially, blocks with high and very high economic vulnerability are highly concentrated in Zhongguancun, Haidian, North taipingzhuang, Ganjiakou, and Shangdi Jiedaos. According to Beijing Haidian Municipal Commission of Urban Planning (2009), these regions have been the agglomeration areas of high-tech industries, commercial, exhibition, medical, and the government services, all of which play important roles in Haidian’s economy as well as Beijing’s. Thus, we suggest that more attention should be paid to these areas in emergency management and day-to-day risk management.
Figure 9. Spatial pattern of economic vulnerability levels in Haidian district, Beijing
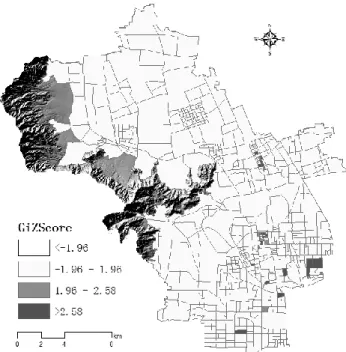
4.2 Hotspots of economic vulnerability
With Getis-Ord Gi* statistic, significant spatial clusters of economic vulnerability were identified, as shown in Fig. 10.
Figure 10. The hotspots of economic vulnerability
In the hotspots of economic vulnerability, the main industrial types are telecommunications and information transmission services, communication equipments, computer and electronic equipment manufacturing, banking, tourism, hotel, real estate development and management. Moreover, the shares of enterprises in the same industrial types are quite high, suggesting very high level of industrial agglomeration.
These blocks, together with the vulnerable areas suggested by the map of population vulnerability in Fig. 5, 6, and 7, constitute the areas in risk in the study area. According to the investigation of Ji and Gao (2012) on emergency shelters in Beijing, the accessibility as well as the size of emergency shelters in the built-up areas of Haidian district, especially in the east part are insufficient. As crucially important problem areas, special attention should be paid to the hotspots of population and economic vulnerability in the future.
There were some discussions on the need and methods for integrating social and economic vulnerability, as well as indices generated from other perspectives, but no consensus had been achieved (Tapsell et al., 2010). From the viewpoint of risk management and disaster mitigation, we think that creating a single evaluator is not indispensable. Therefore, the results on population and economic vulnerability are separately presented and not integrated.
5. DISCUSSION AND CONCLUSION
Assessing social and economic vulnerability of urban areas is a significant step in risk assessment, a prerequisite for effective disaster prevention and an important base for emergency management. It sheds light on where, who and which of the population and economic systems are most vulnerable, and led to planning and policy to deal with the specific problems in concern. In this paper, we made several progresses on population and economic vulnerability assessment comparing to previous studies.
First, we succeeded in carrying out social and economic vulnerability
assessment at the scale of blocks, which could provide crucial information for decision-makings in disaster management in urban areas. So far in practice, the selection of spatial scale depends more on available data rather than on the appropriateness of scales. We used a plenty of up-scaling and down-scaling to solve the data problems. The proposal of taking block as the basic spatial unit greatly increased the resolution of the assessment, and advanced previous studies in China which had been conducted at least at the district level. The results of our study, for example in Fig. 5 to 7 and Fig. 8 to 9, suggested that the spatial pattern of population and economic vulnerability would be seriously masked beyond the block scale.
Second, in the population vulnerability models, we have noticed the difference between social groups and between day and night times. By introducing demographic, space and time dimensions, the results provided useful knowledge and helped us in perceiving the real world situation better.
Third, we advanced previous models for economic vulnerability assessment, many of which took the form of linear aggregation of various indicators. The developed model has considered economic scale, density, and the susceptibility and importance of various industrial sectors. Their integral relationships had been carefully treated, and with a non-linear model specification, the collinearity problem is avoided. We think that susceptibility and importance are very important notions for the vulnerability of industrial sectors and suggest a theoretical direction of relevant studies. The selection of industries and ratings of them in this study, though preliminary, can be applied to many other cities.
In metropolitan areas, the structures and interactions of different people and industrial sectors are extremely complicated and the vulnerability of urban areas to different kinds and intensity of disasters may differ. Our study only took account of selected aspects and factors, and some measures and parameters relied on expert knowledge and experience. For simplicity, the intensity of disaster influence and interactions between the bearing system and disasters were not considered. We also ignored the impact of different disasters by assuming that the study area suffers from the same kind and the same intensity of disaster. Consequently, the theoretical model of social and economic vulnerability is a function of the region’s internal conditions and without external factors. But these factors should be considered in the future and how to incorporate these factors into the model will be the direction for future studies.
ACKNOWLEDGEMENTS
The authors gratefully acknowledge the valuable comments from Professors Fengjun Jin, Yi Liu, Hong Huang, and Zhenjiang Shen. This research is founded by the National Science and Technology Support Program of China (No. 2011BAK07B02) and by Natural Science Foundation of China (No. 41171138).
REFERENCES
Adger, W.N., Brooks, N., Bentham, G. et al. (2004). “New indicators of vulnerability and adaptive capacity”, Tyndall Centre for Climate Change Research, Norwich.
Adger, W. N. (2006). “Vulnerability”, Global environmental change, 16(3), 268-281.
Adrianto, L., Matsuda, Y. (2002). “Developing economic vulnerability indices of environmental disasters in small island regions”, Environmental Impact Assessment Review, 22(4), 393-414.
Alaghi, K. (2012). “Asset and systematic risk”, African Journal of Business Management, 6(9), 3504-3509.
Beijing Haidian Municipal Commission of Urban Planning. (2009). Urban Spatial Development Strategy of Haidian District. Url: http://www.bjghw.gov.cn/
web/static/catalogs/catalog_fj_hd/fj_hd.html, retrieved on May 10, 2013.
Birkmann, J., Wisner, B. (2006). Measuring the Un-Measurable-The Challenge of Vulnerability, Source 5, United Nations University. Institute for Environment and Human Security, Bonn.
Chang, S. E., Falit-Baiamonte, A. (2002). “Disaster vulnerability of businesses in the 2001 Nisqually earthquake”, Environmental Hazards, (4), 59-71.
Chen, L., Xu, W., Zhou, X. et al. (2012). “Assessment of Social Vulnerability to Natural Disasters:A Case Study of Shanghai”, Journal of Catastrophology, 27(1), 98-110. [In Chinese]
Cutter, S., Finch, C. (2008). “Temporal and spatial changes in social vulnerability to natural hazards”, Proceedings of the National Academy of Sciences of the United States of America, 105(7), 2301-2306.
Cutter, S. L., Boruff, B. J., Shirley, W. L. (2003). “Social vulnerability to environmental hazards”, Social Science Quarterly, 84(2), 242-261.
Du, J. K., Zhang, Q., Song, L.J. et al. (2008). “Assessment method of indirect economic loss from Wenchuan M8.0 earthquake”, Journal of Catastrophology, 23(4), 37-40. [In Chinese]
Dwyer, A., Zoppou, C., Nielsen, O. et al. (2004). Quantifying Social Vulnerability: A Methodology for Identifying Those at Risk to Natural Hazards, Geoscience Australia, Canberra, Australia.
Fekete, A. (2010). Assessment of Social Vulnerability for River-Floods in Germany, Doctoral thesis, University of Bonn, Germany.
Field, C. B., Barros, V., Stocker, T. F. et al. (2012). “Managing the Risks of Extreme Events and Disasters to Advance Climate Change Adaptation: Special Report of the Intergovernmental Panel on Climate Change”, Cambridge University Press.
Ge, Y., Shi, P. J., Liu, J. et al. (2005). “Improvement and application of vulnerability assessment methodology for flood hazards in China: Using Changsha Prefecture as a case study”, Journal of Natural Disasters, 14(6): 54-58. [In Chinese]
Granger, K., Jones, T., Leiba, M. et al. (1999). Community risk in cairns: A provisional multi hazard risk assessment. AGSC Cities Project Report No. 1. Australian Geological Survey Organization, Canberra.
Gao, X.L., Ji, J., Jin, F.J., et al. (2012). “Seismic Vulnerability of Rural Housing and Regional Anti-disaster Strategies in China”, Acta Geographica Sinica, 67(2), 211-220. [In Chinese]
Hiete, M., Merz, M. (2009). An indicator framework to assess the vulnerability of industrial sectors against indirect disaster losses. In: J. Landgren and S. Jul (eds.) Proceeding of the 6th International ISCRAM Conference in Gothenburg, Sweden.
Huang, H.P., Zhang, C. (2007). “Study on Integration of Classification Model and GIS”, Journal of Noah China Institute of Water Conservancy and Hydroelectric Power, 28(3), 72-74. [In Chinese]
Ji, J., Gao, X.L., Wang, K.Y. (2012). Evaluation methods about service quality of emergency shelters for evacuation in Cities. ISCRAM ASIA 2012 Conference on Information System for Crisis Response and Management. Beijing,China.
Lin, J. Q., Zhong, J. R. (2007). “Assessment of earthquake induced production sections-related loss”, World Earthquake Engineering, 23(2), 37-40. [In Chinese]
Lou, W. P., Chen, H.Y., Zheng, F. et al. (2009). “Economic loss assessment of typhoon based on principal component analysis and neural network”, Geographical Research, 28(5), 1243-1254. [In Chinese]
Mao, Q. X. (2005). “A Simulated Comparative Study and Application of Statistical Methods in Datasets with Missing Values”, Doctoral thesis, Sichuan University, Sichuan, China. [In Chinese]
Nie, C. J., YANG, L. S., Li, H.R. (2012). “Macro Assessment of Seismic Population Vulnerability in China”, Progress in Geography, 3 (3), 375-382. [In Chinese]
Okuyama, Y. (2007). “Economic modeling for disaster impact analysis: past, present, and future”, Economic Systems Research, 19(2): 115-124.
Perry, R. W., Lindell, M. K. (2003). “Preparedness for emergency response: Guidelines for the emergency planning process”, Disasters, 27(4), 336-350.