Size Specific Distribution Analysis of Perfluoroalkyl Substances In Atmosphere
‑Development and Verification
著者 葛 卉
著者別表示 Ge Hui
journal or
publication title
博士論文本文Full 学位授与番号 13301甲第4481号
学位名 博士(学術)
学位授与年月日 2016‑09‑26
URL http://hdl.handle.net/2297/46585
博 士 論 文
大気中ペルフルオロアルキル化合物の粒子サ イズ別分析法の開発と検証
Size Specific Distribution Analysis of Perfluoroalkyl Substances In Atmosphere -
Development and Verification
金沢大学大学院自然科学研究科 環境科学専攻
学 籍 番 号 氏 名 主 任 指 導 教 員
提 出 年 月
1323142006
葛 卉 尾形 敦
平成28年7月1日
Table of Contents
Chapter 1 Introduction ... 4
1.1 Research background ... 4
1.2 Research purpose ... 6
1.3 Literature Review ... 7
1.3.1 Ambient Particle ... 7
1.3.2 Physicochemical properties of PFASs ... 8
1.3.3 Application and usage amount of PFASs ... 11
1.3.4 Sources of PFASs ... 13
1.4 Approach ... 17
1.5 Thesis Organization ... 18
Chapter 2 Methodology ... 24
2.1 Air sampling ... 24
2.1.1 Instruments ... 24
2.1.2 Sample preparation ... 26
2.1.3 Sampling information ... 27
2.2 Chemical analysis ... 38
2.2.1 Chemicals ... 38
2.2.2 Extraction method ... 39
2.2.3 Instrumental analysis ... 41
2.3 Quality assurance and quality control ... 43
Chapter 3 Sampling method establishment ... 46
Chapter 4 PFASs in Atmosphere ... 52
4.1 Meeting Room and Roadside air sampling ... 52
4.1.1 Particulate matter (PM) concentration ... 52
4.1.2 PFASs concentration in particle phase ... 53
4.1.3 PFASs concentration in gas phase ... 60
4.2 International field sample ... 64
4.2.1 Particulate matter (PM) concentration ... 64
4.2.2 PFASs concentration in atmosphere (pg m
-³ ) ... 69
4.2.3 Time series analysis ... 79
4.3 Cruise sample ... 82
4.3.1 QA/QC control ... 82
4.3.2 Particulate phase samples ... 83
4.3.3 Gas phase samples ... 88
Chapter 5 Conclusion ... 94
Chapter 1 Introduction
In this chapter, an introduction about the background of the research that indicates some reasons for choosing this title; research purpose; literature review; and a methodology for achieving the research purpose is represented.
1.1 Research background
Perfluoroalkylated substances (PFAS) is the collective name for a vast group of fluorinated compounds, including oligomers and polymers, which consist of neutral and anionic surface active compounds with high thermal, chemical and biological inertness.
Perfluorinated compounds are generally hydrophobic but also lipophobic and will therefore not accumulate in fatty tissues, as is usually the case with other persistent halogenated compounds. An important subset is the (per) fluorinated organic surfactants, to which perfluorooctane sulfonate (PFOS) and perfluorooctanoic acid (PFOA) belong.
Perfluoroalkyl substances (PFASs), which known as “super set” of chemical tracers
including more than 90 related chemicals, are used in a variety of industrial and commercial
applications, including surfactants in pesticides, surface protectors in textiles, furnishings and
food packaging. Perfluoroalkyl sulfonates (PFSAs) and perfluoroalkyl carboxylates (PFCAs),
typically dominated by the eight-carbon members perfluorooctane sulfonate (PFOS) and
perfluorooctanoic acid (PFOA), are two main groups of PFASs. PFASs in the environment
arise from their widespread use in industrial applications like metal plating, surfactants,
hydraulic fluids for aircraft, polymers in semiconductor manufacturing, and aqueous fire
fighting foams (OECD, 2002). Consumer applications include stain-proof coatings on drapery
and fabrics, oil resistant coatings on food contact paper, and non-stick coatings on kitchen
utensils and water (OECD, 2002). Such applications have led to measurable PFAS
contamination of both the indoor and outdoor environments. (UK) These chemicals have been
widely detected in wildlife and humans around the world (Delinsky et al., 2010; Zhang et al.,
2010). Starting from May 2001, to regulate the production and use of hazardous chemicals at
the global scale, and protect nature from inconsiderate discharges of chemicals, a total of 164
countries and the European Union made agreement conclude with this rule. Considering the
recent situation of worldwide use of new hazardous chemicals, the previous list was updated
Previous research indicates that PFASs, due to their persistence, water solubility, and
measurability, could represent excellent tracers of global circulation of oceanic waters
(Yamashita et al., 2008). Comprehensive monitoring of PFASs is necessary to enable reliable
understanding of environmental kinetics. However, atmospheric pollution by PFASs is still
unclear because their existence condition is not fully understood yet. Hence, reliable
analytical method to measure exact residue of PFASs in particles is needed.
1.2 Research purpose
The purpose of this study aims at establishing a systematic method to evaluate capability of new sampler by using the both indoor air and ambient air. Then by carrying out international field survey in eleven locations from four countries to test performance of sampling system and investigate PFASs existence in land atmosphere. Moreover, by applying this system in research vessel, PFASs existence in oceanic atmosphere has been also studied.
1.3 Literature Review
1.3.1 Ambient Particle
Particle size is a major determining factor in the atmospheric behavior of aerosol particles and controls the residence time and removal mechanisms of aerosol-bound contaminants. (Bidleman, 1988; Offenberg and Baker, 1999) Although there have been no investigations on size characteristics of ambient particles that may be affected by geographical region, weather, land use where monitoring sites are located in world scale.
Many researches have been done to study the spatial and temporal variation of ambient particle concentration and size distribution in their local area.
For spatial variation, previous study has proved that the difference of ambient particle mass concentration exists among different types of sampling sites. For instance, J. Yin, R.M.
Harrison (2008) sampled airborne particulate matter in the PM10, PM2.5 and PM1.0 size ranges at three sites within 20 km of one another, representing urban background, urban roadside and rural locations. The results shows PM mass concentrations at the three sites rank, as might be expected, i.e. BROS (roadside)>BCCS (urban background)>CPSS (rural background).
While there are not many researches discuss about size distribution variation of ambient particle, and most existing research only use PM
2.5/PM
10ration as an index to analyze the variation of size distribution. For example, by analyzing and comparing PM characteristics of seven selected regions within the European Union (EU), Querol. X et al.
(2004) suggested the ratio PM
2.5/PM
10is highly dependent on the type of site-- regional, urban background and curbside sites, and varied widely between different EU regions. And also, L.Y. Chan et al. (2001) conducted roadside particulate sampling to measure the TSP, PM
10and PM
2.5mass concentration in 11 urbanized and densely populated districts in Hong Kong. This study suggest that PM ratios in metropolitan Hong Kong significantly fluctuated from site-to-site and over time, the mean PM
2.5/PM
10mass ratios were high at sites with higher traffic flow.
As to temporal variation, previous research has indicated that size distributions are
strongly affected by weather conditions (e.g., relative humidity or wind direction) and the
solar radiation (photochemistry). Consequently, in many areas, the seasonal variations of
ambient particle mass concentration are reported. Y. Cheng et al. (2006) measured PM1.0,
PM
2.5and PM
10at 24-hour intervals near a high-traffic road in Hong Kong, suggested that the
particulate masses showed notable seasonal patterns with high concentrations in cold seasons
and low in warm seasons, especially high concentrations of PM
2.5-10during the cold seasons.
However, for size distribution, most existing research only use PM
2.5/PM
10ration as an index to analyze the variation. For instance, by measuring hourly average concentrations of PM
10and PM
2.5simultaneously at a site within Birmingham U.K., Harrison et al. (1997) suggested that a marked difference between summer and winter periods, PM
2.5particles contribute around 80% of PM
10in winter and 50% in summer time.
1.3.2 Physicochemical properties of PFASs
PFASs are characterized by varying lengths of carbon chains in which all hydrogen atoms are substituted by fluorine atoms. All PFASs found in the environment are anthropogenic; they have been manufactured and used for more than 60 years. Because of their unique properties, they have been widely used in a variety of commercial and industrial products. Currently concerned PFASs can be divided into two main groups: (i) perfluoroalkyl sulfonates (PFSAs), and (ii) perfluoroalkyl carboxylates (PFCAs). Perfluorooctane sulfonate (PFOS) and perfluorooctanoic acid (PFOA), which has both eight-carbon chain lengths, are the representatives for the two groups respectively.
Apart from manufacturing, PFSAs and PFCAs seem to be the degradation products of
their corresponding precursors. Perfluoroactyl sulfonamides (FOSA) are one of the potential
precursors for PFSAs, while fluorotelomer alcohol (FTOHs) can finally degrade and yield
PFCAs (Ellis DA et al., 2004; Wallington TJ et al., 2006). Chemical structures of PFSAs,
PFCAs, FOSA and FTUCA have been shown in Figure 1.
photolysis, microbial degradation and metabolism by vertebrates (Giesy JP and Kannan K, 2002; Lewandowski G, 2006). The oleophobic and hydrophobic perfluorinated chains when adding to a hydrophilic charged moiety such as sulfonic acid or carboxylic acid can create the surfactant properties of PFASs. These molecules have both polar (charged moieties) and non- polar (perfluorinated chains) domains that can lessen water surface tension than hydrocarbon- based surfactants, and therefore more powerful wetting agents. These oleophobic and hydrophobic perfluorinated chains also enable the functionalized fluorochemicals water, oil and fat resistant (Giesy JP and Kannan K, 2002; Kissa E, 2001). The physicochemical properties of target PFASs in this study are shown in Table 1. Owing to the high water solubility and low vapor pressure of PFASs, aquatic ecosystem is thought to be a major sink for these compounds.
Unlike other persistent organic pollutants (POPs) that accumulated in the fatty tissues,
PFASs such as PFOA and PFOS are ionic and polar surfactants, they supposed to bind to
blood proteins and accumulate in liver and gall bladder. Hence, they are also bioaccumulative
(Renner R, 2001). Properties of PFASs enable them to be globally distributed in both abiotic
and biotic matrices. Concentrations of PFASs had been detected in human blood (Kannan K
et al., 2004; Yeung LWY et al., 2006), breast milk (So MK et al., 2006B), seafood (Taniyasu
S et al., 2003; Gulkowska A et al., 2006; So MK et al., 2006A), wildlife (Giesy JP and
Kannan K, 2001; Li XM et al., 2008A and B) and many different water bodies (So MK et al.,
2004; Mak YL et al., 2009).
Table 1 Physichemical properties of target PFASs in this study.
Acronym Formula CAS# Boiling
point [℃]
Melting point [℃]
Vapor pressure at 20℃ [Pa]
Water solubility
[mg L-1] pKa Henry's Law constant [atm m3 mol-1]
Particulate-air constant, Kpa
PFEtS F(CF2)2SO3H 354-88-1
PFPrS F(CF2)3SO3H 423-41-6
PFBS F(CF2)4SO3H 375-73-5
PFHxS F(CF2)6SO3H 355-46-4
PFOS F(CF2)8SO3H 1763-23-1 149i 70-100i
PFDS F(CF2)10SO3H 335-77-3
FOSA F(CF2)8SO2NH2 754-91-6
N-EtFOSA F(CF2)8SO2N(C2H5)H 4151-50-2 ~110f ~90f 0.2f N-EtFOSAA F(CF2)8SO2N(C2H5)CH2COOH 2991-50-6
PFPrA F(CF2)2COOH 422-64-0
PFBA F(CF2)3COOH 375-22-4 120b -19.5b 586j 0.4l
PFPeA F(CF2)4COOH 2706-90-3 127b
PFHxA F(CF2)5COOH 307-24-4 157b 12-14b 0.7l >2.18E-03m
>3.6E-02m
PFHpA F(CF2)5COOH 307-85-9 175-177b 54 in CCl4b 6E-03k 1.3l >1.2E-02m
>4.8E-02m
PFOA F(CF2)7COOH 335-67-1 189-192g 55b,g 2.2c 3400g 2.5g 4.6×10⁻⁶ a >3.1E-02m
>9.7E-01m
PFNA F(CF2)8COOH 375-95-1 203.4c 71-77b 2.1l >2.0E-02m
>1.7m
PFDA F(CF2)9COOH 335-76-2 218b 83-85b 0.1c 2.6l >1.6E-02m
>3.9m
PFUnDA F(CF2)10COOH 2058-94-8 160b 96-101b 2.6l >1.9E-02m
PFDoDA F(CF2)11COOH 307-55-1 245b 107-109b 3E-03c 3.1l
PFTrDA F(CF2)12COOH 72629-94-8 117.5-122d
PFTeDA F(CF2)14COOH 376-06-7 130e
1.3.3 Application and usage amount of PFASs
Due to the concern, the 3M Company, the major global manufacturer of POSF, announced the phase-out of POSF-based materials in 2000, butyl-based substances were used as a replacement. The synthesis of PFASs is based on either obtaining the perfluoroalkyl chain or the introduction of functional groups into fluorinated chain. The perfluoroalkyl chain can be obtained by two common methods: (i) electrochemical fluorination (ECF) and (ii) telomerization fluorination process.
Figure 2 summarizes general information on the production and uses of perfluorooctanoic acid (PFOA)-, perfluorononanoic acid (PFNA)-, perfluorooctane sulfonyl fluoride (POSF)- and fluorotelomer-based products as well as their relevance to the emissions of C
4–C
14PFCAs. (Wang Z et al., 2014). The work by Prevedouros et al. (2006) highlighted the significance of historical direct sources to the overall presence of PFCAs in the environment, in particular from production of certain fluoropolymers where PFOA- or PFNA- based products have been used as processing aids (Prevedouros et al., 2006).
The 3M company employed the ECF to produce PFASs since 1950 (3M, 1999). In brief, all the hydrogen atoms of a hydrocarbon were replaced by fluorine atoms under electric current (Kissa E, 2001). PFASs were used widely in inks, varnishes, waxes, fire-fighting foam formulation, metal plating and cleaning, lubricant, water and oil repellents for textile, paper as well as leather (3M, 1999; 3M, 2000A). PFCAs (e.g. PFOA) were also produced in 1947 using the ECF (3M, 1995). This process yields about 35 - 40% straight-chain POSF and a mixture of by-products and waste of unknown and variable composition such as branched- chain, straight-chain or cyclic perfluoroalkylsulfonyl fluorides with various chain lengths with 8-9 fluorinated carbon as major constituents (3M, 1999; 3M, 2000A). PFOA was mainly manufactured as ammonium salt (APFO), the primary worldwide production of APFO using ECF ceased by 2002, though a limited number of small manufacturers was still in production in Europe and Asia. Telomerization (e.g. fluorotelomer iodide (FTI) oxidation, fluorotelomer olefin (FTO) oxidation, and fluorotelomer iodide (FTI) carboxylation) is another important manufacturing process in producing PFASs (Kissa E, 2001). Dupont uses the telomerization process, which yields linear, even-numbered perfluorocarbon chains (Kissa E, 2001).
Commercial products manufactured through the telomerization process are generally mixtures
of polyfluorinated straight-chain compounds with ranges of even carbon numbers (USEPA,
2000). Ammonium perfluoronanoate (APFN) in manufactured in Japan by oxidation of a
mixture of linear fluorotelomer olefin (mainly 8:2 FTOs) oxidation to the corresponding odd-
numbered of PFCAs (Asahi Glass Co., 1975; Daikin Industries, 1998).
Figure 2 General information on the production and uses of perfluorooctanoic acid (PFOA)-, perfluorononanoic acid (PFNA)-, perfluorooctane sulfonyl fluoride (POSF)- and fluorotelomer-based products as well as their relevance to the emissions of C
4– C
14PFCAs. (Wang Z et al., 2014)
Figure 3 summarized main usage of PFASs products. Following introduced several typical PFASs:
PFBS (Perfluorobutane sulfonate) is an active ingredient in 3M's new Scotchgard (old formulation was phased out in 2000 over health concerns).
PFHxS (Perfluorohexanesulfonate) is in fire fighting foams and carpet treatments.
Phased out of consumer products by 3M in 2000 over health concerns.
PFOS (Perfluorooctanesulfonate) is an active ingredient in Scotchgard prior to 2000.
Phase out forced by EPA because concentrations in human blood close to levels that harm lab
animals.
PFOA (Perfluorooctanoic acid) is used to make Teflon pan coatings; breakdown product of stain- and grease-proof coatings.
PFNA (Perfluorononanoic acid) is
breakdown product of stain- and grease-proof coatings on food packaging, couches, and carpets.Figure 3 Applications of PFASs
1.3.4 Sources of PFASs
There are two major sources of PFCA emission to the environment: (i) direct and (ii)
indirect. Direct sources might be resulting from the manufacturing and processing process of
PFCA, ammonium perfluorooctanoate (APFO) and fluoropolymer, water soluble PFCA salts
might be expected to enter the local aquatic environment directly (Figure 2). Secondly, the
releases of AFFFs and other consumer and industrial products were also another direct source.
PFCAs present as chemical impurities and degradation of fluorotelomer-based products could be categorized as the indirect sources in the environment. (Prevedouros K, 2006)
Volatile FTOHs, have an atmospheric lifetime of 20 days, are supposed to be the possible precursors of PFCAs. The worldwide production of FTOHs was approximately 12 x 106 kg per year. FTOHs, with fluorinated carbons of 6, 8, 10 were found in air masses of Japan (Oono S et al., 2008), Asian and Western USA (Piekarz AM et al., 2007). Hydroxyl (OH) radical present in the atmospheric environment would initiate the oxidation of FTOHs and yield PFCAs (Ellis DA et al., 2004). Some studies had simulated the atmospheric conditions using chlorine (Cl) radicals to replace OH radicals in a smog chamber, 8:2 FTOH reacted and degraded to perfluorinated aldehydes (FTALs) and fluorotelomer carboxylic acids (FTCAs) and finally yielded the entire suite of PFCAs ranging from trifluoroacetic acid (TFA) to perfluorononanoic acid (PFNA) (Figure 4) (Ellis DA et al., 2004; Wallington TJ et al., 2006). The atmospheric concentrations of FTOHs decreased with increasing chain lengths, leading to a decreasing trend of longer chain length PFCA concentrations in the environment (Ellis DA et al., 2004).
Figure 4 Proposed mechanisms for the atmospheric degradation of 8:2 FTOH (Wallington TJ et al., 2006)
Figure 5 estimated annual releases of PFCAs from PFOA production sites (top) and
India), suggesting that the proportion of global PFCA emissions originating from continental Asia has increased.
Figure 5 Estimated annual releases of PFCAs from PFOA production sites (top) and
fluoropolymer production sites (bottom) in the United States (US), Western Europe and Japan (purple) as well as in China, Russia, Poland and India (orange). The pie charts show fract. (Wang Z et al., 2014)
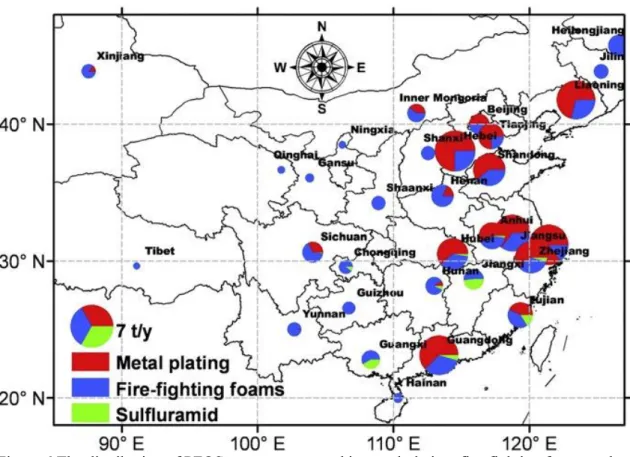
Figure 6 shows the distribution of PFOS use amounts used in metal plating, fire- fighting foams and sulfluramid applications in 31 provinces of China. (Zhang L et al., 2012).
In this study, field survey consists sampling sites from low production district (Yunnan),
medium size production district (Henan) to high production district (Beijing and Hong Kong).
Figure 6 The distribution of PFOS use amounts used in metal plating, fire-fighting foams and
sulfluramid applications in 31 provinces of China. (Zhang L et al., 2012)
1.4 Approach
Capability of the new sampler was evaluated using both indoor air and ambient air.
The former was carried out at air-conditioned room and the latter was along roadside, and both investigations were carried out through a year and evaluated seasonal change.
After above verification, international field survey using the tool was carried out.
Totally thirty-eight samples were collected from eleven locations in four countries, Japan,
India, China and USA. Additionally, some open ocean samples were also investigated. These
sample analyses provided useful information about environmental behaviour of PFASs in
atmosphere, not only in particulate matter but also in gas phase under different climate
conditions. This is the first research investigating both the gas and size distribution analysis of
PFASs to our knowledge.
1.5 Thesis Organization
The rest of this dissertation is organized as following:
Chapter 2 introduces the methodology of this study, mainly contains three parts: 1) air sampling including instruments introduction and sample collection procedure; 2) chemical analysis including extraction method and instrumental analysis; and 3) quality assurance and quality control.
Chapter 3 showed the result about establishing sampling method by blank check and recovery sampling test.
In chapter 4 and 5, filed samples and cruise samples’ results are shown.
And lastly, chapter 5 concludes the research.
Reference
3M. 1999. The Science of Organic Fluorochemistry. AR226-0547: 3M Company.
3M. 2000A. Phase-Out Plan for POSF-Based Products; USEPA Docket OPPT-2002-0043;
Specialty Materials Markets Group. St Paul, MN: 3M Company.
3M. 2000B. POSF Life Cycle Waste Stream Estimates. AR226-0681: 3M Company.
3M. 1995. 3M Fluorad Surfactants; Product Information Bulletin. St Paul, MN: 3M Company.
Armitage J M, Schenker U, Scheringer M, et al. Modeling the global fate and transport of perfluorooctane sulfonate (PFOS) and precursor compounds in relation to temporal trends in wildlife exposure[J]. Environmental science & technology, 2009, 43(24): 9274- 9280.
Asahi Glass Co. 1975. Process for producing perfluorocarboxylic acid. 1473807: British Patent
Barber J L, Berger U, Chaemfa C, et al. Analysis of per-and polyfluorinated alkyl substances in air samples from Northwest Europe[J]. Journal of Environmental Monitoring, 2007, 9(6): 530-541.
Benskin, J.P., Bataineh, M., and Martin, J.W. 2007. Simultaneous characterization of perfluoroalkyl carboxylate, sulfonate, and sulfonamide isomers by liquid chromatography-tandem mass spectrometry. Anal. Chem. 79: 6455-6464.
Bidleman, T. F. (1988). Atmospheric processes. Environmental Science & Technology, 22(4), 361-367.
Chan, L. Y., Kwok, W. S., Lee, S. C., & Chan, C. Y. (2001). Spatial variation of mass concentration of roadside suspended particulate matter in metropolitan Hong Kong.
Atmospheric Environment, 35(18), 3167-3176.
Cheng, Y., Ho, K. F., Lee, S. C., & Law, S. W. (2006). Seasonal and diurnal variations of PM1.0, PM2.5 and PM10 in the roadside environment of Hong Kong. China Particuology, 4(6), 312-315.
Daikin Industries. 1998. Method for preparation perfluorocarboxylic acid by oxidation of perfluoroalkylethylene. JP10279517: Japanese Patent.
Delinsky, A. D.; Strynar, M. J.; McCann, P. J.; Varns, J. L.; McMillan, L.; Nakayama, S. F.;
Lindstrom, A. B. Geographical Distribu- tion of Perfluorinated Compounds in Fish from Minnesota Lakes and Rivers. Environ. Sci. Technol. 2010, 44, 2549–2554.
De Silva, A.O. and Mabury, S.A. 2006. Isomer distribution of perfluorocarboxylates in human blood: Potential correlation to source. Environ. Sci. Technol. 40: 2903-2909.
DuPont Company. 2005. Dupont Global PFOA Straegy; USEPA Administrative Record AR226-1914. Washington, DC: U.S. Environmental Protection Agency.
Ellis DA, KA Denkenberger, TE Burrow, SA Mabury (2004) The use of 19F NMR to Interpret
the Strudctural Properties pf Perfluorocarboxylate Acids: A possible correlation with
their environmental disposition, J Phys Chem A, 108, 10099-10106
Ellis, D.A., Martin, J.W., De Silva, A.O., Mabury, S.A., Hurley, M.D., Andersen, M.P.S., and Wallington, T.J. 2004. Degradation of fluorotelomer alcohols: A likely atmospheric source of perfluorinated carboxylic acids. Environ. Sci. Technol. 38: 3316-3321.
FluorochemicalManufacturesGroup: Detecting and quantifying low levels of fluoropolymer polymerization aids – A guidance document. In., 2002
Fluoropolymer Manufaturing Group. 2005. Dispersion Processors Mass Balance Report;
U.S. EPA: Docket OPPT2003-0012-0900, -0901, -0902, -0903, -0904. Washington, DC:
U.S. Environmental Protection Agency.
Fischer-Drowos SG, LR Betz, JM DiBussolo, JA. Miscavige, and NM Madhoun (2007) Melting Point and Aqueous Solubility Determination of 2H-Hexadecafluoro-2-decenoic Acid (C10F16H2O2) J Chem Eng Data , 52: 759-761
Giesy, J.P. and Kannan, K. 2001. Global distribution of perfluorooctane sulfonate in wildlife.
Environ. Sci. Technol. 35: 1339-1342.
Giesy, J.P. and Kannan, K. 2002. Perfluorochemical surfactants in the environment. Environ.
Sci. Technol. 36: 146A-152A.
Gulkowska, A., Jiang, Q.T., So, M.K., Taniyasu, S., Lam, P.K.S., and Yamashita, N. 2006.
Persistent perfluorinated acids in seafood collected from two cities of China. Environ. Sci.
Technol. 40: 3736-3741.
Harrison, R. M., Deacon, A. R., Jones, M. R., & Appleby, R. S. (1997). Sources and processes affecting concentrations of PM10 and PM2.5 particulate matter in Birmingham (UK).
Atmospheric Environment, 31(24), 4103-4117.
Hekster F M, Laane R W P M, de Voogt P. Environmental and toxicity effects of perfluoroalkylated substances[M]//Reviews of Environmental Contamination and Toxicology. Springer New York, 2003: 99-121.
Hinds, William C. Aerosol technology: properties, behavior, and measurement of airborne particles. Wiley-interscience, 2012.
Lange, C.C. 2000. The aerobic biodegradation of N-EtFOSE alcohol by the microbial activity present in municipal wastewater treatment sludge: Biodegradation study report; 3M Project ID: LIMS E00-2252. St Paul, MN: 3M Company.
Lewandowski, G., Meissner, E., and Milchert, E. 2006. Special applications of fluorinated organic compounds. J. Hazard. Mater. 136: 385-391.
Li, X.M., Yeung, L.W.Y., Taniyasu, S., Lam, P.K.S., Yamashita, N., Xu, M.Q., and Dai, J.Y.
2008. Accumulation of perfluorinated compounds in captive Bengal tigers (Panthera
tigris tigris) and African lions (Panthera leo Linnaeus) in China. Chemosphere 73: 1649-
1653.
application of a simplified sampling method for volatile polyfluorinated alkyl substances in indoor and environmental air. J. Chromatogr. A 1164: 1-9.
JIS Z 8901: “Test dusts and Test Particles” (1995) (in Jamanese)
Kaiser MA, BS Larsen, Chien-Ping C Kao and RC Buck, (2005) Vapor Pressures of Perfluorooctanoic, -nonanoic, -decanoic, -undecanoic, and -dodecanoic Acids, J. Chem.
Eng. Data, 50: 1841-1843
Kannan, K., Corsolini, S., Falandysz, J., Fillmann, G., Kumar, K.S., Loganathan, B.G., Mohd, M.A., Olivero, J., Van Wouwe, N., Yang, J.H., and Aldous, K.M. 2004.
Kim, S.K. and Kannan, K. 2007. Perfluorinated acids in air, rain, snow, surface runoff, and lakes: Relative importance of pathways to contamination of urban lakes. Environ. Sci.
Technol. 41: 8328-8334.
Kissa, E. 2001. Fluorinated Surfactants and Repellents, 2nd ed. New York: Marcel Dekker.
Kunieda H and K Shinoda (1976) Krafft Points, Critical Micelle Concentrations, Surface Tension, and Solubilizing Power of Aqueous Solutions of Fluorinated Surfactants, J Phys Chem, Vol. 80, No. 22,: 2468-2470
Kwok K Y, Taniyasu S, Yeung L W Y, et al. Flux of perfluorinated chemicals through wet deposition in Japan, the United States, and several other countries[J]. Environmental science & technology, 2010, 44(18): 7043-7049.
Mak, Y.L., Taniyasu, S., Yeung, L.W.Y., Lu, G.H., Jin, L., Yang, Y.L., Lam, P.K.S., Kannan, K., and Yamashita, N. 2009. Perfluorinated Compounds in Tap Water from China and Several Other Countries. Environ. Sci. Technol. 43: 4824-4829.
Moody, C.A. and Field, J.A. 2000. Perfluorinated surfactants and the environmental implications of their use in fire-fighting foams. Environ. Sci. Technol. 34: 3864-3870.
Moroi Y, H Yano, O Shibata and T Yonemitsu, (2001) Determination of Acidity Constants of Perfluoroalkanoic Acids, Bull. Chem. Soc. Jpn., 74: 667-672
Murakami, M. and Takada, H. 2008. Perfluorinated surfactants (PFSs) in size-fractionated street dust in Tokyo. Chemosphere 73: 1172-1177.
Offenberg, J. H., & Baker, J. E. (1999). Aerosol size distributions of polycyclic aromatic hydrocarbons in urban and over-water atmospheres. Environmental science &
technology, 33(19), 3324-3331.
Ogaki Y., et al., Journal of Japan Air Cleaning Association, 2007. 44(5), 52-56.
Oono, S., Harada, K.H., Mahmoud, M.A.M., Inoue, K., and Koizumi, A. 2008. Current levels of airborne polyfluorinated telomers in Japan. Chemosphere 73: 932-937.
Otani, Y., et al., Earozoru Kenkyu, 2009. 24(1), 5-11.
Otani, Y., Seto, T., Yokogawa, S., Jung, S., Ogaki, Y., & Takizawa, S. (2009). Application of JIS-11 Test Dust to Collection Performance Evaluation of General Ventilation Air Filters. Earozoru Kenkyu, 24(1), 5-11.
Paul, A.G., Jones, K.C., and Sweetman, A.J. 2009. A First Global Production, Emission, And
Environmental Inventory For Perfluorooctane Sulfonate. Environ. Sci. Technol. 43: 386-
392.
P.C. Mahalanobis, On the generalised distance in statistics, Proceedings of the National Institute of Science of India 12 Ž1936. 49–55.
Philadelphia Surban Corporation. 1976. Fire-fighting Composition. 3849315: U.S. Patent.
Piekarz, A.M., Primbs, T., Field, J.A., Barofsky, D.F., and Simonich, S. 2007. Semivolatile fluorinated organic compounds in Asian and western U.S air masses. Environ. Sci.
Technol. 41: 8248-8255.
Prevedouros K, Cousins IT, Buck RC, Korzeniowski SH. Sources fate and transport of perfluorocarboxylates. Environ Sci Technol 2006;40:32–44.
Querol, X., Alastuey, A., Ruiz, C. R., Artinano, B., Hansson, H. C., Harrison, R. M., ... &
Schneider, J. (2004). Speciation and origin of PM10 and PM2. 5 in selected European cities. Atmospheric Environment, 38(38), 6547-6555.
Renner, R. 2001. Growing Concern Over Perfluorinated Chemicals. Environ. Sci. Technol.
35: 154A-160A.
Shoeib, M., Harner, T., M. Webster, G., & Lee, S. C. (2011). Indoor sources of poly-and perfluorinated compounds (PFASS) in Vancouver, Canada: implications for human exposure. Environmental science & technology, 45(19), 7999-8005.
So, M.K., Taniyasu, S., Yamashita, N., Giesy, J.P., Zheng, J., Fang, Z., Im, S.H., and Lam, P.K.S. 2004. Perfluorinated compounds in coastal waters of Hong Kong, South China, and Korea. Environ. Sci. Technol. 38: 4056-4063.
So, M.K., Taniyasu, S., Lam, P.K.S., Zheng, G.J., Giesy, J.P., and Yamashita, N. 2006A.
Alkaline digestion and solid phase extraction method for perfluorinated compounds in mussels and oysters from south China and Japan. Arch. Environ. Contam. Toxicol. 50:
240-248.
So, M.K., Yamashita, N., Taniyasu, S., Jiang, Q.T., Giesy, J.P., Chen, K., and Lam, P.K.S.
2006B. Health risks in infants associated with exposure to perfluorinated compounds in human breast milk from Zhoushan, China. Environ. Sci. Technol. 40: 2924-2929.
Steele WV, RD Chirico, SE Knipmeyer and A. Nguyen, (2002A) Vapor Pressure, Heat Capacity, and Density along the Saturation Line: Measurements for Benzenamine, Butylbenzene, sec-Butylbenzene, tert-Butylbenzene, 2,2-Dimethylbutanoic Acid, Tridecafluoroheptanoic Acid, 2-Butyl-2-ethyl-1,3-propanediol, 2,2,4-Trimethyl-1,3- pentanediol, and 1-Chloro-2-propanol, J. Chem. Eng. Data, 47: 648-666
Steele WV, RD Chirico, SE Knipmeyer and A. Nguyen, (2002B) Measurements of Vapor
Pressure, Heat Capacity, and Density along the Saturation Line for Cyclopropane
Carboxylic Acid, N,N-Diethylethanolamine, 2,3-Dihydrofuran, 5-Hexen-2-one,
Perfluorobutanoic Acid, and 2- phenylpropionaldehyde, J. Chem. Eng. Data, 47: 715-
724.
Polyfluorinated telomer alcohols and sulfonamides in the North American troposphere.
Environ. Sci. Technol. 38: 991-996.
Taniyasu, S., Kannan, K., Horii, Y., Hanari, N., and Yamashita, N. 2003. A survey of perfluorooctane sulfonate and related perfluorinated organic compounds in water, fish, birds, and humans from Japan. Environ. Sci. Technol. 37: 2634-2639.
Tang H, Xiang Q, Lei M, et al. Efficient degradation of perfluorooctanoic acid by UV–Fenton process[J]. Chemical Engineering Journal, 2012, 184: 156-162.
USEPA: Perfluorooctyl sulfonates; Proposed significant new use rule. Federal register 2000, 65:62319-62333.
USEPA: Revised draft Hazard assessment of Perfluorooctanoic acid and its salts. In., 2002.
Väkevä, M., Hämeri, K., Puhakka, T., Nilsson, E. D., Hohti, H., & Mäkelä, J. M. (2000).
Effects of meteorological processes on aerosol particle size distribution in an urban background area. Journal of Geophysical Research: Atmospheres (1984–2012), 105(D8), 9807-9821.
Wallington, T.J., Hurley, M.D., Xia, J., Wuebbles, D.J., Sillman, S., Ito, A., Penner, J.E., Ellis, D.A., Martin, J., Mabury, S.A., Nielsen, O.J., and Andersen, M.P.S. 2006. Formation of C7F15COOH (PFOA) and other perfluorocarboxylic acids during the atmospheric oxidation of 8 : 2 fluorotelomer alcohol. Environ. Sci. Technol. 40: 924-930.
Wang Z, Cousins I T, Scheringer M, et al. Global emission inventories for C 4–C 14 perfluoroalkyl carboxylic acid (PFCA) homologues from 1951 to 2030, Part I: production and emissions from quantifiable sources[J]. Environment international, 2014, 70: 62-75.
Yamashita, N. and Taniyasu, S. 2009. Development of the standard method for testing hazardous chemicals in high-tech industrial products. Report on NEDO project (05A21502d).
Yamashita N, Taniyasu S, Petrick G, et al. Perfluorinated acids as novel chemical tracers of global circulation of ocean waters[J]. Chemosphere, 2008, 70(7): 1247-1255.
Yamazaki E., Taniyasu S., Yamashita N., Enomoto T., Kannan K. (2013).Organohalogen Compounds, 75, 1299-1302.
Yeung, L.W.Y., So, M.K., Jiang, G.B., Taniyasu, S., Yamashita, N., Song, M.Y., Wu, Y.N., Li, J.G., Giesy, J.P., Guruge, K.S., and Lam, P.K.S. 2006. Perfluorooctanesulfonate and related fluorochemicals in human blood samples from China. Environ. Sci. Technol. 40:
715-720.
Yin, J., & Harrison, R. M. (2008). Pragmatic mass closure study for PM1.0, PM2.5 and PM10 at roadside, urban background and rural sites. Atmospheric Environment, 42(5), 980-988.
Zhang L, Liu J, Hu J, et al. The inventory of sources, environmental releases and risk
assessment for perfluorooctane sulfonate in China[J]. Environmental pollution, 2012,
165: 193-198.
Chapter 2 Methodology
The methodology of this research mainly contains three parts: 1) air sampling, including instruments introduction and sample collection procedure; 2) chemical analysis including extraction method and instrumental analysis; and 3) quality assurance and quality control.
2.1 Air sampling
2.1.1 Instruments
In order to collect air samples, total three samplers have been involved in this study.
Two of them were cascade impactors, which were used for get particulate matter samples;
one of them is cryogenic moisture sampler, which can be used to get bulk air
samples or gas phase samples.2.1.1.1 Cascade impactor
A) Nanosampler
Nanosampler (NS40), operated at 40L min
-1, was used for size selective collection of particles in atmosphere. The inlet and filter stages allowed collection of particles in six size fractions including particle diameter (dp) greater than 10μm and less than 0.1μm (specifically, >10, 10–2.5, 2.5–1, 1–0.5, 0.5–0.1, and < 0.1 μm, respectively).
B) Portable Cascade impactor
Portable cascade impactor (NS20), operated at 20L min-1
, was also used for size selective collection of particles in atmosphere. The inlet and filter stages allowed collection of particles in four size fractions including particle diameter (dp) greater than 10μm and less than 1μm (specifically, >10, 10–2.5, 2.5–1 and <1μm, respectively).
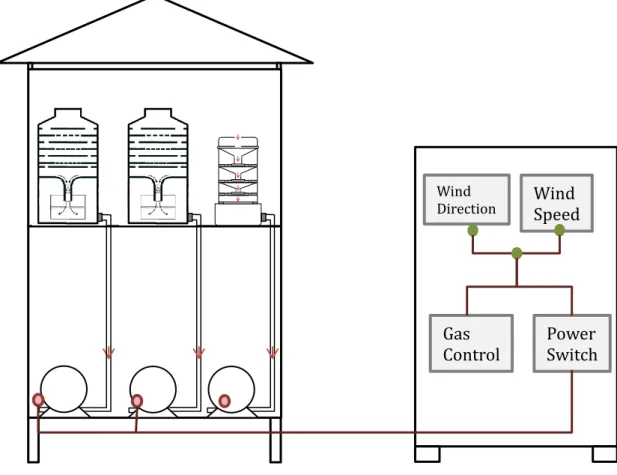
Schematic diagram of samplers (NS40 and NS20) and sampler system (using NS40
as demonstration) have been shown in Figure 7 and Figure 8.
Figure 7 Schematic diagrams of NS40 (left-side) and NS20 (right-side).
Figure 8 Schematic diagram of NS40 sampling system (using NS40 as a demonstration)
2.1.1.2 Cryogenic moisture sampler
Cryogenic moisture sampler (CMS; prototype type 5
thwhich was developed by AIST and SIBATA Co), operated with a flow rate of 20 L min
-1, was used to take air sample (Yamazaki et al., 2011). The sampler could comprehensively collect all chemicals in atmosphere by rapid cooling (-6
゚C to -15
゚C). It is applicable to all PFASs with a wide range of boiling points (120
゚ C to 250゚C; Steele WV et al., 2011; Kaiser MA et al., 2005).
Gas and particle phase of PFASs in atmosphere were collected into bubbler solvent consisted of methanol in Milli-Q water by bubbling and then trapped into cold trap by cooling with -4
˚C. Schematic diagram of CMS sampler has been shown in Figure 9.
Impactor
0.1~0.5mm
<0.1mm 2.5~10mm
1~2.5mm
>10mm Inlet
Outlet Inertial filter
Backup filter
0.5~1mm
P
Air
↑ Nano sampler
↑ Pump
Valve to adjust flow rate
Air
Air Air
Impactor
0.1~0.5mm
<0.1mm 2.5~10mm
1~2.5mm
>10mm Inlet
Outlet Inertial filter
Backup filter
0.5~1mm
Not only CMS can be used individually as an air sampler to take bulk air samples, but also it can be connected with NS20 with inlet, by which system NS20 captured particle phase while CMS trap gas phase simultaneously.
Figure 9 Schematic diagram of CMS type 5
thsystem.
2.1.2 Sample preparation
2.1.2.1 Cascade impactor sample
Ambient particles were collected on quartz fiber filters (QFF, Pallflex, 2500QAT- UP)
set to each stage of sampler. QFF were pre-baked at 350 °C for 3 hours to remove possible
contamination. All filters were conditioned in a weighing chamber with a controlled
temperature (21±1°C) and relative humidity (35±2% RH) for 48 hours and the weight was
measured using a microbalance (readability to 1 μg) before and after the sampling. Figure 10
shows the chart flow for filter weighting procedure. After got particle weight, QFF were
wrapped using aluminium foil, stored in clean polypropylene bags and kept frozen at below -
20°C until analysis.
Figure 10 Chart flow for filter weighting procedure
2.1.2.2 Cryogenic moisture sampler’ sample
Sample preparation and collecting method of CMS were described by Yamazaki et al.
(2011). After sampling, these samples were collected and stored in clean polypropylene bottles and kept frozen at below -20°C until analysis.
2.1.3 Sampling information
2.1.3.1 Meeting room and Roadside air sampling in Tsukuba
Sample collections were carried out in the National Institute of Advanced Industrial Science and Technology (AIST), Tsukuba west campus from September 2014 to February 2016. The experiment was designed for two purposes, one is to establish a method of PM sampling for measurement of PFSAs and PFCAs and the other is to validate the method.
The first experiment was carried out in an air-conditioned meeting room with controlled temperature (25℃) and relative humidity (45±10%) to avoid variability because of weather condition. This experiment was also considered as potential Meeting room air pollution by PFASs. The latter experiment was carried out at the entrance gate of AIST close to car road with heavy traffic, which representing roadside environment.
Two Nanosampers (Furuuchi et al., 2010), located 1.5 m above ground level,
operated at 40L min
-1, were used for sample collection in duplicate, in general. The inlet and
filter stages allowed collection of particles in five size fractions including particle diameter
(dp) greater than 10μm and less than 0.5μm (specifically, >10, 10–2.5, 2.5–1, 1–0.5, and < 0.5
μm, respectively). These air experiments were conducted both summer and winter time, total ten sets of Meeting room samples and ten sets of roadside samples have been collected.
In parallel, two CMS connected with NS20 in the inlet also used in this experiment.
By this sampling unit, particulate matters have been collected in NS20 and gas phase chemicals passed through the NS20 and captured in CMS.
In order to investigate recovery of target chemicals throughout whole procedure of sampling and analysis in laboratory, filters on the first stage of sampler were spiked with 100 μL of surrogate chemicals, namely 13C-labeled internal standards (10 ng ml
-1) prior to air sampling (13C2-PFBA, 13C4-PFOA, 13C5-PFNA, 13C2-PFDA and 13C4-PFOS).
Detail information of sampling campaigns was shown in Table 2.
Table 2 List of samples collected in meeting rooms (representing indoor air) and main gate AIST (representing roadside air).
Sample
I.D. Season
Sampling period
Duplicate or single analysis
Filter Weight
Weather condition Start
date End date
Total sampling time (h)
Temp.
(℃) Weather
Meeting Room
MR1 Summer 14/09/26 14/09/28 44 Single × 14-26 Sunny MR2 Fall 14/10/16 14/10/19 66.4 Single × 6-23 Sunny MR3 Summer 15/07/17 15/07/19 40 Duplicate ○ 23-34 Cloudy
MR4 Summer 15/07/17 15/07/19 40 ○
MR5 Summer 15/07/19 15/07/21 42.4 Duplicate ○
23-34 Sunny
MR6 Summer 15/07/19 15/07/21 42.4 ○
MR7 Summer 15/08/07 15/08/10 63.9 Duplicate ○
23-33 Sunny
MR8 Summer 15/08/07 15/08/10 63.9 ○
MR9 Winter 16/02/19 16/02/22 65.2 Duplicate ○
-1-17 Sunny MR10 Winter 16/02/19 16/02/22 65.2 ○
Roadside
RS1 Summer 15/07/21 15/07/22 24.8 Duplicate ○
23-34 Sunny
RS2 Summer 15/07/21 15/07/22 24.8 ○
RS3 Summer 15/08/06 15/08/07 27.6 Duplicate ○
24-36 Sunny
RS4 Summer 15/08/06 15/08/07 27.6 ○
RS5 Summer 15/08/10 15/08/11 27.8 Duplicate ○ 23-32 Sunny
RS6 Summer 15/08/10 15/08/11 27.8 ○
RS7 Winter 16/02/18 16/02/19 25.6 Duplicate ○
-4-17 Cloudy, Sunny
RS8 Winter 16/02/18 16/02/19 25.6 ○
RS9 Winter 16/02/22 16/02/24 45.8 Duplicate ○
2-9 Cloudy, Rainy RS10 Winter 16/02/22 16/02/24 45.8 ○
2.1.3.2 International field sampling
By using NS40 and NS20, international field survey was carried out from 2012 to 2016. Totally thirty-five samples were collected from eleven locations in four countries, Japan, India, China and USA. The detail monitoring site information is described below and map of sampling site is shown in Figure 11.
a) Kanazawa, Japan: Kanazawa is the capital city of Ishikawa Prefecture, Japan, with a population of 400,000. Kanazawa monitoring site is located in campus of Kanazawa University, a mountainous area without notable emission sources.
b) Okinawa, Japan: Okinawa Island is the largest of the Okinawa Islands and the Ryukyu (Nansei) Islands of Japan, located roughly 640 kilometres (400 mi) south of the rest of Japan, Okinawa monitoring site is located in a peaceful residential area, 3km from seashore.
c) Mt.Fuji, Japan: Mount Fuji, located on Honshu Island, is the highest mountain peak in Japan at 3,776.24 m. The monitoring site was located in Mount Fuji Weather Station at the summit of Mt.Fuji.
d) Hawaii, USA: The Hawaiian archipelago, in the central Pacific Ocean, is located 3,200 km southwest of the continental United States. One sample was taken in subaru telscope at Mt Mauna Kea, Hawaii,
e) Hawaii, USA: the other sample was taken in subaru Telescope Hawaii observation center.
f) India: Chennai sampling site is in Madras University campus, only 1km from seashore.
g) Hong Kong, China: Hong Kong is ranked as the fourth highest population density city in the world. Kowloon sampling site is on one building rooftop of City University of Hong Kong, surrounded by high population density residential area combined with heavy traffic.
h) Yuxi, Yunan, China: Yuxi is a prefecture-level city in the Yunnan province of the People's Republic of China, which located in south west part of China and is a part of Yunnan-Guizhou Plateau. This city is with low population density and no major industrial pollution emission source. The monitoring site is located on a rooftop of a four-floor building in Yuxi Normal Univisity campus.
i) Mt. Jiaozi, Yunnan, China: Mount Jiaozi, located in Kunming city, is the highest mountain peak in Yunan at 4223 m. the monitoring site was located in the middle of the mountain at 3115m.
j) Zhengzhou, China: Zhengzhou is a Chinese city and the provincial capital of Henan
Province in east-central China, with a population of over eight million. The monitoring
site was located on a rooftop of a six floor building in a residential area in suburbs. This
area was mainly surrounded by campus.
k) Beijing, China: Beijing, located in northern China, is the capital of the People's Republic
of China and the world's third most populous city proper. By corporation with Chinese
Academy of Geological Sciences (CAGS), the monitoring site was located on the rooftop
of CAGS research institute, downtown area of Beijing with high population density.
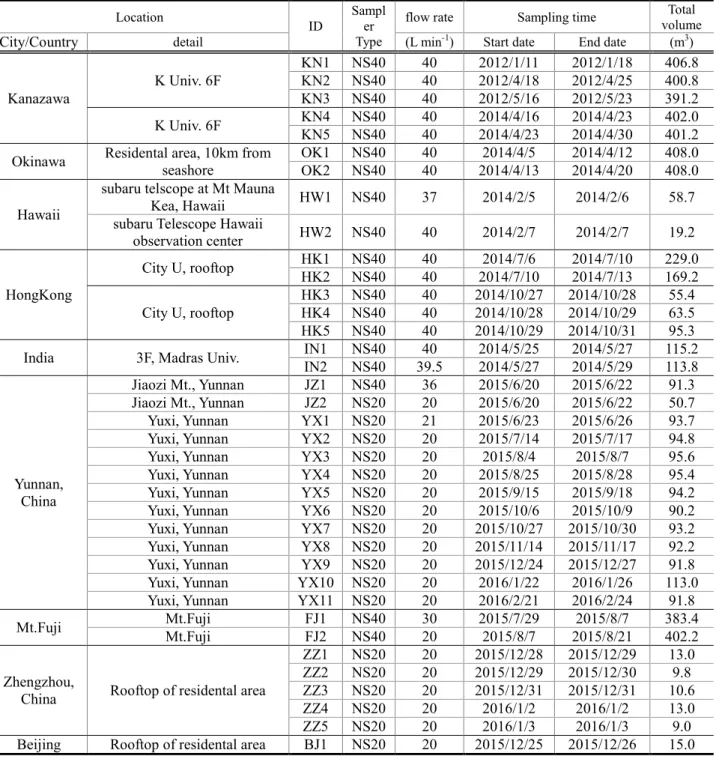
Table 3 list of international field sampling information.
Location
ID
Sampl er Type
flow rate Sampling time Total
volume
City/Country detail (L min-1) Start date End date (m3)
Kanazawa
K Univ. 6F
KN1 NS40 40 2012/1/11 2012/1/18 406.8 KN2 NS40 40 2012/4/18 2012/4/25 400.8 KN3 NS40 40 2012/5/16 2012/5/23 391.2 K Univ. 6F KN4 NS40 40 2014/4/16 2014/4/23 402.0 KN5 NS40 40 2014/4/23 2014/4/30 401.2 Okinawa Residental area, 10km from
seashore OK1 NS40 40 2014/4/5 2014/4/12 408.0 OK2 NS40 40 2014/4/13 2014/4/20 408.0 Hawaii
subaru telscope at Mt Mauna
Kea, Hawaii HW1 NS40 37 2014/2/5 2014/2/6 58.7 subaru Telescope Hawaii
observation center HW2 NS40 40 2014/2/7 2014/2/7 19.2
HongKong
City U, rooftop HK1 NS40 40 2014/7/6 2014/7/10 229.0 HK2 NS40 40 2014/7/10 2014/7/13 169.2 City U, rooftop
HK3 NS40 40 2014/10/27 2014/10/28 55.4 HK4 NS40 40 2014/10/28 2014/10/29 63.5 HK5 NS40 40 2014/10/29 2014/10/31 95.3 India 3F, Madras Univ. IN1 NS40 40 2014/5/25 2014/5/27 115.2
IN2 NS40 39.5 2014/5/27 2014/5/29 113.8
Yunnan, China
Jiaozi Mt., Yunnan JZ1 NS40 36 2015/6/20 2015/6/22 91.3 Jiaozi Mt., Yunnan JZ2 NS20 20 2015/6/20 2015/6/22 50.7 Yuxi, Yunnan YX1 NS20 21 2015/6/23 2015/6/26 93.7 Yuxi, Yunnan YX2 NS20 20 2015/7/14 2015/7/17 94.8 Yuxi, Yunnan YX3 NS20 20 2015/8/4 2015/8/7 95.6 Yuxi, Yunnan YX4 NS20 20 2015/8/25 2015/8/28 95.4 Yuxi, Yunnan YX5 NS20 20 2015/9/15 2015/9/18 94.2 Yuxi, Yunnan YX6 NS20 20 2015/10/6 2015/10/9 90.2 Yuxi, Yunnan YX7 NS20 20 2015/10/27 2015/10/30 93.2 Yuxi, Yunnan YX8 NS20 20 2015/11/14 2015/11/17 92.2 Yuxi, Yunnan YX9 NS20 20 2015/12/24 2015/12/27 91.8 Yuxi, Yunnan YX10 NS20 20 2016/1/22 2016/1/26 113.0 Yuxi, Yunnan YX11 NS20 20 2016/2/21 2016/2/24 91.8
Mt.Fuji Mt.Fuji FJ1 NS40 30 2015/7/29 2015/8/7 383.4
Mt.Fuji FJ2 NS40 20 2015/8/7 2015/8/21 402.2
Zhengzhou,
China Rooftop of residental area
ZZ1 NS20 20 2015/12/28 2015/12/29 13.0 ZZ2 NS20 20 2015/12/29 2015/12/30 9.8 ZZ3 NS20 20 2015/12/31 2015/12/31 10.6 ZZ4 NS20 20 2016/1/2 2016/1/2 13.0 ZZ5 NS20 20 2016/1/3 2016/1/3 9.0 Beijing Rooftop of residental area BJ1 NS20 20 2015/12/25 2015/12/26 15.0
2.1.3.3 Cruise air sampling
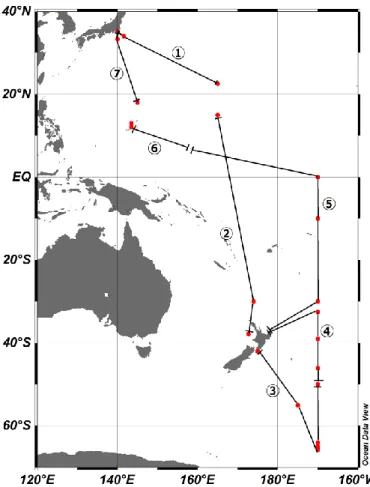
Air sampling experiment was conducted under field condition during KH14-06 cruise and MR15-03 cruise. One CMS, one NS20 and two NS40 were used during these two cruise sampling. Experiment was carried out in the Pacific Ocean and Antarctic Ocean from Dec.2nd 2014 to Feb.14th 2015 during KH14-06 and in the Pacific Ocean and Arctic Ocean from Aug.24th to Oct.22th 2015 during MR15-03. Total fourteen sets of air samples were collected with each sampler during KH14-06 and MR15-03 cruise. Figure 18 and Figure 19 shows track of RV Hakuho-maru during the cruise KH14-06 and track of RV Mirai during the cruise MR15-03. Cruise information is listed in Table 4. Detail sampling information has been listed in Table 5 and Table 6.
In order to avoid contamination from exhaust gas from ship, samples were collected during underway and CTD operation. Meanwhile, wind select unit was used to control power supply of NS40 pump. Relative wind direction condition was set between 110~250°and relative wind speed condition was set between 7m/s to 100m/s. Only if both wind direction and speed conditions were satisfied, the power switch would turn on and enable NS40 sampling system working. Figure 12 demonstrates sampling system on board.
Figure 12 Schematic diagram of air sampling system on board
Air
Wind
Direction
Wind Speed
Power Switch Gas
Control
Air samples were wrapped using aluminum foil, stored in clean polypropylene bags and kept frozen at below -20°C until analysis.
Figure 13 Track of RV Hakuho-maru during the cruise KH14-06. Separatrices mark the start and end
points of each sample during the cruise. Samples were taken in between this and the following
location. Red dots mark seawater-sampling locations.
Figure 14 Track of RV Mirai during the cruise MR15-03. Colors distinguish each sample during the cruise. Samples were taken in between this and the following location.
Table 4 Research cruise information of KH14-06 and MR15-03
Research Cruise informationShip name R/V Hakuho (Tokyo Univ.) R/V Mirai (JAMSTEC)
Cruise name KH14-06 MR15-03
Cruise date December 2014 - February 2015 August 2015 – October 2015 Sampling area North Pacific Ocean - Antarctic Ocean North Pacific Ocean - Arctic Ocean
Sampler NS40*2, NS20, CMS NS40*2, NS20, CMS
Table 5 Samples list for air samples on KH14-06 cruise
Sample ID Sampling time Latitude Longitude Total
sampling time
Total sampling
volume Note
NS20 CMS yyyy MM dd HH:mm deg min N/S deg min E/W (hrs) m³
KH 1 KH-C1 start 2014 12 4 6:55 UTC 34 15.57 N 141 22.19 E
103.67 124.40 North Pacific
stop 2014 12 8 4:00 UTC 23 05.64 N 164 01.87 E
KH 2 KH-C2 start 2014 12 11 10:30 UTC 15 08.63 N 165 00.76 E
110.97 133.16 Pacific
stop 2014 12 21 23:00 UTC 34 51.27 S 171 55.76 E
KH 3 KH-C3 start 2014 12 27 21:55 UTC 46 07.35 S 176 37.50 E
133.12 159.75 Pacific & Antarctic
stop 2015 1 7 23:00 UTC 51 12.64 S 170 00.35 W
KH 4 KH-C4 start 2015 1 9 2:00 UTC 49 59.94 S 170 00.03 W
148.45 178.14 Pacific & Antarctic
stop 2015 1 18 23:00 UTC 35 57.54 S 179 34.35 E
KH 5 KH-C5 start 2015 1 24 19:00 UTC 34 48.86 S 179 11.36 E
91.00 109.21 Pacific
stop 2015 2 10 4:30 UTC 6 28.53 N 174 01.34 E
KH 6 KH-C6 start 2015 2 14 5:00 UTC 7 15.69 N 171 00.84 E
87.99 105.58 North Pacific
stop 2015 2 18 19:00 UTC 12 37.31 N 143 56.53 E
KH 7 KH-C7 start 2015 2 22 8:50 UTC 21 34.72 N 144 00.50 E
41.09 49.30 North Pacific
stop 2015 2 24 23:25 UTC 34 31.74 N 139 51.49 E
Table 6 Samples list for air samples on MR15-03 cruise
Sample ID Sampling time Latitude Longitude Total sampling
time Total sampling
volume Note
NS20 CMS yyyy MM dd HH:mm deg min N/S deg min E/W (hrs) m³
MR 1 MR-C1 start 2015 8 26 11:18 UTC 40 28.23 N 142 00.71 E
102.44 122.93 North Pacific stop 2015 9 6 3:55 UTC 65 28.26 N 168 31.59 W
MR 2 start 2015 9 6 22:32 UTC 67 44.65 N 168 45.31 W
150.17 180.21 Arctic
stop 2015 9 15 4:40 UTC 72 20.26 N 156 10.55 W
MR 3 start 2015 9 18 1:35 UTC 72 17.76 N 155 15.39 W
57.11 68.53 Arctic
stop 2015 9 27 2:30 UTC 73 18.04 N 160 47.07 W MR 4 MR-C2 start 2015 9 27 4:50 UTC 73 18.04 N 160 47.07 W
98.02 117.63 Arctic
stop 2015 10 3 21:22 UTC 65 21.31 N 168 33.27 W MR 5 MR-C3 start 2015 10 3 22:55 UTC 65 04.11 N 168 38.80 W
64.12 76.94 Arctic
stop 2015 10 6 17:05 UTC 50 01.99 N 166 30.10 W MR 6 MR-C4 start 2015 10 9 22:57 UTC 54 13.76 N 164 09.76 W
142.47 170.96 North Pacific stop 2015 10 16 22:37 UTC 43 54.46 N 160 11.19 E
MR 7 MR-C5 start 2015 10 17 0:08 UTC 43 48.08 N 159 58.10 E
65.30 78.36 North Pacific
stop 2015 10 20 21:05 UTC 40 40.01 N 141 37.69 E
2.2 Chemical analysis
2.2.1 Chemicals
All chemicals, standard compounds were of high quality and purity. Information of targets and their abbreviations are as follows. The sodium salts of perfluorohexanesulfonate (PFHxS), perfluoroheptanesulfonate (PFHpS), perfluorooctanesulfonate (PFOS), perfluorodecanesulfonate (PFDS), perfluorooctanoic acid (PFOA), perfluorononanoic acid (PFNA) and
13C-labled
13C
4-PFOS,
13C
2-PFDA,
13C
5-PFNA
13C
4-PFOA, and
13C
4–PFBA were a purchased from Wellington Laboratories Inc. (Guelph, ON, Canada). Perfluoroetyl sulfonate (PFEtS) and perfluoropropyle sulfonate (PFPrS) was donated by JEMCO Inc.
(Akita, Japan). Perfluorobutane sulfonate (PFBS) was from Chiron AS (Trondheim, Norway).
N-ethyl perfluorooctane sulfonamide (N-EtFOSA), N-ethyl perfluorooctanesulfonamido acetate (N-EtFOSAA), N-methyl perfluorooctanesulfonamidoethanol (N-MeFOSE) and N- ethyl perfluorooctanesulfonamidoethanol (N-EtFOSE) were donated by the 3M Company (St.
Paul, MN). Perfluorobutyric acid (PFBA) was supplied by Avocado Research Chemicals, Ltd.
(Lancashire, UK). Perfluorohexanoic acid (PFHxA) was from Wako Pure Chemical Industries (Osaka, Japan). Perfluoropentanoic acid (PFPeA), perfluoroheptanoic acid (PFHpA), PFDA, perfluoroundecanoic acid (PFUnDA) and perfluorododecanoic acid (PFDoDA) and perfluorooctanesulphonyl fluoride (PFOSF) were supplied by Fluorochem Ltd. (Derbyshire, UK). Perfluorotetradecanoic acid (PFTeDA), perfluorohexadecanoic acid (PFHxDA) and perfluorooctadecanoic acid (PFOcDA) were supplied by SynQuest Lab Inc.
(Alachua, FL). Trifluoroacetic acid (TFA), perfluoropropionic acid (PFPrA), 8:2FTOH were
purchased from Daikin Industries Ltd (Osaka, Japan).
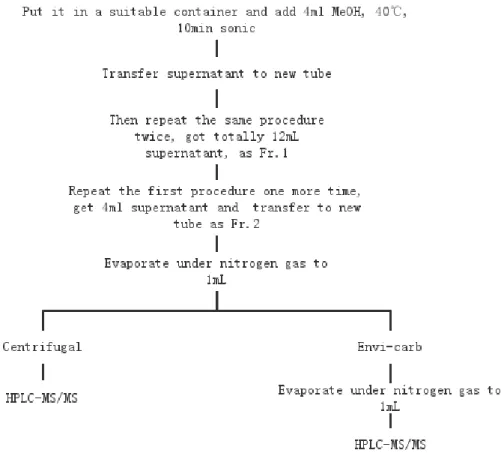
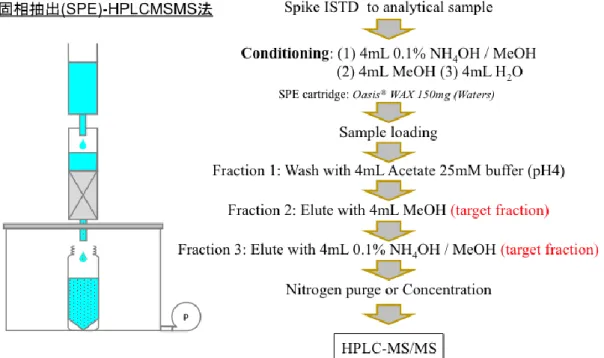
2.2.2 Extraction method
A) Samples collected by cascade impactor