Explaining Prices by Linking Data:
A Pilot Study on Spatial Regression Analysis of Apartment Rents
Bin Shen
Graduate School of Engineering Nagasaki University
Nagasaki, Japan
Tomonari Masada Graduate School of Engineering
Nagasaki University Nagasaki, Japan [email protected]
Abstract—This paper reports a pilot study where we link different types of data for explaining prices. In this study, we link the apartment rent data with the publicly accessible location data of landmarks like supermarkets, hospitals, etc. We apply the regression analysis to find the most important factor determining the apartment rents. We claim that the results of this type of spatial data mining can enhance the user experience in the apartment search system, because we can indicate a rationale behind pricing as additional information to users and thus can make them more confident in their choices.
Keywords—open data; spatial data mining; regression I. INTRODUCTION
In this big data era, it is a worthwhile task to extract valuable insights from different types of data by linking them.
This paper presents a pilot study, where we link the data obtained from a special-purpose database with the publicly available data, i.e., so-called open data, for explaining prices.
In detail, we link the apartment specification data with the publicly available location data of landmarks like supermarkets, hospitals, etc., in Tokyo 23 wards. Our study led to an interesting result where the most important factor determining apartment rents is revealed. It is discussed that 80% of big data is associated with the spatial position data [1]. Therefore, mining spatial data is now a hot research topic [2], and we also follow the trends.
We claim that this type of spatial data mining, where we link the apartment specification data with the landmark location data, can enhance the user experience in the apartment search system by displaying a rationale behind pricing to users as additional information, because we can lead the users to be more confident in their own choices.
There are two reasons we chose Tokyo as the object of our pilot study. The one is that Tokyo can be regarded as an example of developing cities like Beijing and Shanghai. That is, a similar approach can be applied to the apartment rents in such cities. The other reason is that we can easily get a fairly large amount of data for the academic research from the Web.
The remainder of this paper is organized as follows. Section 2 describes the method. Section 3 presents the details of the data used in our pilot study. Section 4 contains the results of the experiment. Section 5 concludes the paper with discussion on how our study can enhance user experience.
II. METHOD
We apply the linear and nonlinear least squares regression analyses to assess the correlation between the apartment rents and the locations of landmarks. The linear regression model can be expressed as y=ax+b+ε, whereyis the response variable, a and b are the regression parameters, and ε is the random error term. We can use the least squares method to estimate a and b [3]. For the observation data
{
xi,yi}
, i = 1, …, n, we minimize the sum of squared deviations
ni=1(yi−axi−b)2 . We additionally use the nonlinear regression model, which can be expressed as y= f(x,θ)+ε, where y is the response variable, f denotes a nonlinear function,θ is the vector of parameters, and ε is the random error term [4]. We also minimize the sum
in= yi− f xi1
))2
, (
( θ by the
least squares method.
III. DATA
We downloaded the apartment specification data from the website http://www.athome.co.jp at a speed of manual download. The specification data include apartment rent, floor number, total floor space, house structure, layout, year since construction, etc. We selected the 5,726 apartment housings satisfying the following conditions:
• The apartment is built in from 2003 to 2013.
• The house structure is reinforced concrete-built.
• The total floor space is from 20 to 26 square meters.
We link this data with the location data of landmarks. The latter data were obtained from http://www.navitokyo.com. We collected geographic locations in latitude and longitude for convenience stores, hospitals, post offices, supermarkets, and universities in Tokyo 23 wards.
For each apartment, we obtain the mean β of the distances to the five nearest landmarks of the same type, e.g. the distances to the five nearest hospitals. Then we normalize the mean distances by β=(β−βmin)/(βmax−βmin), where βmax and βmin are the maximum and the minimum of the mean distances, respectively, over all 5,726 apartment housings.
Table I records the number of each type of landmarks, and the maximum and the minimum of the mean distances. For
example, Table I tells that there is at least one apartment whose mean distance to the five nearest hospitals is 0.146 km. These normalized mean distances are used as the values of the explanatory variable x. The values of the response variable y are the apartment rents in 10,000 yen.
TABLE I. DATA SET STATISTICS
# data βmax (km) βmin (km)
Convenience store 4,659 1.013 0.059
Hospital 422 2.468 0.146
Post office 1,154 1.931 0.261
Supermarket 1,839 1.557 0.022
University 387 10.085 0.172
IV. RESULTS
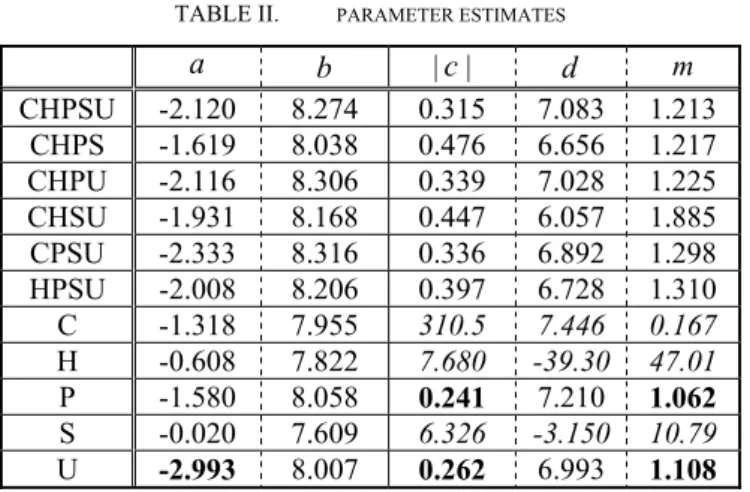
We apply the linear and the nonlinear regression analyses to our linked data and clarify which type of landmarks shows the strongest correlation with the apartment rents. For the linear regression, we use the linear function y=ax+b and estimate the parameters a and b. We focus on the cases where a is a small negative number, because such cases correspond to a strong negative correlation. For the nonlinear regression, we use the Gaussian-shaped function y=mexp(−x2/2c2)+d and estimate c, d, and m. We focus on the cases where |c| is small, because such cases correspond to a peaky function. At the same time, we also focus on the cases where m is large, because m represents the difference of rents between the apartments close to and those far from the landmarks. We used the scikit-learn implementation for our regression analyses.
Table II summarizes the results. C, H, P, S, and U stand for convenience store, hospital, post office, supermarket, and university, respectively. For example, the tag CHSU means that the parameters are estimated by using the location data of convenience stores (C), hospitals (H), supermarkets (S), and universities (U). While we estimated the parameters for all possible combinations of different types of landmarks, only the results for a limited number of combinations are displayed due to space limitation.
TABLE II. PARAMETER ESTIMATES
a b |c| d m
CHPSU -2.120 8.274 0.315 7.083 1.213 CHPS -1.619 8.038 0.476 6.656 1.217 CHPU -2.116 8.306 0.339 7.028 1.225 CHSU -1.931 8.168 0.447 6.057 1.885 CPSU -2.333 8.316 0.336 6.892 1.298 HPSU -2.008 8.206 0.397 6.728 1.310 C -1.318 7.955 310.5 7.446 0.167 H -0.608 7.822 7.680 -39.30 47.01 P -1.580 8.058 0.241 7.210 1.062 S -0.020 7.609 6.326 -3.150 10.79 U -2.993 8.007 0.262 6.993 1.108
For the linear regression, the most remarkable case is U, i.e., the case where we estimate the parameters only by using the location data of universities (cf. Fig. 1, left). In contrast, when we only use the location data of supermarkets (S), the weakest correlation was obtained (cf. Fig. 1, right). For the nonlinear regression, the cases of C, H, and S are not that interesting, because |c| is large, and thus an almost flat function is obtained (cf. Fig. 2, left). For these cases, m is also estimated as a meaningless value. In contrast, the cases of P and U show an interesting correlation. However, the value of m for U is larger than that for P. Therefore, U is again the most remarkable case (Fig. 2, right). It can be said that university locations are the most important factor.
Fig. 1. Linear regression results for U (left) and S (right)
Fig. 2. Nonlinear regression results for C (left) and U (right)
V. CONCLUSION
As a conclusion, we discuss how the proposed analysis can be used for enhancing the user experience. Recall that the apartment housings were selected by the three conditions given in Section III. However, in a real apartment search system, such conditions are specified by users. Since the regression analysis is not that intricate, we can repeat the analysis for each query given to the search system and display a pricing rationale on a search-by-search basis to users. In this manner, we can enhance the user experience by explaining prices based on a statistical analysis of linked data.
REFERENCES
[1] S. Shekhar and H. Xiong (Eds.), Encyclopedia of GIS. New York, Springer, 2007.
[2] S. Chawla, S. Shekhar, W. Wu, and U. Ozesmi, “Extending data mining for spatial applications: a case study in predicting nest locations,” Proc.
Int. Confl. on 2000 ACM SIGMOD Workshop on Research issues in Data Mining and knowledge Discovery (DMKD 2000), Dallas, TX, May 2000.
[3] M.H. Kutner, C.J. Nachtsheim, and J. Neter, Applied linear regression models. McGraw-Hill Higher Education, pp. 15-23, 2003.
[4] D.W. Marquardt, “An algorithm for least-squares estimation of nonlinear parameters,” SIAM J. Appl. Math., Vol. 11, No. 2, pp. 431- 441, 1963.