Characteristics of Clinical Data Packages of Pediatric Medical Products Approved in the US
and Comparison of the Approved Dosages between Pediatric and Adult Populations
Keizo Hanada
Graduate School of Pharmaceutical Sciences,
Department of Clinical Medicine (Pharmaceutical Medicine), Kitasato University
5-9-1 Shirokane, Minato-ku, Tokyo, 108-8641, Japan
This thesis paper was reviewed and approved by
Tomoo lto,Ph.D.
School ofPhattnacy
Kitasato University徳 一
行τ /「 ヶ玲
挽噂i Kumagal,M.D.)Ph.D.
麓tasato U遺versiり East Hospttal
Nishibata,Ph.D。
School ofPhattnacy Khasato U述
versiサMamOrLと
Narukawa,Ph.D.Clraduate Schooi ofPharlnaceutical Sciences Kitasato Universiサ
I
Abstract
A medical product having both excellent efficacy and a high level of safety is required for the treatment of pediatric patients. However, implementation of clinical trials in pediatric population is difficult due to the relatively small population of pediatric patients, parents’ hesitation to enroll their children in clinical trials, and also the difficulty in building incentives for pharmaceutical industries due to insufficient returns on investment.
In the US, Best Pharmaceuticals for Children Act (BPCA) in 2002 and Pediatric Research Equity Act (PREA) in 2003 were established to accelerate the pediatric medical product development. In 2000, the International Conference on Harmonisation of Technical Requirements for Registration of Pharmaceuticals for Human Use (ICH) developed a guideline showing important considerations for the pediatric medical product development, “Clinical Investigation of Medicinal Products in the Pediatric Population” (ICH-E11).
At this time, no research on the trial design, sample size, number of trials and dosage which are the aspects to be considered in the pediatric medical product development plan, has been conducted.
The objective of the present research is to analyze information from labelling (document describing information such as indication, dosage and administration, cautions and clinical trial data) of pediatric medical products in the US to define the characteristics useful for constructing an efficient development plan, including the establishment of clinical data packages for new drug application of pediatric medical products.
As a result of the analysis of pediatric medical products approved in the US from 1998
II
to 2013, clinical data packages submitted for pediatric approval varied widely depending on the targeted age and the therapeutic area. Adoption of blinding and types of comparators varied according to the age range of the pediatric subjects in the trials (P<0.001). A statistically significant difference in the sample size, the number of studies and the number of randomized controlled trials (RCT) were seen among the therapeutic areas (P<0.001).
Regarding the dose ratio between pediatric and adult populations, the approved dosages for pediatrics based on normalized body weight (BW) were higher than those of adults, but the ones based on body surface area (BSA) were almost the same as those of adults.
The closer the age groups, the stronger the correlation of relative dosages between the groups.
The trial design, the sample size, the number of trials, the age range and the dose range to be used in pediatric drug development will affect the development cost and duration;
therefore the result of this research would contribute to the more efficient and effective
implementation of clinical development in pediatrics.
III
Table of Contents
Abstract ... I Table of Contents ... III
List of tables ... 1
List of Figures ... 2
Abbreviations ... 3
1. Introduction ... 4
2. Part I: Characteristics of Clinical Data Packages of Pediatric Medical Products Approved in the US ... 5
2.1. Part I: Introduction ... 6
2.2. Part I: Methods ... 6
2.2.1. Extraction of Key Data ... 6
2.2.2. Examination Based on Clinical Trial Unit ... 8
2.2.3. Examination Based on Indication Unit ... 9
2.3. Part I: Results ... 10
2.3.1. Examination Based on Clinical Trial Unit ... 10
2.3.2. Examination Based on Indication Unit ... 11
2.4. Part I: Discussion ... 14
2.5. Brief Summary ... 16
3. Part II: Comparison of Approved Dosages for Pediatric and Adult Populations Based on US Labeling Information ... 18
3.1. Part II: Introduction ... 18
3.2. Part II: Methods ... 18
3.2.1. Extraction of Key Data ... 18
3.2.2. Mutual Conversion into Dosage Expressed by Age, BW, and BSA ... 19
3.2.3. Comparison across Age Groups ... 20
3.2.4. Comparison across ATC Groups ... 20
3.2.5. Categorization of Clearance Group Based on Pharmacologic Findings .... 21
3.3. Part II: Results ... 21
3.3.1. Characteristics of Labeling Information for Pediatric Patients ... 21
3.3.2. Comparison across Age Groups ... 23
3.3.3. Comparison across ATC Groups ... 27
3.3.4. Comparison across Clearance Groups ... 30
3.4. Part II: Discussion ... 32
IV
3.5. Part II: Brief Summary ... 35
4. Overall Discussion ... 36
5. Conclusions ... 37
6. References... 39
7. Appendix ... 42
8. Acknowledgements ... 45
1
List of tables
Table 2-1 Selected Pediatric Indications Approved in the US between February
1998 and May 2013. 10 Table 2-2 Relationship between the age range of pediatric subjects and the study
design. 11
Table 2-3 Characteristics of the clinical data package for pediatric approval by
ATC classification, administration route, and indicated age. 12
Table 3-1 Anatomical Therapeutic Chemical (ATC) Classification System of
Database Across Ages. 23
Table 3-2 Drug Clearance Category Information by Anatomical Therapeutic
Chemical (ATC) Classification. 32
2
List of Figures
Figure 2-1 Flowchart of labeling selection for analysis. 8
Figure 2-2 Relationship between the number of trial subjects and ratio of RCT
adoption by ATC classification. 14
Figure 3-1 Flowchart of labeling selection for analysis. 22
Figure 3-2 Indication methods of dosage information in the labeling. 22
Figure 3-3 Ratio of pediatric-to-adult dosage by age. 24
Figure 3-4 Relationship of dosage expressed by body weight for patients
between (A) 6 months and 2 years of age, (B) 6 months and 6 years of age, and (C) 6
months and 11 years of age. 25
Figure 3-5 Relationship of dosage expressed by body surface area between (A)
6 months and 2 years of age, (B) 6 months and 6 years of age, and (C) 6 months and 11
years of age. 26
Figure 3-6 Ratio of pediatric (6 months) to adult dosage based on BW by ATC
and (B) BSA by ATC. 28
Figure 3-7 Ratio of pediatric (2 years) to adult dosage based on BW by ATC and
(B) BSA by ATC. 29
Figure 3-8 Ratio of pediatric to adult dosage based on (A) BW by drug clearance
group and (B) BSA by drug clearance group. 31
3
Abbreviations
ATC Anatomical Therapeutic Chemical
ATC Classification
A: alimentary tract and metabolism B: blood and blood forming organs C: cardiovascular system
H: systemic hormonal preparations J: anti-infectives for systemic use
L: antineoplastic and immunomodulating agents M: musculoskeletal system
N: nervous system R: respiratory system
V: various
ARDCA Anthropometric Reference Data for Children and Adults BPCA Best Pharmaceuticals for Children Act
BSA body surface area
BW body weight
CYP Cytochrome P450
FDA Food and Drug Administration
ICH International Conference on Harmonization IQR interquartile range
PDF Portable Document Format PK pharmacokinetic
PREA Pediatric Research Equity Act
RCT randomized controlled trials
4
1. Introduction
Superior medical products that are effective and safe are required for the treatment of disease within the pediatric population
1and pediatric patients should be given medicines that have been appropriately evaluated.
2However, there are problems which are derived from the difficulty in building incentives for the pharmaceutical industry to conduct clinical trials among the pediatric population, i.e. insufficient returns on investment, parents’ hesitation to enroll their children in clinical trials, and a relatively small pediatric patient populations compared with the adult populations.
3Several guidelines have been issued to encourage and facilitate pediatric medical product
development. Authorities in the US have introduced legislations such as the Best
Pharmaceuticals for Children Act (2002, amended 2007)
4and the Pediatric Research
Equity Act (2003)
5following the Food and Drug Administration Modernization Act
(FDAMA; 1997)
6. In Europe, the European Pediatric Rule (2008)
7was introduced as
well. In Japan, authorities have not introduced legislations, but established a committee
on pediatric pharmacotherapy to select drugs and indications to be developed for pediatric
population.
8The ICH E11 guidance, Clinical Investigation of Medicinal Products in the
Pediatric Population, which was published in 2000, provides an outline of critical issues
in pediatric medical product development and approaches to safe, efficient, and ethical
conduct of study of medical products in the pediatric population.
9The principles in
study conduct, statistical considerations and choice of control groups detailed in ICH E6,
E9, and E10 generally apply to pediatric studies. There are, however, certain features
unique to pediatric studies. The ICH E11 guidance states that considerations should be
given to the prevalence of the condition, the seriousness of the condition, the availability
and suitability of alternative treatments for the condition and the age ranges to be treated
5
in the pediatric population. But too much fine classification and examination is not always appropriate, because it might needlessly increase the number of patients to be studied. Sometimes, it may be more appropriate to collect data over broad ranges and examine them generally. The guidance also suggests that when a medical product is to be used in the pediatric population for the same indications as those approved in adults, extrapolation of adult efficacy data to the pediatric population may be appropriate if the disease process is similar in adults and pediatric patients, and the outcome of therapy is likely to be comparable.
Dunne et al. reviewed 370 pediatric studies submitted to the US Food and Drug Administration (FDA) between 1998 and 2008 in response to 159 written requests (166 products) issued under the Pediatric Exclusivity Provision and found that extrapolation of efficacy from the adult population occurred for 82.5% of the drug products (137 of 166).
10They showed extrapolating efficacy from adult to the pediatric population was useful to increase the number of approvals for pediatric use compared to the cases where there was no extrapolation.
However, the handling of several factors proposed in ICH E11 such as study design and the age of patients who participated in the trials has not been analyzed in detail so far.
The purpose of the present study is to characterize key features of pediatric clinical development such as study size and design as well as potentially important factors for dosage selection for the pediatric population, by analyzing clinical data packages for newly approved pediatric products in the US, to determine a desirable way to evaluate efficacy and safety of pediatric products more efficiently.
2. Part I: Characteristics of Clinical Data Packages of Pediatric Medical
6
Products Approved in the US
2.1. Part I: Introduction
The evaluation of efficacy and safety of medical products for pediatric use is difficult due to several circumstances related to conducting clinical trials in pediatric patients. The purpose of the Part I study was to analyze clinical data packages for newly approved pediatric products in the US, where various cases of pediatric drug approval have been accumulating backed by the government, to characterize key features of pediatric clinical development such as study size, study design, and adoption of extrapolation from the angles of therapeutic areas, administration route, and patient age, and others. Based on the analysis, we discuss a desirable way to evaluate efficacy and safety of pediatric products more efficiently.
2.2. Part I: Methods
2.2.1. Extraction of Key Data
All the labeling information listed in the FDA’s website, New Pediatric Labeling Information Database, between February 1998 and May 2013 was used for this study.
11In order to select appropriate labels from the database, drugs with the following criteria were excluded:
1. Drugs for topical use (e.g. for ophthalmologic, dermatological, or otological diseases),
2. Vaccines, diagnostic aid and combination preparations including combination packs,
3. PDF or materials of labeling unavailable online.
In addition, labels which had the following characteristics were excluded:
7
1. Only information on clinical studies (e.g. negative results, postmarketing) available,
2. Indicated only for pediatric use (no indication for adults), 3. For adolescents only or comparable restrictions,
4. Recommended dosages unclear,
5. Detailed information on clinical trials unavailable.
Then, key information for the research was obtained from the selected labeling including
indications, summary of clinical data package, and study design. Information for the
pediatric patients younger than 6 months, such as preterm newborn infants and term
newborn infants, was excluded because insufficient quantity of labeling information was
available. The detailed procedures are further described in the following section. The
flowchart of labeling selection for the analysis is shown in Figure 2-1.
8 2.2.2. Examination Based on Clinical Trial Unit
All the clinical trials except PK studies carried out for the pediatric approval were classified according to the study design in terms of randomization, blinding and types of comparator (placebo, active comparator, different dose and none). For the classification of the comparator, for simplicity, when a placebo and an active comparator were used at the same time, it was categorized as “placebo”, and when an active comparator and different doses of the test product were used, it was categorized as “active comparator”.
Information on the age range of pediatric subjects in each trial was extracted and classified into the following categories: under 2 years old, 2 years old – under 7 years old, 7 years old – under 12 years old, and 12 years old or older. When the number of 12 years or older subjects is added together with adult subjects and is shown in the labeling,
Labeling for analysis N=101 Figure 2-1
Flowchart of labeling selection for analysis.
Labeling listed on FDA website
N=471
Excluding: 177
1. Drugs for topical use (eg, for ophthalmologic , dermatological, or otological diseases)
2. Vaccines, diagnostic aid and combination preparations including combination packs
3. PDF or materials of labeling unavailable online N=294
Excluding: 186
1. Only information on clinical studies (eg, negative results, postmarketing) available
2. Indicated only for pediatric use (no indication for adults) 3. For adolescents only or comparable restrictions 4. Recommended dosages unclear
N=108
Excluding: 7
Detailed information on clinical trials unavailable
9
the number of pediatric subjects except adults was used. Then the relationships between the age range of pediatric subjects and the study design were examined using Fisher’s exact and Kruskal-Wallis tests where appropriate.
2.2.3. Examination Based on Indication Unit
We reviewed the labeling information of the selected products and listed each of their indications. For each pediatric indication, information of the clinical data package was summarized in terms of trial size, design (implementation of randomized controlled trial (RCT) or not) and extrapolation. As for the trial size, number of clinical trials and total number of trial subjects for obtaining the pediatric approval were calculated. In principle, PK studies were excluded from the number of clinical trials except in cases where it was approved solely on PK study data. As for the study design, we classified it as “RCT” if more than one randomized clinical trial had been conducted to obtain the pediatric indication. Also, we classified the indication as “extrapolation” if there was a description in the labeling that adult or older pediatric patient efficacy data were extrapolated to younger pediatric populations. Then such information was summarized by the therapeutic area (ATC classification: World Health Organization’s Anatomic Therapeutic Classification system)
12, administration route, and age range for which the product was indicated (under 2 years old, 2 years old and older and 7 years old and older), and the relationships between them were examined using Fisher’s exact and Kruskal- Wallis tests where appropriate.
Analyses were performed using Microsoft Excel 2010 and R (version 3.0.3)
13. All
statistical tests were 2-tailed and used a type I error rate of .01 to account for multiple
comparisons across clinical trial unit and indication unit.
10 2.3. Part I: Results
Among the labeling of 471 products, we selected 101 product labeling that met the criteria described in the Methods. They consisted of 121 indications with 217 clinical trials.
The number of approved indications and applied legislations between 1998 and 2013 was shown in Table 2-1.
2.3.1. Examination Based on Clinical Trial Unit
Of the 217 clinical trials conducted for pediatric indication, 158 trials (72.8%) were randomized and 142 (65.4%) were blinded. As for the types of comparator, a placebo comparator was used in half of the trials. In the pediatric subjects under 2 years old,
BPCA PREA B&P Rule none
1999 4 1 3
2000 5 5
2001 2 1 1
2002 3 2 1
2003 1 1
2004 13 8 2 3
2005 15 8 5 2
2006 6 1 1 4
2007 4 2 2
2008 17 1 7 9
2009 8 2 2 4
2010 11 3 6 1 1
2011 18 2 10 6
2012 14 12 2
Total 121 32 47 31 10 1
Table 2-1 Selected Pediatric Indications Approved in the US between February 1998 and May 2013.
Year Number of indications
Applied legislations*
* BPCA, Best Pharmaceuticals for Children Act.; PREA, Paediatric Research Equity Act.; B&P, applied both BPCA and PREA; Rule, Pediatric Rule; none, no legislation applied
11
neither blinding nor placebo comparators were used very frequently, whereas in the subjects of 7 years old and older, both were used in more than 70% of the trials.
Adoption of blinding and types of comparators varied according to the age range of the pediatric subjects in the trials. (P<0.001) (Table 2-2)
2.3.2. Examination Based on Indication Unit
Of the 121 indications, 5 were approved only with PK study data. Characteristics of clinical data package, i.e. number of clinical trials and total number of trial subjects, study design (implementation of RCT), and data extrapolation (presence or absence of extrapolation), were examined according to the ATC classifications. The number of clinical trials, total number of trial subjects, and study design varied depending on the ATC classifications. (P<0.001) More pediatric patients were enrolled in the clinical trials for M, N, R and J ATC classifications, but less for L and H classes. The median number of clinical trials per indication was distributed between 1 and 5. Only 1 clinical trial was conducted for almost all indications, but in A, M, N and R classes, two or more clinical trials were conducted.
RCT was adopted more frequently (nearly 90% of the indications) in B, C, H, N and R
All
(n=217) 158(72.8)
[66.4-78.6] 142(65.4)
[58.7-71.7] 108(49.8)
[42.9-56.6] 30(13.8)
[9.5-19.1] 45(20.7)
[15.5-26.7] 34(15.7) [11.1-21.2]
43(59.7)
[47.5-71.1] 35(48.6)
[36.7-60.7] 16(22.2)
[13.3-33.6] 18(25.0)
[15.5-36.6] 23(31.9)
[21.4-44.0] 15(20.8) [12.2-32.0]
89(76.7)
[68.0-84.1] 81(69.8)
[60.6-78.0] 69(59.5)
[50.0-68.5] 10(8.6)
[4.2-15.3] 21(18.1)
[11.6-26.3] 16(13.8) [8.1-21.4]
10(90.9)
[58.7-99.8] 10(90.9)
[58.7-99.8] 8(72.7)
[39.0-94.0] 2(18.2)
[2.3-51.8] 1(9.1)
[0.2-41.3]
16(88.9)
[65.3-98.6] 16(88.9)
[65.3-98.6] 15(83.3)
[58.6-96.4] 1(5.6)
[0.1-27.3] 2(11.1) [1.4-34.7]
Table 2-2 Relationship between the age range of pediatric subjects and the study design.
Age range of pediatric subjects
No. (%) [95% CI]
Randomized Blind Comparator
Placebo Active Different dose None
P value 0.013 <0.001 <0.001
<2years (n=72)
>=2years (n=116)
>=7years (n=11) 0
>=12years (n=18) 0
12
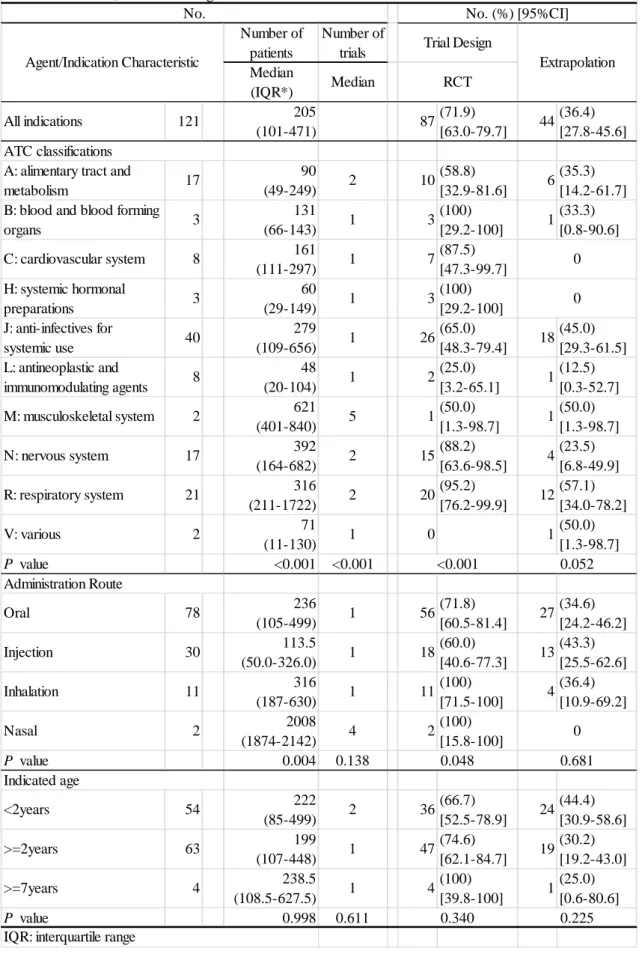
classes, and less in L and M classes. ATC classifications with more than 8 indications were extracted and the median number of subjects and RCT adoption ratio by the ATC classifications were plotted in Figure 2-2. L class had a lower RCT adoption ratio and fewer subjects, whereas N and R classes had a higher RCT adoption ratio and a greater number of subjects.
Among the 121 indications, the approach of extrapolating efficacy data of adult or older
pediatric population to the younger pediatric population was taken in 44 (36.4%)
indications. Tendency of more extrapolation was shown in R, J and M classes, and less
extrapolation in L and N classes, but no statistically significant difference was observed
among the ATC classifications. As for the examination by the administration route and
the indicated age range, no statistically significant difference was found except in the case
between administration route and the number of trial subjects. (Table 2-3)
13 Number of
patients
Number of trials Median
(IQR*) Median
All indications 121 205
(101-471) 87(71.9)
[63.0-79.7] 44(36.4) [27.8-45.6]
A: alimentary tract and
metabolism 17 90
(49-249) 2 10(58.8)
[32.9-81.6] 6(35.3) [14.2-61.7]
B: blood and blood forming
organs 3 131
(66-143) 1 3(100)
[29.2-100] 1(33.3) [0.8-90.6]
C: cardiovascular system 8 161
(111-297) 1 7(87.5)
[47.3-99.7]
H: systemic hormonal
preparations 3 60
(29-149) 1 3(100)
[29.2-100]
J: anti-infectives for
systemic use 40 279
(109-656) 1 26(65.0)
[48.3-79.4] 18(45.0) [29.3-61.5]
L: antineoplastic and
immunomodulating agents 8 48
(20-104) 1 2(25.0)
[3.2-65.1] 1(12.5) [0.3-52.7]
M: musculoskeletal system 2 621
(401-840) 5 1(50.0)
[1.3-98.7] 1(50.0) [1.3-98.7]
N: nervous system 17 392
(164-682) 2 15(88.2)
[63.6-98.5] 4(23.5) [6.8-49.9]
R: respiratory system 21 316
(211-1722) 2 20(95.2)
[76.2-99.9] 12(57.1) [34.0-78.2]
V: various 2 71
(11-130) 1 0 1(50.0)
[1.3-98.7]
P value <0.001 <0.001
Oral 78 236
(105-499) 1 56(71.8)
[60.5-81.4] 27(34.6) [24.2-46.2]
Injection 30 113.5
(50.0-326.0) 1 18(60.0)
[40.6-77.3] 13(43.3) [25.5-62.6]
Inhalation 11 316
(187-630) 1 11(100)
[71.5-100] 4(36.4) [10.9-69.2]
Nasal 2 2008
(1874-2142) 4 2(100)
[15.8-100]
P value 0.004 0.138
<2years 54 222
(85-499) 2 36(66.7)
[52.5-78.9] 24(44.4) [30.9-58.6]
>=2years 63 199
(107-448) 1 47(74.6)
[62.1-84.7] 19(30.2) [19.2-43.0]
>=7years 4 238.5
(108.5-627.5) 1 4(100)
[39.8-100] 1(25.0) [0.6-80.6]
P value 0.998 0.611
IQR: interquartile range
0
0.048 0.681
Indicated age
0.340 0.225
ATC classifications
0 0
<0.001 0.052 Administration Route
Table 2-3 Characteristics of the clinical data package for pediatric approval by ATC classification, administration route, and indicated age.
No. No. (%) [95%CI]
Agent/Indication Characteristic
Trial Design
Extrapolation RCT
14 2.4. Part I: Discussion
As a result of the analysis of the approved pediatric medical products from 1998 through 2013 in the US, it was shown that there was wide variability in the request level for the clinical data package such as total number of trial subjects, number of clinical trials, and adoption of RCT by the ATC classifications and drug administration route to obtain pediatric approval. Examination based on clinical trial unit shows that adoption of blinding and the types of comparators varied according to the age range of the pediatric subjects in the trials. More specifically, less blinding and placebo comparators were observed with younger pediatric subjects, whereas in older subjects an increased usage of blinding and placebo was seen. It was thought that this phenomenon was conspicuously influenced by the pediatric clinical trial characteristics such as the difficulty of obtaining
Figure 2-2 Relationship between the number of trial subjects and ratio of RCT adoption by ATC classification.
A: alimentary tract and metabolism, C: cardiovascular system, J: anti-infective for systemic use, L: antineoplastic, N: nervous system, R: respiratory system
L
A J
N R
C
15
parental consent to enroll their children in clinical trials, the small pediatric patient population and the concern for the risk of unconfirmed side effects for young pediatric patients.
In the examination based on indication unit, total number of trial subjects, number of clinical trials and ratio of RCT adoption were different according to the ATC classifications with statistical significance. Particularly, both the total number of subjects and the ratio of RCT adoption of L class were lower than those of others.
Medical products in L class are used for the purpose of the treatment of serious and/or life-threatening diseases for which no or limited treatment options are available. When a medical product will be used to treat rare and severe diseases with great medical needs, it may be approved with a special clinical data package. This might account for the differences in the number of clinical trials and number of subjects. On the other hand, products in N and R classes have a large number of subjects and high ratio of RCT adoption. Clinical efficacy of products in N class is often difficult to show, and many clinical trials have failed to verify the efficacy. For some products in R class, adverse effects on bone growth are a concern in young pediatric patients. In these therapeutic areas, reaction to medical products may vary depending on the development stage of the children and it is supposed that more clinical trial data in pediatric patients was required to prove the efficacy and safety.
As for the extrapolation of efficacy data of adult or older pediatric population to the
younger pediatric population, it was unexpected that a significant difference was not seen
by the ATC classifications and patient age, but we found some interesting characteristics
in the results. When the extrapolation ratio calculated by dividing the number of
extrapolation by the total number of indications was compared by the ATC classification,
16
the ratios of L and N classes were lower than those in others. It is thought that extrapolation was difficult in L and N classes because there were many cases in which the treatment results were not the same in adults and pediatric patients due to different disease progression. In addition, when the extrapolation ratio was compared among different pediatric ages, the ratio in younger pediatric patients was higher than that in older patients. This may show the difficulty in conducting clinical trials in younger pediatric patients compared to in the older pediatric patients.
A statistically significant difference was seen between the route of drug administration and the number of trial subjects. However, more cases would be necessary to generalize the results of the relationship between the route of drug administration and other factors.
The database used in the present study was established based on the US labeling information and does not necessarily reflect all the information submitted to the FDA with the application. However, the labeling includes reliable safety and efficacy information evaluated by the FDA, and the result of the present study is considered to show a characteristic tendency of clinical data package of pediatric medical products.
Clinical data package of medical products for which pediatric indication was approved by the FDA showed a tendency specific to the age range of pediatric subjects and the therapeutic area in terms of the number of clinical trials and number of subjects, and study design. The result of the present study would provide useful information in planning future pediatric development.
2.5. Brief Summary
A tendency specific to the age range of pediatric subjects and the therapeutic area was
17
seen in the clinical data package for pediatric indication approved in the US from 1998
to 2013. This should be taken into consideration to implement pediatric medical product
development more efficiently and effectively.
18
3. Part II: Comparison of Approved Dosages for Pediatric and Adult Populations Based on US Labeling Information
3.1. Part II: Introduction
Efforts to establish the appropriate dosages in pediatric medicines have been made for a long time. The passing of legislation to promote pediatric drug development in the US and EU has led to a number of approval of dosages for pediatric use. Factors influencing pediatric dosages and limitations of the existing methods for dosage scaling should be clarified to mitigate the risk of pediatric drug treatments as well as to make appropriate development plans for pediatrics. Finding potentially important factors for dosage selection for the pediatric population was the primary goal of this Part II study.
3.2. Part II: Methods
3.2.1. Extraction of Key Data
The labeling information listed in the FDA’s webpage, New Pediatric Labeling Information Database, between February 1998 and May 2013
11, was used for this study.
In order to select appropriate labels from the database, drugs with the following criteria were excluded:
1. Drugs for topical use (e.g. for ophthalmologic, dermatological, or otological diseases),
2. Vaccines, diagnostic aid and combination preparations including combination packs,
3. PDF or materials of labeling unavailable online.
In addition, labels that had the following characteristics were excluded:
1. Only information on clinical studies (e.g. negative results, postmarketing)
19
available,
2. Indicated only for pediatric use (no indication for adults) 3. For adolescents only or comparable restrictions,
4. Recommended dosages unclear.
We then obtained key information for the research, such as dosage for pediatric and adult patients, indications, pharmacokinetic parameters, therapeutic categories, formulation, administration routes, and approval date. The dosages for the pediatric patients younger than 6 months, such as preterm newborn infants and term newborn infants, were excluded because there was insufficient labeling information available.
Additionally, we decided to remove labeling that was limited to adolescents, or comparable restrictions. If there were ranges in dosages in labeling, the higher dosages were selected. When different dosages were used between the start and the maintenance phase, the highest dosage for maintenance was chosen. Labeling for 108 drugs for pediatric patients 6 months and older were extracted for analysis.
3.2.2. Mutual Conversion into Dosage Expressed by Age, BW, and BSA
In the labeling, dosages for the pediatric population are expressed either in terms of age,
BW, or BSA. Using the data on age, BW, and body height (length) from
Anthropometric Reference Data for Children and Adults (ARDCA; FDA CDC; 2007-
2010),
14the dosages in the individual labels were standardized to be comparable among
groups. The basal level for weight and height were derived from the 50th percentile
population values from ARDCA. The BSA was calculated from height and weight
according to equations proposed by Mosteller.
15The ratio of pediatric-to-adult dosage
was used to analyze differences across age groups, ATC classification groups, and drug
20
clearance groups.
3.2.3. Comparison across Age Groups
The dosages for different age groups were calculated and converted into dosages expressed by age, normalized BW, and normalized BSA. Dosage ratios at several ages - 6 months, 2 years, 6 years, 11 years, and 16 years - were calculated as the ratio of pediatric patients at each stage to adult dosage as expressed by age, BW, and BSA.
There are recommended categories for drug treatments, as shown in the age classification of pediatric patients of the ICH-E11.
9They are defined by age bands, for example, preterm newborn infants, term newborn infants (0-27 days), infants and toddlers (28 days-23 months), children (2-11 years), and adolescents (12 to 16-18 years [depending on the region]). In order to make a database to compare age groups, representative values of each category need to be created. However, appropriate representative values cannot be calculated using wide age bands owing to developmental issues (e.g. physical, cognitive, and psychosocial) across age categories.
3.2.4. Comparison across ATC Groups
Drugs in the database were categorized according to the ATC classification system
controlled by the Collaborating Centre for Drug Statistics Methodology, World Health
Organization.
12Although the dosage ratios for analysis were calculated at several age
stages for each ATC classification category in terms of BW and BSA, attention was
focused on ratio of pediatric-to-adult dosage at 6 months and 2 years of age, where
pediatric metabolism may move into different phases.
1621
3.2.5. Categorization of Clearance Group Based on Pharmacologic Findings
The information on drug clearance of the products was collected from the labeling by applying the method of Rodriguez et al
2, which was conducive to handling of various descriptions of drug clearance in the labeling. The observations of drug clearance (or apparent oral clearance) were grouped into the following 3 categories: I = lower drug clearance (or apparent oral clearance) in younger patients, II = drug clearance (or apparent oral clearance) increases with the increasing body weight (up to adult values), and III = higher apparent oral clearance (or higher drug clearance) in younger patients.
Then, each group was compared by dosage ratio to adults normalized by BW and BSA.
3.3. Part II: Results
3.3.1. Characteristics of Labeling Information for Pediatric Patients
The flowchart of labeling selection for analysis is shown in Figure 3-1. Figure 3-2
shows the indication methods of the dosage information in the labels. Dosage
information indicated by BW accounted for over 70% of the labeling. Cases in which
dosages were indicated by a mix of age and BW or BSA were categorized as either BW
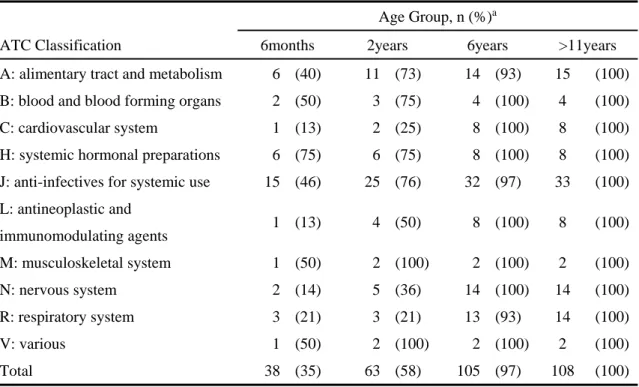
or BSA. Table 3-1 shows the results, with cumulative percentages for each age group,
up to the 11-year age group, in parentheses.
22 Labeling for analysis
N=108 Figure 3-1
Flowchart of labeling selection for analysis.
Labeling listed on FDA website
N=471
Excluding: 177
1. Drugs for topical use (eg, for ophthalmologic , dermatological, or otological diseases)
2. Vaccines, diagnostic aid and combination preparations including combination packs
3. PDF or materials of labeling unavailable online N=294
Excluding: 186
1. Only information on clinical studies (eg, negative results, postmarketing) available
2. Indicated only for pediatric use (no indication for adults) 3. For adolescents only or comparable restrictions 4. Recommended dosages unclear
23
Table 3-1 Anatomical Therapeutic Chemical (ATC) Classification System of Database Across Ages.
ATC Classification
Age Group, n (%)a
6months 2years 6years >11years A: alimentary tract and metabolism 6 (40) 11 (73) 14 (93) 15 (100) B: blood and blood forming organs 2 (50) 3 (75) 4 (100) 4 (100)
C: cardiovascular system 1 (13) 2 (25) 8 (100) 8 (100)
H: systemic hormonal preparations 6 (75) 6 (75) 8 (100) 8 (100) J: anti-infectives for systemic use 15 (46) 25 (76) 32 (97) 33 (100) L: antineoplastic and
immunomodulating agents 1 (13) 4 (50) 8 (100) 8 (100)
M: musculoskeletal system 1 (50) 2 (100) 2 (100) 2 (100)
N: nervous system 2 (14) 5 (36) 14 (100) 14 (100)
R: respiratory system 3 (21) 3 (21) 13 (93) 14 (100)
V: various 1 (50) 2 (100) 2 (100) 2 (100)
Total 38 (35) 63 (58) 105 (97) 108 (100)
aCumulative percentage of each age group to 11-year of age group.
3.3.2. Comparison across Age Groups
Figure 3-3 shows box plots illustrating ratio of pediatric-to-adult dosage by age group
in terms of age, BW, and BSA. The dosage ratios to adults were as follows: in terms
of age, they ranged from 0.21 at 6 months to 0.94 at 16 years; in terms of BW, they
ranged from 2.15 at 6 months to 1.19 at 16 years; and in terms of BSA, they ranged
from 1.09 at 6 months to 1.10 at 16 years. Although the dosages of pediatric patients
based on BW were higher than those of adults, the ones based on BSA were almost the
same as those of adults. The ratios of pediatric-to-adult dosages at age 6 months were
compared to those at ages 2, 6, and 11 years, and all individual data on dosage ratios in
the database were plotted in a scatter diagram based on BW and BSA.
24
25
A
B
C
26
A
B
C
27
The relationships of dosages between age groups were analyzed in terms of coefficient of correlation values. The results are shown in Figure 3-4 and Figure 3-5. Relative dosages at 6 months of age showed a stronger correlation with those at age 2 years compared to those at 6 or 11 years of age. In addition, no significant differences of correlation at corresponding age groups between BW base and BSA base were observed.
3.3.3. Comparison across ATC Groups
The results comparing dosage ratios based on BW and BSA at 6 months and 2 years of
age are shown as box plots in Figure 3-6 and Figure 3-7. At both ages, the dosage
ratios for the H, J, and L ATC classifications were higher than 1; on the contrary, those
for ATC classes B and C were below 1. When the dosage ratios at age 6 months were
compared to those at age 2 years, the dosage ratios for the L and R classes at 6 months
were higher than those at 2 years, and the dosage ratios for the B, C, M, and N classes
at 6 months were lower than those at 2 years.
28
A
B
_ _
_ _
29
A
B
_ _
_ _
30 3.3.4. Comparison across Clearance Groups
Figure 3-8 shows the ratio of pediatric-to-adult dosage by BW and BSA in terms of drug clearance category seen in patients 6 months to 16 years of age. The data in category III indicate that some young patients in the groups had larger dosage ratios by BW and BSA than did adults. On the contrary, the dosage ratios of some young patients in categories I and II were smaller than those of adults based on BW and BSA.
However, in each category, some young patients showed opposite results in dosage ratio.
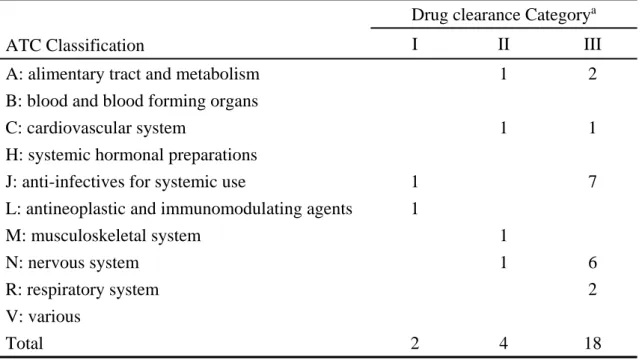
The data in categories I, II, and III stratified by ATC classification are shown in Table
3-2. Data were distributed widely across classifications, but category III labeling was
frequently seen in the J and N classes.
31
A
B
32
Table 3-2 Drug Clearance Category Information by Anatomical Therapeutic Chemical (ATC) Classification.
ATC Classification
Drug clearance Category
aI II III
A: alimentary tract and metabolism 1 2
B: blood and blood forming organs
C: cardiovascular system 1 1
H: systemic hormonal preparations
J: anti-infectives for systemic use 1 7
L: antineoplastic and immunomodulating agents 1
M: musculoskeletal system 1
N: nervous system 1 6
R: respiratory system 2
V: various
Total 2 4 18
a
Category I, lower drug clearance in younger patients;
Category II, drug clearance increases with increasing body weight;
Category III, higher apparent oral clearance in younger patients.
Drug clearance group: Trade name (generic name) of products; ATC (I) Cancidas (caspofungin); J, Faslodex (fulvestrant); L
(II) Concerta (methylphenidate); N, Protonix (pantoprazole); A, Toprol (metoprolol); C, Zemuron (rocuronium); M
(III) Accolate (zafirlukast); R, Adderall (amphetamine mixed salts); N, Epivir (lamivudine); J, Invanz (ertapenem); J, Keppra (levetiracetam); N, Lamictal (lamotrigine); N, Levaquin (levofloxacin); J, Lexiva (fosamprenavir); J, Lotensin (benazepril); C, Norvir (ritonavir); J, TamiFlu (oseltamivir); J, Topamax (topiramate);
N, Trileptal (oxcarbazepine); N, Ultiva (remifentanil); N, Xyzal (levocetirizine dihydrochloride); R, Zantac (ranitidine); A, Zofran (ondansetron); A, Zyvox (linezolid); J
3.4. Part II: Discussion
In this study, dosage information in the pediatric population was investigated based on
the FDA’s New Pediatric Labeling Information Database. In previous studies related
to dosage scaling in pediatric subjects, some studies used pharmacokinetic and
33
clearance data derived from the literature, and some used mixed data from both unlicensed drugs and licensed drugs.
16,17There are few studies on dosage selection that refer solely to approved drugs in pediatric patients.
2,10,17All of the information in the present study was derived from the pediatric drug labels that were evaluated and approved by FDA in terms of efficacy and safety. Therefore, the approved dosages in pediatric patients can be assumed to be more appropriate to compare to dosage selection in adults. There is a possibility that dosages for the pediatric clinical trials were set based on conventional methods such as BSA referring to adult dosages, which may have resulted in a good correlation between pediatric and adult dosages. However, we emphasize the fact that those pediatric dosages have been approved and widely used in clinical practice.
In the present study, 108 labels of pediatric drugs for patients 6 months and older were extracted for analysis. Although the topic of dosages for preterm newborn infants and term newborn infants is attracting attention for pediatric drug treatments, information pertaining to those groups for the purpose of analysis is very limited at the moment.
After standardizing the individual dosages based on age, BW, and BSA, the ratios of
pediatric-to-adult dosage were calculated and compared across ages, ATC classification,
and drug clearance groups. From the results of the differences in ratios of pediatric-
to-adult dosage based on BW, it was found that the dosage ratios to adults were between
1.19 and 2.15. This means that approved dosages for pediatric patients increased
more than those of adults in general. Bartelink et al
18reported that for many drugs,
body weight–normalized drug clearance in children exceeds that of an adult and
suggested an increase of the dosage based on body weight for most drugs. The results
of the present study strongly support the suggestion. On the other hand, the dosage
34
ratios to adults based on BSA were between 1.09 and 1.10, almost the same as those of adults in this study. It was reported that although scaling methods based on BSA can be considered to overpredict clearance in neonates and infants after 6 months of age, BSA is a good marker as a basis of drug dosing
18,19; our results are consistent with those findings.
The relationship of dosages at 6 months to those at other ages was analyzed using ratios of pediatric-to-adult dosages. Relative dosages at 6 months of age showed a stronger correlation with those at age 2 years compared to those at age 6 or 11 years. It may be due to metabolism and renal function, because it was known that the half-life of drugs in young pediatric patients, 6 months to 2 years of age, becomes significantly short compared to adults for renally cleared substrate, Cytochrome P450 (CYPs) substrates, and glucuronidation substrates.
16Reasons for the differences in correlation tendencies among those age groups remain largely speculative, but some specific factors may affect a variety of relationships at 6 months of age group with other age groups in terms of dosage ratios to those of adults. The present study suggests that when dosage is selected in young pediatric patients, it is important to take into consideration the fact that the closer the age groups, the stronger the correlation of relative dosages between the groups.
The dosage ratios across ATC classification were extremely varied. At both 6 months and 2 years of age based on BW and BSA, labels for drugs in the H, J, and L groups had ratios higher than 1, and dosage ratios in the B and C groups were below 1.
In order to interpret the evidence, information on drug clearance by ATC group is
shown in Table 3-2. In the H and B groups, there was neither high nor low clearance
labeling. In J and L groups, there was some high clearance labeling, but not all. In
35
the C group, there was 1 category II and 1 category III labeling, but the remaining 6 labels were standard or not characterized. Therefore, this observed variety cannot be explained by clearance. It was thought that the variety might be derived from the characteristics of the compound such as hydrophilicity/lipophilicity and/or the change of volume of distribution in the development process in children. There still remain unclear factors that may influence dosage selection. Future research should attempt to clarify such factors on dosage selection and to reflect them on optimization of pediatric drug dosing.
3.5. Part II: Brief Summary
In this study, comparison of the dosage of approved pediatric drugs from 6 months to
16 years of age with those of adult drugs was performed by referring to labeling listed
in the FDA’s New Pediatric Labeling Information Database and standardizing dosage
based on BW and BSA. The resulting comparison of ratios of pediatric-to-adult
dosage in terms of BW and BSA are consistent with available evidence. From the
correlation analysis of the relationship of pediatric to adult dosages, the closer the age
groups, the stronger the correlation of relative dosages between the groups.
36
4. Overall Discussion
The ICH E11 guidance states that, in proceeding with a pediatric development program for a medical product, considerations should be given to the prevalence of the condition, the seriousness of the condition, the availability and suitability of alternative treatments for the condition, and the age ranges to be treated in the pediatric population.
As a result of the analysis of the approved pediatric medical products from 1998 through 2013 in the US, the present study showed some important points to be considered for pediatric medicine development. There was wide variability in the request level for the clinical data package such as total number of trial subjects, number of clinical trials, and adoption of RCT by the ATC classifications and drug administration route to obtain pediatric approval. Examination based on clinical trial unit shows that adoption of blinding and the types of comparators varied according to the age range of the pediatric subjects in the trials. It was thought that this phenomenon was conspicuously influenced by the pediatric clinical trial characteristics such as the difficulty in obtaining parents’ consent to enroll their children in clinical trials, the small pediatric patient population, and the concern for the risk of unconfirmed side effects for young pediatric patients. In the examination based on indication unit, total number of trial subjects, number of clinical trials and ratio of RCT adoption were different by the ATC classifications with statistical significance. In some therapeutic areas, reaction to medical products may change more significantly depending on the development stage of children and it is supposed that more clinical trial data in pediatric patients was required to prove the efficacy and safety.
Also, in this study, the relationship of dosages at 6 months to those at other older
pediatric ages was analyzed using ratios of pediatric-to-adult dosages and it was
37
suggested that the closer the age groups, the stronger the correlation of relative dosages between the groups. This should be taken into consideration when dosage is selected in younger pediatric patients and also when extrapolation of efficacy/safety data from adult or older pediatric patients to younger pediatric patients is attempted.
The database used in the present study was established based on the US labeling information and does not necessarily reflect all the information submitted to the FDA with the application. However, the labeling includes reliable safety and efficacy information evaluated by the FDA, and the result of the present study showed a characteristic tendency of clinical data package of pediatric medical products. The findings concerning trial design, sample size, number of trials, age range and dose range are important factors to be considered to implement efficient clinical studies in pediatric populations, because they will affect the development cost and duration. The Japanese regulatory authorities encourage pharmaceutical companies to develop drugs and indications including pediatric use that have been approved for use in the Western countries but not yet in Japan. There are many risk factors to be considered related to the development stage of children when clinical trials involving pediatric patients are being planned. The result of the present study would provide practical and useful information in planning future pediatric development in Japan as well as in the US.
5. Conclusions
A tendency specific to the age and the ATC classifications was seen in the clinical data package of pediatric medical products approved in the US from 1998 to 2013.
Relationship of relative dosages at different pediatric ages showed a stronger correlation
between the groups of closer ages. These points should be considered to implement
38
pediatric medical product development more efficiently and effectively.
39
6. References
1. Munzenberger PJ, McKercher P. Pediatric dosing: the pharmacist dilemma.
Contemp Pharm Pract. 1980;3(1):11-14.
2. Rodriguez W, Selen A, Avant D, et al. Improving pediatric dosing through pediatric initiatives: what we have learned. Pediatrics. 2008:121;530.
3. Caldwell PH, Murphy SB, Butow PN, Craig JC. Clinical trials in children. Lancet.
2004;364:803-11.
4. Best Pharmaceuticals for Children Act.
http://www.fda.gov/Drugs/DevelopmentApprovalProcess/DevelopmentResources /ucm049876.htm. January 4, 2002. Accessed May 3, 2014.
5. The Paediatric Research Equity Act.
http://www.fda.gov/downloads/Drugs/DevelopmentApprovalProcess/Developme ntResources/UCM077853.pdf. 2003. Accessed June 22, 2014.
6. Guidance for Industry. Qualifying for pediatric exclusivity under section 505A of the Federal Food, Drug and Cosmetic Act.
http://www.fda.gov/downloads/RegulatoryInformation/Legislation/FederalFoodD rugandCosmeticActFDCAct/SignificantAmendmentstotheFDCAct/FDAMA/Full TextofFDAMAlaw/UCM089145.pdf. November 21, 1997. Accessed May 3, 2014.
7. Communication from the Commission: guideline on the format and content of
applications for agreement or modification of a paediatric investigation plan and
requests for waivers or deferrals and concerning the operation of the compliance
check and on criteria for assessing significant studies. Official Journal of the
European Union. 2008;c243/01-12.
40
8. Ministry of Health, Labour and Welfare, The committee on Pediatric Pharmacotherapy. http://www.mhlw.go.jp/stf/shingi/other- iyaku.html?tid=128694 Accessed May 10, 2015.
9. International Conference on Harmonisation; Guidance on E11 Clinical Investigation of Medicinal Products in the Pediatric Population; Availability.
Department of health and human services. Food and Drug Administration.
Published December 15, 2000.
http://www.fda.gov/ohrms/dockets/98fr/121500a.htm. Accessed May 3, 2014.
10. Dunne J, Rodriguez WJ, Murphy MD, et al. Extrapolation of adult data and other data in pediatric drug-development programs. Pediatrics. 2011;128:e1242-e1249.
doi:10.1542/peds.2010-3487.
11. U.S. Food and Drug Administration. New pediatric labeling information database. U.S. Food and Drug Administration.
http://www.accessdata.fda.gov/scripts/sda/sdNavigation.cfm?sd=labelingdatabase
&displayAll=true#.UNUrMgqbFbQ.email. Updated May 21, 2013. Accessed June 15, 2013.
12. ATC/DDD index 2014. WHO Collaborating Centre for Drug Statistics Methodology. http://www.whocc.no/atcddd/indexdatabase/. Updated December 19, 2013. Accessed January 14, 2014.
13. R Core Team (2014). R: A language and environment for statistical computing. R Foundation for Statistical Computing, Vienna, Austria.
URL http://www.R-project.org/ Accessed May 20, 2015.
14. Fryar CD, Gu Q, Ogden CL. Anthropometric reference data for children and
adults: United States, 2007-2010. National Center for Health Statistics. Vital
41
Health Stat. Published October, 2012.
http://www.cdc.gov/nchs/data/series/sr_11/sr11_252.pdf. Accessed October 28, 2013.
15. Mosteller RD. Simplified calculation of body-surface area. N Engl J Med 1987;
317(17):1098.
16. Ginsberg G, Hattis H, Sonawane B, et al. Evaluation of child/adult pharmacokinetic differences from a database derived from the therapeutic drug literature. Toxicol Sci 2002;66(2):185-200.
17. Johnson TN. The problems in scaling adult drug doses to children. Arch Dis Child 2008;93:207-211. doi:10.1136/adc.2006.114835.
18. Bartelink HI, Rademaker CMA, Schobben AFAM. Guidelines on paediatric dosing on the basis of developmental physiology and pharmacokinetic considerations.
Clin Pharmacokinet 2006;45(11):1077-1097.
19. Hawcutt DB, Smyth RL. One size does not fit all: getting drug doses right for
children. Arch Dis Child 2008;93(3):190-191.
42
7. Appendix
Number of products
Number of
indications Trade name Generic name Approved
year ATC Clearance category*
1 1 Accolate Tablets zafirlukast 1999 R III
2 2 Adderall XR amphetamines mixed salts 2005 N III
3 3 Afinitor everolimus 2010 L
4 4 Agenerase Capusles and Oral
Solution amprenavir 2001 J
5 5 Agrylin anagrelide 2004 L
6 6 Allegra fexofenadine 2006 R
7 7 Amaryl glimepiride 2005 A
8 AmBisome Injection amphotericin B 2000 J
9 AmBisome Injection amphotericin B 2000 J
9 10 Aptivus tipranavir 2008 J
11 Asmanex Twisthaler 110mcg
inhalation powder mometasone furoat 2008 R
12 Asmanex Twisthaler 110mcg
inhalation powder mometasone furoat 2008 R
11 13 Atacand candesartan 2009 C
12 14 Benicar olmesartan 2010 C
15 Cancidas caspofungin 2008 J I
16 Cancidas caspofungin 2008 J
14 17 CellCept mycophenylate 2000 L
15 18 Cipro ciprofloxacin 2004 J
16 19 Clarinex desloratadine 2004 R
17 20 Colazal balsalazide 2006 A
18 21 Concerta methylphenidate 2004 N II
19 22 Corlopam fenoldopam 2004 C
20 23 Cozaar losartan 2004 C
21 24 Creon pancrelipase 2011 A
22 25 Diovan valsartan 2007 C
23 26 Emtriva emtricitabine 2006 J
24 27 Epivir lamivudine 2002 J III
25 28 Epivir-HBV lamivudine 2001 J
26 29 Faslodex Injection fulvestrant 2011 L I
27 30 Ferrlecit sodium ferric gluconate complex 2004 B
31 Flovent Diskus Inhalation Powder fluticasone 2000 R
32 Flovent Diskus Inhalation Powder fluticasone 2000 R
33 Flovent HFA fluticasone propionate 2008 R
34 Flovent HFA fluticasone propionate 2008 R
30 35 Focalin XR dexmethylphenidate 2009 N
31 36 Fuzeon enfuvirtide 2006 J
32 37 Gadavist gadobutrol 2011 V
38 GAMMAGARD LIQUID immune gobulin infusion (human) 2011 J 39 GAMMAGARD LIQUID immune gobulin infusion (human) 2011 J
34 40 Gleevec imatinib mesylate 2006 L
35 41 Intelence etravirine 2012 J
42 Invanz ertapenem 2005 J III
43 Invanz ertapenem 2005 J
37 44 Isentress raltegravir 2011 J
45 Keppra levetiracetam 2011 N III
46 Keppra levetiracetam 2011 N
39 47 Kytril Injection granisetron hydrochloride 2011 A
40 48 Lamictal lamotrigine 2009 N III
cont.
33
36
38
Selected Labeling for Analysis. 1 of 3 Part 1
Part 2
8
10
13
28 29 101 products (121 indications)for Part 1 108 productsfor Part 2