Uterine endometrial carcinoma with DNA mismatch repair
deficiency: Magnetic resonance imaging findings and clinical
features
Abstract
Purpose:The purpose of this study was to identify the magnetic resonance imaging(MRI) features of uterine endometrial
carcinoma(EC) with DNA mismatch repair(MMR) deficiency.
Materials and Methods:This was a retrospective study approved by our institutional review board. The study included 118
patients pathologically diagnosed as having EC in our institution from April 2014 to December 2016. Of 118 patients, 8 were
excluded because of insufficient data.Immunohistochemical analysis of MMR was performed retrospectively to observe the expressions of MLH1, MSH2, MSH6, and PMS2. A tumor with MMR deficiency was detected in 17 of 110 cases (15%). Clinical background characteristics and MRI findings were reviewed.
These findings were compared between MMR deficiency group
and the other group as a control group. Statistical significance
was determined using the Fisher’s exact test and the Mann-Whitney U-test, as appropriate.
Results:The clinical background characteristics of patients with EC with MMR deficiency were not significantly different from those of other patients. On MRI, the tumor was significantly more often located in the lower uterine site (MMR(-) vs. MMR(+): 29.4%
vs. 8.9% [p=0.0366]).
Conclusion:EC with MMR deficiency tends to be located lower in the uterus, though most other findings were not significantly different from those of EC without MMR deficiency.
Keywords
Uterus, Endometrial carcinoma, MMR deficiency, MRI, Lynch
syndrome
Abbreviations
MMR: Mismatch repair
MSI: Microsatellite instability
ADC: Apparent diffusion coefficient CRC: colorectal cancer
DWI: Diffusion-weighted imaging IHC: Immunohistochemistry
MRI: Magnetic resonance imaging TMA: Tissue microarray
EC: Endometrial carcinoma T1WI: T1-weighted imaging T2WI: T2-weighted imaging
CE-T1WI: Contrast-enhanced T1-weighted imaging
PTE: Peritumoral enhancement
SEE: Subendometrial enhancement LUS: Lower uterine segment
MSI: Microsatellite instability
Introduction
The DNA mismatch repair gene (MMR) plays an
important role in anti-carcinogenesis and MMR gene deficiency.
Uterine endometrial carcinoma (EC) with MMR deficiency has been estimated to account for 23-35% of all cases of EC (1-3).
Lynch syndrome, well known as hereditary non-polyposis colon cancer, is an autosomal dominant cancer caused by mutations of MMR genes (4-6). EC is the second most common malignancy associated with Lynch syndrome (2). However, the lifetime risk of EC in patients with Lynch syndrome is considered to surpass that of colorectal cancer (7-9). Recognizing EC with MMR gene
deficiency may lead to early diagnosis of Lynch syndrome. To the
best of our knowledge, the radiological findings of EC with MMR
deficiency have not been previously reported, excepting for one
article (10). The aim of this study was to identify the magnetic
resonance imaging (MRI) features of EC with MMR deficiency.
Materials and Methods Patients
This was a retrospective study approved by our
institutional review board. A total of 118 patients pathologically diagnosed with EC in our institution from April 2014 to December 2016 were retrospectively identified. Of the 118 patients, 8 (6.8%) were excluded because of no MRI data in this hospital.
On immunohistochemistry (IHC), 17 (14.4%) patients
(median age 54 years, age range 41-73 years) were pathologically
diagnosed as having EC with MMR deficiency. As controls in this
study, 93 (79.4%) patients (median age 56 years, age range 28-92
years) were pathologically diagnosed with EC without MMR
deficiency. Of the 93 patients, 3 did not undergo enhanced MRI
and diffusion-weighted imaging (DWI). In 5 of 93 patients,
dynamic MRI, DWI, and apparent diffusion coefficient (ADC)
values were invalid because the tumor was so small it could not be detected. In 15 of 93 patients, ADC values could not be used because of inappropriate data.
Of 17 patients, two did not undergo enhanced MRI, and one did not undergo DWI. In one of 17 patients, ADC values could not be used because of inappropriate data.
Patients’ medical records were reviewed to check clinical background characteristics, including age, histopathological tumor grade, and the interval between MRI and surgery.
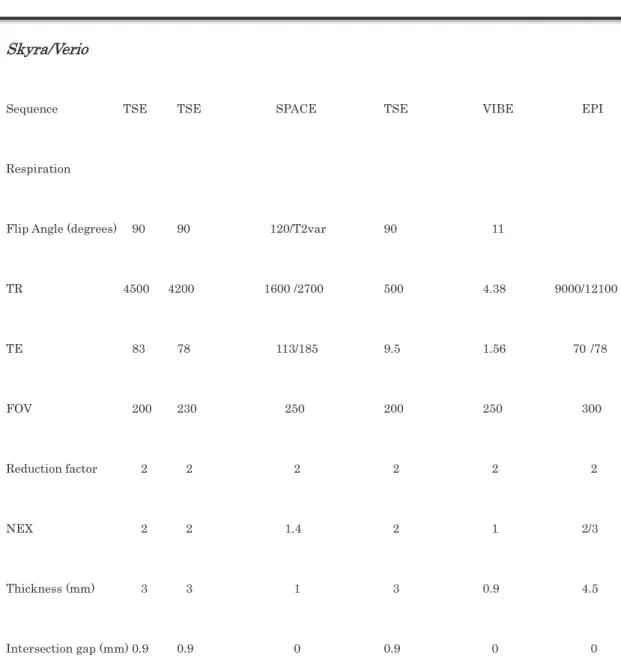
MRI technique
Since this was a retrospective review, MRI was performed using multiple systems. Sixty-one MRI examinations were
performed in our institution using a 1.5-T MRI (MAGNETOM Avanto, Siemens, Forchheim, Germany) and 3-T MRI
(MAGNETOM Verio, MAGNETOM Skyra, Siemens). Overall, 49
of 110 patients underwent MRI in other institutions. T2-weighted
imaging (T2WI) in 2 dimensions (axial and sagittal), fat-saturated T1-weighted imaging (T1WI) with gadolinium contrast-enhanced MRI, diffusion-weighted imaging (DWI), and ADC values were reviewed. The details of the sequences are shown in Table 1.
Gadolinium-based contrast agents (Magnevist
®, Gadvist
®, Bayer Healthcare, Osaka, Japan) were used for dynamic
contrast-enhanced (CE) MRI. Evaluable MRI sequences of this study included T2WI, DWI, ADC values, and dynamic CE MRI.
DWI was performed with b=1000 sec/mm
2. Dynamic CE MRI was obtained with the following parameters: injection speed 2 ml/s;
dose 0.1 mmol/kg; and scan timing (first and second phases) 60 and 120 s.
Imaging analysis
All images were retrospectively reviewed by 2 radiologists.
One was a radiologist with 5 years of experience, and the other
had more than 20 years of experience in genitourinary imaging.
Consensus was reached by discussion.
The radiologists were blinded to clinical information and
pathological/surgical findings of each patient. MRI was evaluated with respect to the following points: size, shape, location
(corpus/isthmus/cervix), and site (upper site/lower site) of the uterine body, as well as intensity compared to normal
endometrium on T2WI. DWI and ADC values (mean) could be evaluated in 90 and 85 patients, respectively. A total of 100 patients underwent dynamic contrast MRI studies so that the type of CE pattern and the presence of subendometrial
enhancement (SEE) and peritumoral enhancement (PTE) were evaluated. SEE is the thin-layered enhancement between the endometrium and myometrium. PTE is recognized as focal strong or irregular enhancement around the tumor due to stromal
reaction associated with myometrial invasion at the tumor front
(11). The SEE was evaluated in whole uterine cavity including the normal endometrial site and PTE was the linear
enhancement located just between tumor and myometrium. The pattern of spread (expansile/infiltrated) and the presence of
coexistent lesions (such as uterine leiomyoma) were also analyzed.
Lesion sites were classified into two types: upper and lower. The upper site of the uterine body was defined as above the middle of the uterine corpus. The lower site of the uterine body was defined as below the middle of the uterine corpus (Fig. 1.). We classified to 3 groups following this definition. We defined upper site as the tumor volume occupied mainly uterine body to fundus, lower site as the tumor volume occupied mainly body to isthmus and cervix, and unknown as difficult to determine the tumor itself. So the four patients were excluded, as it was difficult for us to detect the tumor on MRI.
Pathological analysis
To observe the expressions of MMR proteins, tissue micro arrays (TMAs) were constructed as follows. A small core was punched from each formalin-fixed, paraffin-embedded tissue block, and some cores were re-embedded into a TMA paraffin block. The paraffin block was cut into 3- μ m-thick sections using a microtome, and a TMA slide was prepared. IHC staining for TMA slides was performed using the monoclonal MLH1 antibody (1:50; Clone ES05; Leica, Newcastle Upon Tyne, UK), MSH2 antibody (1:50; Clone 25D12; Leica), MSH6 antibody (1:100;
Clone PU29; Leica), PMS2 antibody (1:100; Clone M0R4G; Leica).
A trained pathologist (T.M.) blinded to the clinical information evaluated the nuclear staining in the tumor cells. The expression of DNA MMR proteins was defined as normal when nuclear
staining was seen in tumor cells. In others, loss of protein
expression was defined as absence of nuclear staining in tumor
cells, with intact nuclear expression in internal non-neoplastic tissues.
Statistical analysis
Statistical significance was determined using the Fisher’s exact test and the Mann-Whitney U -test, as appropriate. The Mann-Whitney U -test was used to compare age, size, and ADC mean values. All statistical tests were conducted with a two-sided significance level of 5% using Prism 5 software (Graphpad Software Inc).
Results
Patients’ clinical background characteristics
EC patients with MMR deficiency were slightly younger
than those with MMR deficiency (median age: 54 vs 56 y [p=0.81]),
though the difference was not significant. The interval between
MRI and surgery was shorter for EC patients with MMR
deficiency than for those without MMR deficiency (mean=41.9±2.8 days vs. 44.1±2.9 days [p=0.7562]), but the difference was not significant.
The histopathological distributions (G1, G2 vs. others p=0.5793, G1 vs. others p=0.3056) also showed no significant differences between EC patients with and without MMR deficiency.
Of 17 EC patients with MMR deficiency, 13 (76.4%) were classified as FIGO I, 3 (17.6%) as FIGO III, and 1 (5.9%) as FIGO IV. On the other hand, of 93 EC patients without MMR deficiency, 75 (80.6%) were classified as FIGO I, 8 (8.6%) as FIGO II, 6 (6.5%) as FIGO III, and 4 (4.3%) as FIGO IV.
The results of IHC staining for MLH1, MSH2, PMS2, and MSH6
were: 9 patients showed loss of MLH1 and PMS2; 5 showed loss of
MSH2 and MSH6; 2 showed loss of MSH6; and 1 showed loss of
PMS2.
Imaging characteristics of EC with MMR deficiency
The MRI findings of EC with MMR deficiency are summarized in Table 2. The mean maximum diameter of the lesions was 42.5 mm (range 5.1-84.6 mm). 5 lesions (29%) were located in the fundus, 4 (23.5%) from the fundus to the corpus, 1 (5.8%) from the fundus to the upper corpus, 1 (5.8%) from the fundus to the cervix, 1 (5.8%) from the upper corpus to the cervix, 1 (5.8%) in the corpus, 1 (5.8%) in the middle corpus, 2 (11.7%) from the inferior corpus to the cervix, and 1 (5.8%) in the isthmus.
Twelve (70.6%) lesions were located in the upper site of the uterus, with 4 (23.5%) in the lower site of the uterus and 1 (5.8%) in the isthmus.
In shape, 14 (82.3%) lesions were elevated-type, and 3 (17.7%)
were flat elevated-type. We defined it as elevated type that tumor
showed protruded mass or polypoid lesion clearly. And we defined
it as flat elevated type that tumor showed slightly elevated flat
apperance to the endometrial cavity with or without myometrial invasion. This feature was reviewed retrospectively by 2 radiologists with consensus.
In the pattern of tumor spread, 12 (70.6%) lesions were expansile, with 4 (23.5%) infiltrated and 1 (5.8%) bulging.
On MRI, 17 lesions showed slightly high intensity on T2WI, and 1 (5.8%) showed heterogeneously high intensity; 16 lesions showed high intensity on DWI, and the mean ADC value was 0.597x10
-3(range 0.46-1.06 × 10
-3). In all 15 lesions, the dynamic CE pattern was the same (slight early enhancement and plateau). SEE was found in 4 (26.6%) lesions, and PTE was found in 8 (53.3%) lesions.
Pathological characteristics of EC with MMR deficiency
Six lesions of 17 patients (35.2%) were endometrioid carcinoma,
grade 1, 5 (29.4%) lesions were grade 2, and 4 (23.5%) lesions
were grade 3; 1 (5.8%) lesion was large cell neuroendocrine cell tumor, and 1 (5.8%) lesion was mucinous differentiation-type.
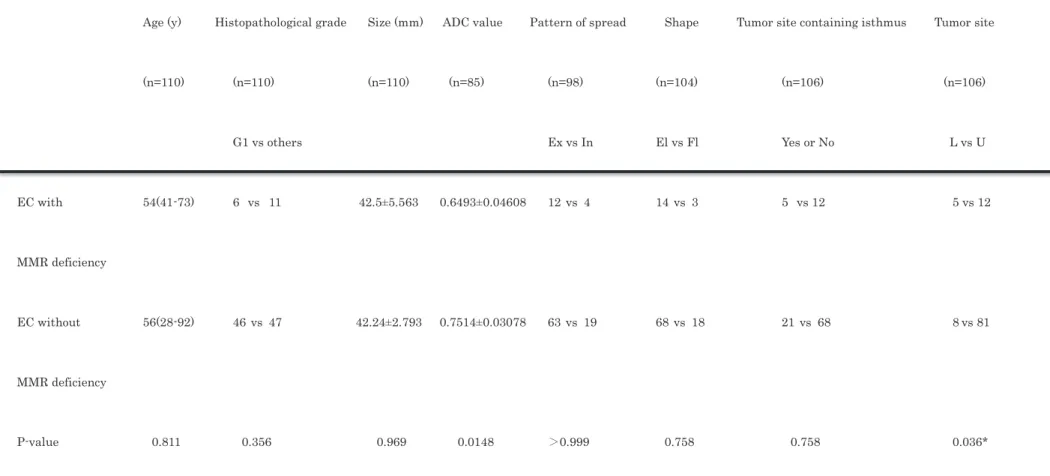
Comparison between EC with and without MMR deficiency
A comparison between EC with MMR deficiency and the control group is summarized in Table 3. The most significant difference was noted in tumor site (upper site or lower site). EC with MMR deficiency was significantly more often located in the lower site [p=0.0366]. There was no significant difference in the tumor occurrence site in the isthmus (p=0.76) (Fig. 2).
EC with MMR deficiency was almost the same size as EC without MMR deficiency (mean 42.5±5.5 vs. 42.3±2.8 mm, p=0.97). The ADC value was slightly lower in EC with MMR deficiency than in EC without MMR deficiency (mean 0.65±0.05×10
-3vs.
0.75±0,031
-3, p=0.15). These parameters were not significantly
different.
For the pattern of spread [>0.99], the shape [p=0.76], and the histopathological grade (G1, G2 vs. others p=0.58, G1 vs. others p=0.31), there were no significant differences between EC with and without MMR deficiency.
Discussion
MMR genes are responsible for the function of the DNA repair system during DNA replication and recombination, repairing mismatch of bases such as insertion, deletion, and misincorporation (12). Loss of the DNA MMR gene results in a strong mutator phenotype known as microsatellite instability (MSI), which is a hallmark of Lynch syndrome-associated cancer (13).
Lynch syndrome, an autosomal dominant inherited syndrome,
is characterized by a high lifetime risk of multiple cancers such as
colorectal cancer (CRC), EC, and other organ cancers (2, 4, 14, 15).
Lynch syndrome retains heterozygous germline mutations in MMR genes, encoding proteins such as MLH1, MSH2, MSH6, and PMS2(16,17). Identification of patients with Lynch syndrome has clinical significance because of the higher risk for synchronous or metachronous malignancies in their lifetime(2). Moreover, in patients with Lynch syndrome, the detection of EC is critical for two reasons: one is that EC plays a role as the sentinel cancer, and the other is that the lifetime risk of EC surpasses that of CRC (7-9). Conventional screening for Lynch syndrome, such as the Amsterdam II or revised Bethesda criteria, is predominantly based on patient age (below 50 years old), family history, and/or presence of Lynch-related tumor (2, 8, 18, 19). The efficacy of these screening criteria is limited (1, 14, 20, 21).
IHC screening for MMR has attracted attention as a new
screening clue for Lynch syndrome (16, 19). Using this IHC
screening, staining for MLH1, MSH2, MSH6, and PMS2 could detect which MMR genes are deficient (8). However, some EC patients with MMR deficiency (35-60%) have no germline mutation in genes encoding MMR proteins (8, 22) , and they are called Lynch-like syndrome or sporadic MMR deficiency (9, 14, 15, 23, 24). Recent data showed that first-degree relatives of patients with Lynch-like syndrome have an increased risk of CRC(22, 25).
In the present study, EC with MMR deficiency accounted for 14.4% of all EC cases, lower than in previous reports from the United States (23-35%) (1-3). In Japan, it is still unclear exactly how many patients have EC with MMR deficiency, and racial differences could exist.
MRI features of EC in Lynch syndrome have been described in
some papers (26-28). Though the specific MRI features remain
unknown, some reports described the tumors as tending to locate
in the lower uterine segment (LUS). These findings coincide with
Westin et al., who reported that 29% of carcinomas in LUS were associated with Lynch syndrome (29). They hypothesized that the reason for this tendency is that the microscopic appearance of glands and stroma in the LUS is different from the remainder of the endometrium, and LUS epithelium could be more susceptible to mismatch repair errors than that of the corpus (29, 30). MRI can show the mass of the EC and its location clearly. In the present study, the tumor locations of EC with MMR deficiency were significantly more common in the lower site of the uterine corpus than in EC without MMR deficiency. The high sensitivity of MRI for identifying the tumor location may be the key finding that leads to further screening for Lynch syndrome.
Though the location of EC depicted by MRI showed a significant
difference, the other MRI findings, such as the size, the pattern of
spread, the shape, and the enhancement pattern, were not
significantly different between EC with and without MMR
deficiency.
Bhosale et al. reported that the ADC value on the reduced Field of View Diffusion Sequence could be a biomarker to identify EC with MSI caused by MMR deficiency that predisposed to mutation (10).
MSI had been considered as having equivalent efficacy to IHC in
predicting germline mutation (1,31). Thus, we also expected that
the ADC value would be an effective radiologic parameter in
differentiating EC with MMR deficiency. However, the ADC value
also did not show a significant difference in the present study. We
consider that the present result was reasonable because the
histopathological grade of EC was not significantly different
between EC with and without MMR deficiency. The
histomorphologic differences between EC with and without MMR
deficiency are still controversial (8, 32, 33). Further, the present
results could be inconsistent with their result because both
studies had small sample sizes, and their study enrolled patients
only with clinical FIGO stage 1 (10).
There were some limitations in the present study. The number of
patients was small. In addition, cases of Lynch syndrome in
patients having EC with MMR deficiency could not be confirmed
by genetic screening. The additional genetic test was not agreed
with the patients in this study. Two of 17 patients with MMR
deficiency actually had other malignancy; one had the colorectal
cancer, and the other the ovarian cancer, so that they are highly
suspected as Lynch syndrome. The IHC staining was used to
screen ECs with MMR deficiency that mainly consisted of Lynch
syndrome with gene mutation. However, Lynch-like syndrome,
which has a different germline gene mutation or somatic MMR
mutation, and sporadic MMR deficiency could be intermingled. In
fact, in the present study, 2 of 17 patients having EC with MMR
deficiency also had colorectal cancer. Finally, the MRI images
were retrospectively reviewed, so that the imaging technique
varied.
Conclusion
In this study, the MRI features of EC with and without MMR
deficiency were compared. Though the MRI features of EC with
MMR deficiency are nonspecific, the mass of EC with MMR gene
deficiency tends to be located at a lower site of the uterine corpus,
and this may be the key to stepping-up screening for Lynch
syndrome.
References
1. Hampel H, Frankel W, Panescu J, Lockman J, Sotamaa K, Fix D, et al.
Screening for Lynch syndrome (hereditary nonpolyposis colorectal cancer) among endometrial cancer patients. Cancer Research. 2006;66:7810-7
2. Mills AM, Liou S, Ford JM, Berek JS, Pai RK, Longacre TA. Lynch syndrome screening should be considered for all patients with newly diagnosed endometrial cancer. Am J Surg Pathol. 2014;38:1501-9
3. Moline J, Mahdi H, Yang B, Biscotti C, Roma AA, Heald B, et al.
Implementation of tumor testing for lynch syndrome in endometrial cancers at a large academic medical center. Gynecologic Oncol. 2013;130:121-6
4.Lynch HT, de la Chapelle A, Hampel H, Wagner A, Fodde R, Lynch JF, et al.
American founder mutation for Lynch syndrome. Prevalence estimates and implications. Cancer. 2006;106:448-52
5. Lynch HT, Snyder CL, Shaw TG, Heinen CD, Hitchins MP. Milestones of Lynch syndrome: 1895-2015. Nature Reviews Cancer. 2015;15:181-94
6. Bonadona V, Bonaiti B, Olschwang S, Grandjouan S, Huiart L, Longy M,
et al. Cancer risks associated with germline mutations in MLH1, MSH2, and MSH6 genes in Lynch syndrome. JAMA. 2011;305:2304-10
7. Stoffel E, Mukherjee B, Raymond VM, Tayob N, Kastrinos F, Sparr J, et al.
Calculation of risk of colorectal and endometrial cancer among patients with Lynch syndrome. Gastroenterology. 2009;137:1621-7
8. Watkins JC, Yang EJ, Muto MG, Feltmate CM, Berkowitz RS, Horowitz NS, et al. Universal screening for mismatch-repair deficiency in endometrial cancers to identify patients with Lynch syndrome and Lynch-like syndrome.
Int J Gynecological Pathol. 2017;36:115-27
9. Lu KH, Dinh M, Kohlmann W, Watson P, Green J, Syngal S, et al.
Gynecologic cancer as a "sentinel cancer" for women with hereditary nonpolyposis colorectal cancer syndrome. Obstetrics Gynecol.
2005;105:569-74
10. Bhosale P, Ramalingam P, Ma J, Iyer R, Soliman P, Frumovitz M, et al.
Can reduced field-of-view diffusion sequence help assess microsatellite
instability in FIGO stage 1 endometrial cancer?: Reduced FOV Diffusion Sequence. J Magnetic Resonance Imaging. 2017;45:1216–24
11.Fujii S, Kido A, Baba T, Fujimoto K, Daido S, Matsumura N, et al.
Subendometrial enhancement and peritumoral enhancement for assessing endometrial cancer on dynamic contrast enhanced MR imaging. Eur J Radiol.
2015;84:581–9.
12. Moreira L, Balaguer F, Lindor N, de la Chapelle A, Hampel H, Aaltonen LA, et al. Identification of Lynch syndrome among patients with colorectal cancer. JAMA. 2012;308:1555-65
13. Ollikainen M, Abdel-Rahman WM, Moisio AL, Lindroos A, Kariola R, Jarvela I, et al. Molecular analysis of familial endometrial carcinoma: a manifestation of hereditary nonpolyposis colorectal cancer or a separate syndrome? J Clin Oncol. 2005;23:4609-16
14. Ferguson SE, Aronson M, Pollett A, Eiriksson LR, Oza AM, Gallinger S,
et al. Performance characteristics of screening strategies for Lynch syndrome
in unselected women with newly diagnosed endometrial cancer who have
undergone universal germline mutation testing. Cancer. 2014; 120:3932-9 15.Mills AM, Sloan EA, Thomas M, Modesitt SC, Stoler MH, Atkins KA, et al.
Clinicopathologic comparison of Lynch syndrome-associated and "Lynch-like"
endometrial carcinomas identified on universal screening using mismatch repair protein immunohistochemistry. Am J Surg Pathol. 2016; 40:155-65 16. Haraldsdottir S, Hampel H, Tomsic J, Frankel WL, Pearlman R, de la Chapelle A, et al. Colon and endometrial cancers with mismatch repair deficiency can arise from somatic, rather than germline, mutations.
Gastroenterology. 2014;147:1308-16
17. Wong A, Ngeow J. Hereditary syndromes manifesting as endometrial carcinoma: How can pathological features aid risk assessment? BioMed Res Int. 2015;2015:1-17
18. Umar A, Boland CR, Terdiman JP, Syngal S, de la Chapelle A, Ruschoff J,
et al. Revised Bethesda Guidelines for hereditary nonpolyposis colorectal
cancer (Lynch syndrome) and microsatellite instability. J National Cancer
Institute. 2004;96:261-8
19. Vasen HF, Watson P, Mecklin JP, Lynch HT. New clinical criteria for hereditary nonpolyposis colorectal cancer (HNPCC, Lynch syndrome) proposed by the International Collaborative group on HNPCC.
Gastroenterology. 1999;116:1453-6
20. Sjursen W, Haukanes BI, Grindedal EM, Aarset H, Stormorken A, Engebretsen LF, et al. Current clinical criteria for Lynch syndrome are not sensitive enough to identify MSH6 mutation carriers. J Medical Genetics.
2010;47:579-85
21. Terdiman JP. It is time to get serious about diagnosing Lynch syndrome (hereditary nonpolyposis colorectal cancer with defective DNA mismatch repair) in the general population. Gastroenterology. 2005;129:741-4
22. Mas-Moya J, Dudley B, Brand RE, Thull D, Bahary N, Nikiforova MN, et al. Clinicopathological comparison of colorectal and endometrial carcinomas in patients with Lynch-like syndrome versus patients with Lynch syndrome.
Hum Pathol. 2015;46:1616-25
23. Carethers JM. Differentiating Lynch-like from Lynch syndrome.
Gastroenterology. 2014;146:602-4
24. Rodriguez-Soler M, Perez-Carbonell L, Guarinos C, Zapater P, Castillejo A, Barbera VM, et al. Risk of cancer in cases of suspected Lynch syndrome without germline mutation. Gastroenterology. 2013;144:926-32 e1; quiz e13-4
25. Win AK, Buchanan DD, Rosty C, MacInnis RJ, Dowty JG, Dite GS, et al.
Role of tumour molecular and pathology features to estimate colorectal cancer risk for first-degree relatives. Gut. 2015;64:101-10
26. Rothan SM, Menias CO, ElGuindy YM, Jensen CT, Shaaban AM, Bhosale P, et al. Imaging of hereditary tumors of the female genital system. J Computer Assisted Tomography. 2017;41:364-75
27. Minamiguchi K, Takahama J, Marugami N, Marugami A, Haga M, Takewa M, et al. MR findings of Lynch syndrome-related uterine endometrial carcinoma: a case report. Abdominal Radiol. 2016;41:1703-6 28. Matoba Y, Kisu I, Saotome K, Katayama M, Taniguchi M, Miura Y, et al.
Clear cell carcinoma of the lower uterine segment: A case report. Molecular
Clin Oncol. 2016;5:701-4
29.Westin SN, Lacour RA, Urbauer DL, Luthra R, Bodurka DC, Lu KH, et al.
Carcinoma of the lower uterine segment: a newly described association with Lynch syndrome. J Clin Oncol. 2008;26:5965-71
30. Sorvari TE, Laakso L. Histochemical investigation of epithelial mucosubstances in the uterine isthmus. Obstetrics Gynecol. 1970;36:76-81 31.Shia J. Immunohistochemistry versus microsatellite instability testing for screening colorectal cancer patients at risk for hereditary nonpolyposis colorectal cancer syndrome. J Molecular Diagnostics. 2008;10:293–300
32. Ryan P, Mulligan AM, Aronson M, Ferguson SE, Bapat B, Semotiuk K, et al. Comparison of clinical schemas and morphologic features in predicting Lynch syndrome in mutation-positive patients with endometrial cancer encountered in the context of familial gastrointestinal cancer registries.
Cancer. 2012;118:681-8
33. Walsh MD, Cummings MC, Buchanan DD, Dambacher WM, Arnold S,
McKeone D, et al. Molecular, pathologic, and clinical features of early-onset
endometrial cancer: identifying presumptive Lynch syndrome patients.
Clinical Cancer Research. 2008;14:1692-700
Figure legends
The uterine corpus is divided into two equal sites: the upper site, being the upper half (a), and the lower site, being the lower half (b).
The endometrial carcinomas of the enrolled patients were
assigned to the two groups depending on the main location of the
tumor.
Fig. 2. A 53-year-old woman with EC with MMR deficiency
(a) T2WI (sagittal) shows circumferential endometrial thickening of the lower site of the uterine body spread to the uterine cervix.
Hematometra is also seen (arrow).
(b,c) On contrast-enhanced T1-weighted imaging (axial), the mass shows slightly high intensity. Peritumoral enhancement is seen (arrow).
(d) MLH1, (e) MSH2, (f) MSH6, (g) PMS2 : IHC results are shown.
Endometrial carcinoma shows loss of immunohistochemical expressions of both MSH2 and MSH6. Both MLH1 and PMS2 show normal expressions on IHC.
(h) HE stains show high-grade endometrial cancer (G3).
Table 1. Magnetic resonance imaging protocol
MR imaging T2-weighted T2-weighted T1-weighted T1-weighted DWI
parameter TRA SAG imaging (3D) imaging (2D) imaging (3D)
Skyra/Verio
Sequence TSE TSE SPACE TSE VIBE EPI
Respiration
Flip Angle (degrees) 90 90 120/T2var 90 11
TR 4500 4200 1600 /2700 500 4.38 9000/12100
TE 83 78 113/185 9.5 1.56 70 /78
FOV 200 230 250 200 250 300
Reduction factor 2 2 2 2 2 2
NEX 2 2 1.4 2 1 2/3
Thickness (mm) 3 3 1 3 0.9 4.5
Intersection gap (mm) 0.9 0.9 0 0.9 0 0
Avanto
Sequence TSE TSE TSE VIBE EPI
Respiration
Flip Angle (degrees) 90 90 90 12
TR 3500 4000 519 6 4000
TE 83 76 8.7 2.19 70
FOV 200 250 200 250 320
Reduction factor 2 2 2 0 2
NEX 1 1 1 1 6
Thickness (mm) 3 3 3 1 7
Intersection gap (mm) 0.3 0.45 0.3 0 1.75
2D: two-dimensional, 3D: three-dimensional, TR: repetition time, TE: echo time, FOV: field of view
NEX: number of excitations, TSE: turbo spin echo, EPI: echo planar imaging, VIBE: volume interpolated
breath-hold examination, SPACE: Sampling Perfection with Application optimized Contrast sing different flip
angle Evolutions
Table 2. Magnetic resonance imaging findings of EC with MMR deficiency
Case Size (mm) Shape Location Site Pattern of spread T2WI DWI ADC value Early enhancement DCE PTE SEE
Case 1 47 El m.c Lower Ex high high 0.74 + plateau − −
Case 2 30 El c Upper Ex high high 0.70 + plateau + −
Case 3 51 El f-c Upper In high high 0.67 + plateau + −
Case 4 45 El f Upper In high high 0.61 + plateau + +
Case 5 35 El I isthmus Ex high high 0.62 + plateau + −
Case 6 27 El f-u.c Upper Ex high high 0.58 + plateau − +
Case 7 85 Fl f Upper In high high 0.53 + plateau − −
Case 8 65 Fl f Upper In high high 0.83 + plateau + −
Case 10 17 El f Upper Ex high high + plateau + −
Case 11 59 El f-c Upper Ex high plateau
Case 12 61 Fl i.c-ce Lower Ex high high 0.53 + plateau − +
Case 13 15 El f Upper Ex high high 1.06 + plateau − −
Case 14 20 El f Upper Ex high high 0.53 + plateau + +
Case 15 5 El f Upper E x high high 0.46 + plateau − −
Case 16 58 El u.c-ce Upper Ex high high 0.73 + plateau + −
Case 17 25 El i.c-ce Lower Ex high high 0.47 + plateau − −
El: elevated type, Fl: flat elevated type, u.c: upper corpus m.c: middle corpus, i.c: inferior corpus, f: fundus, I: isthmus, ce: cervix
Ex: expansile pattern, I: infiltrative pattern, Bul: bulging pattern
Table 3. Comparison between EC with and without MMR deficiency
Clinical background MRI analysis
Age (y) Histopathological grade Size (mm) ADC value Pattern of spread Shape Tumor site containing isthmus Tumor site
(n=110) (n=110) (n=110) (n=85) (n=98) (n=104) (n=106) (n=106)
G1 vs others Ex vs In El vs Fl Yes or No L vs U
EC with 54(41-73) 6 vs 11 42.5±5.563 0.6493±0.04608 12 vs 4 14 vs 3 5 vs 12 5 vs 12
MMR deficiency
EC without 56(28-92) 46 vs 47 42.24±2.793 0.7514±0.03078 63 vs 19 68 vs 18 21 vs 68 8 vs 81
MMR deficiency
P-value 0.811 0.356 0.969 0.0148 㸼0.999 0.758 0.758 0.036*