1210
IEICE TRANS. ELECTRON., VOL.E96–C, NO.10 OCTOBER 2013
INVITED PAPER
Special Section on Emerging Technologies and Applications for Microwave and Millimeter-Wave SystemsThree Dimensional Millimeter- and Terahertz-Wave Imaging Based on Optical Coherence Tomography
Toshiyuki IKEO†a), Takayuki ISOGAWA†,Student Members,andTadao NAGATSUMA†,Fellow
SUMMARY Three dimensional (3D) terahertz (THz) imaging or THz tomography has recently proven to be useful for non-destructive testing of industrial materials and structures. In place of previous imaging techniques such as THz pulse or continuous wave (CW) radar, we propose a THz opti- cal coherence tomography (OCT) using frequency-swept THz sources, and demonstrate 3D imaging. In addition, we further apply this technique to the millimeter-wave region in order to extend applicable targets.
key words: imaging, tomography, optical coherence tomography, tera- hertz, millimeter wave
1. Introduction
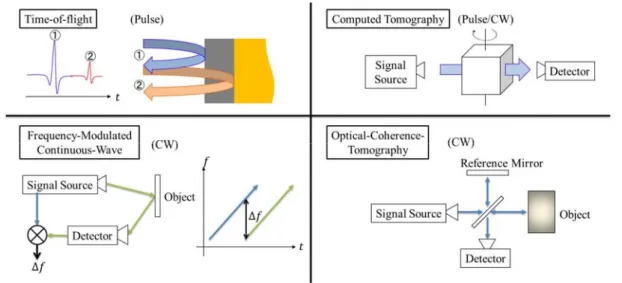
Recently, there exist various techniques for non-destructive and non-contact imaging using electro-magnetic waves such as microwaves, infrared light, X-rays, etc. Terahertz (THz) waves, ranging from 100 GHz to 10 THz, have been em- ployed extensively in imaging applications, where conven- tional electro-magnetic waves are not effective. In particu- lar, the three-dimensional (3D) THz imaging or THz tomog- raphy has attracted a great deal of interest in various fields, such as medicine, pharmacy, security and industrial applica- tions [1]–[3], and several concepts of tomographic imaging techniques are summarized in Fig. 1.
THz-signal sources used for tomographic imaging are categorized into pulse wave and continuous wave (CW) sig- nals. Among the types of THz tomographic imaging devel- oped, most are based on THz pulse waves, and sometimes referred to as THz time-of-flight [2]–[5]. The THz pulse is incident to the object under test, and 3D images are ob- tained by observing the amplitude and timing of THz pulses reflected from the object. Although the THz time-of-flight has proven to be a powerful inspection technique, particu- larly for a depth resolution of less than 0.1 mm, their draw- backs are the system size, cost and complexity, stemming from the use of femtosecond pulse lasers and other compo- nents needed for data acquisition.
The second technique for tomographic imaging is based on computed tomography (CT) which uses pulse or CW [6], [7]. The object is mounted on a rotation stage, and 3D images can be obtained by rotating the object and apply- ing signal processing to the angle-dependent signals trans- mitted through the object. Not only the internal structure,
Manuscript received May 7, 2013.
Manuscript revised June 27, 2013.
†The authors are with Osaka University, Toyonaka-shi, 560- 8531 Japan.
a) E-mail: [email protected] DOI: 10.1587/transele.E96.C.1210
but also the spectroscopic information of the object has been obtained with the THz pulse-based CT systems [8]. How- ever, the rotation of projection angles requires a long mea- surement time, in particular for complicated and/or large ob- jects.
The third technique is the CW THz radar, using frequency-modulated continuous-wave (FMCW) [9]–[11].
The THz FMCW radar has been studied for use in standoff- imaging of concealed weapons under clothes at distances from 4 to 25 m. The depth resolution is determined by the swept frequency range and it is typically from 5 mm to 1 cm.
In order to solve the problems of the above mentioned techniques, we have previously proposed the use of opti- cal coherence tomography (OCT), which has been estab- lished for infrared imaging, in the THz region [12], and have developed a THz tomography system based on a time- domain (TD) OCT technique using a low-coherence THz- CW source and a Mickelson interferometer [13]. Here, low- coherence THz signals are generated by injecting the am- plified spontaneous emission (ASE) noise from the optical amplifier into the photodiode [14]–[16]. THz-TD-OCT of- fers several advantages in that it is cost-effective, eliminates the need for complicated signal processing, is applicable to any object, and does not suffer from the interference pattern effect [16]. While we have succeeded in the tomographic imaging of objects, the mechanical movement of the refer- ence mirror in the interferometer for obtaining depth infor- mation caused an increase in the measurement time.
In this paper, in order to shorten the measurement time, we further extend the idea of THz-TD-OCT, and propose THz tomographic imaging based on “frequency-domain”
or swept source (SS) OCT techniques. SS-OCT in the in- frared region acquires depth information by sweeping the frequency of infrared light sources. This eliminates the need for a translation stage for the movable mirror, con- tributing to a reduction not only in the system size but also in the acquisition time. In our THz-SS-OCT system, we generate frequency-swept THz signals by using a high- power uni-travelling-carrier photodiode (UTC-PD) excited by frequency-swept light sources.
We also apply the THz-SS-OCT technique to the millimeter-wave region, because millimeter-wave can pen- etrate more deeply into thick materials and structures [17]–
[19].
In Sect. 2, we briefly describe the configuration of THz- OCT. Next, we discuss the characteristics of THz-SS-OCT in Sect. 3. Section 4 shows the experimental results of tomo- Copyright c2013 The Institute of Electronics, Information and Communication Engineers
Fig. 1 Concepts of tomographic imaging techniques.
graphic imaging with the THz-SS-OCT. Finally, in Sect. 5, we extend the idea of SS-OCT into the millimeter-wave regime and demonstrate tomographic imaging of concrete structures.
2. System Configuration of THz-OCT
2.1 THz-Signal Sources
To generate frequency-swept coherent THz waves, we em- ployed a photo-mixing technique using two laser sources:
one is a fixed wavelength source and the other is a frequency-swept source. These two optical signals are in- jected into a uni-travelling-carrier photodiode (UTC-PD) module [20]. The frequency of monochromatic THz waves generated by the photodiode is determined by the wave- length/frequency difference of the two laser sources. There- fore, we can generate frequency-swept THz waves by changing the frequency difference of the two lasers. Fig- ure 3 shows the frequency dependence of the output power of the UTC-PD module, when the frequency of the tun- able laser is changed from 194.000 THz to 193.700 THz and the frequency of the fixed wavelength laser is fixed at 194.200 THz. Under this condition, the frequency of THz waves generated from the UTC-PD is swept from 200 GHz to 500 GHz.
On the contrary, for the generation of low-coherence THz signals, a broadband amplified spontaneous emission (ASE) noise generated by an optical fiber amplifier is used as the optical signal source just by eliminating wavelength- tunable lasers. The UTC-PD module converts every two optical wavelength of lights in the ASE noise spectra into THz waves, which have frequency characteristics as shown in Fig. 3.
2.2 Setup for THz-OCT
Figure 4 shows a block diagram of the THz OCT, which
Fig. 2 Block diagrams for generating frequency swept coherent THz signals (a), and low-coherence THz signals (b).
Fig. 3 Frequency dependence of output power of UTC-PD module.
consists of a THz-signal source and a Mickelson interfer- ometer. In this setup, THz waves are emitted from the horn antenna of the UTC-PD and travel to a beam splitter (BS), where they are divided into two directions with a power ra- tio of 50/50. One wave goes to the reference mirror and the other goes to the test object after being focused through an objective lens. Reflected waves from the reference mirror and backscattered wave from the test object travel back to the beam splitter and go to a Schottky barrier diode (SBD), which is used as a power detector. Finally, the detected sig- nals are amplified with a preamplifier and a lock-in ampli-
1212
IEICE TRANS. ELECTRON., VOL.E96–C, NO.10 OCTOBER 2013
Fig. 4 Block diagram of THz-OCT. UTC-PD: uni-travelling-carrier photodiode, SBD: Schottky barrier diode, BS: beam splitter.
fier. An optical modulator operated at 10 kHz is inserted in front of the photodiode to allow for lock-in detection. A personal computer (PC) is used for collecting the transferred data from the lock-in amplifier, and for controlling the com- ponents of the system. 3D imaging is operated by fixing the object on the x-y motor stage and moving it in steps to the x- and y- directions, performing the so-called raster scan.
2.3 THz Time-Domain OCT
The THz time-domain OCT (THz-TD-OCT) uses a low- coherence THz signal source. In TD-OCT, the depth in- formation of the object is obtained by changing the opti- cal path length difference between reference side and object side, and the detected signals show the interference pattern when the optical path length difference becomes zero. The reference mirror is mechanically moved in order to change the optical path length difference. The key point of our THz- TD-OCT system is that the movement of the reference mir- ror and object lens are synchronized in order to equalize the optical path length from the beam splitter to the refer- ence mirror and the focal point of the object [15]. In this case, the interference signal is maximized, and the waves reflected from the focal point of the object can be discrim- inated according to the depth resolution determined by the low-coherence THz signal source.
2.4 THz Swept-Source OCT
The THz swept-source OCT (THz-SS-OCT) uses a frequency-swept THz signal source. The interference sig- nal after the frequency sweep consists of the sum of cosine functions, and the frequency of these cosine functions is de- pendent on the optical path length differences between the reference mirror and the reflection points of the object. Af- ter Fourier-transforming the interference signals, the depth information of the object can be obtained as a point spread function, where the position of the peak signal corresponds to the optical path length difference.
Fig. 5 (a) Solid line: frequency spectrum of THz-SS-OCT, dotted line:
reflection characteristic of beam splitter. (b) Interference signal with plane mirror as an object.
3. Characteristics of THz-SS-OCT
3.1 Frequency Spectra
The solid line in Fig. 5(a) shows the frequency spectrum of swept THz signals, which get through the Mickelson inter- ferometer without an object. Note that there is a slight differ- ence in the frequency characteristics of the signals measured directly from the UTC-PD (Fig. 3) and from the reference mirror (Fig. 5(a)), especially in the frequency range of 200–
240 GHz. This is probably caused by the Fabry-Perot inter- ference effect in the beam splitter. In our system, we employ 190μm thick high resistivity float zone silicon (HRFZ-Si).
The reflection characteristic of this beam splitter is shown as a dotted line in Fig. 5(a). The reflectivity drops to zero at about 238 and 476 GHz, a result which is in good agreement with the obtained frequency spectrum.
Figure 5(b) is a spectrum of the interference signal with a plane mirror as the object, when the optical path length difference is set to 10 mm. The main difference between the two signals is that the oscillatory behavior in the signal can be observed when there is an object under test as shown in Fig. 5(b). Since a plane mirror used for the object has a single reflection point, the interference signal shows a single frequency cosine function.
3.2 Calibration of Depth Information
After Fourier-transforming Fig. 5(b), the point spread func- tion, which corresponds to the position of the object, can be calculated as shown in Fig. 6. The pulse-like signal has
Fig. 6 Point spread function of Fig. 4(b).
Fig. 7 Relationship between the optical path length difference and the peak position of pulse-like signal.
a peak at 10.24 mm, which is in good agreement with the optical path length difference, 10 mm.
In the process of calculating the point spread function (PSF), we performed the calibration of the horizontal axis from the calculated data point to the true optical path length difference as follows: The relationship between the peak of a pulse-like signal and the optical path length difference is shown in Fig. 7. After calibrating the horizontal axis, the optical path length difference per data point interval was de- termined as 0.08 mm.
3.3 Measurable Range of Depth
The depth to which we measure reflected signals is one of the important parameters for non-destructive inspection. We determine the measurable range of depth by measuring the signals for the plane mirror as an object at each depth po- sition. Figure 8 shows the dependence of the signal power on the optical path length difference for main and side lobes indicated in Fig. 6. As can be seen, the signal power of the side lobe becomes higher than that of the main lobe when the optical path length difference becomes 50 mm. In such a situation, correct depth information cannot be obtained.
Therefore, in this case, the practical measurable range is de- termined as 50 mm.
3.4 Depth Resolution
The theoretical depth resolution,δz, of the SS-OCT is given as [21]
δz= 2 ln 2 π
λ20
nΔλ, (1)
Fig. 8 Signal power of main lobe and side lobe.
whereλ0 is the center wavelength andΔλis the full width half maximum (FWHM) of the signal, and n is the re- fractive index of the object. In our system, the gener- ated THz waves have a 325 GHz center frequency and a FWHM of 87.4 GHz, corresponding toλ0 =0.923 mm and Δλ=0.253 mm. From Eq. (1), the theoretical depth resolu- tion,δz, is 1.49 mm in air (n=1.0).
To evaluate the depth resolution of our system in a more practical situation, we prepared plastic plates with dif- ferent thicknesses. Assuming that the reflected signals of THz waves are detected only when the refractive index of the object changes, two peaks of point spread function (cor- responding to the front and back sides of the plastic plate, respectively), should be observed. Figure 9 shows the point spread function of each plastic plate: 0.9, 1.0, 3.0, and 5.0 mm. Two peaks are observed for 1.0, 3.0 and 5.0 mm, but not for 0.9 mm thickness. Thus, the recognizable thick- ness of the plastic plate is 1.0 mm.
The distances between the two peaks in the 1.0, 3.0 and 5.0 plates are measured as 2.08, 3.2 and 8.16 mm, re- spectively. These values are slightly larger than the actual thicknesses of the plastic plates. This is because the optical path length, L, is the product of the thickness, d, and the refractive index,n; that is,L=d×n. Figure 10 shows the relationship between the actual thickness and the measured distance between the two peaks. The dotted line is the line of the best fit, and its slope gives the refractive index of the plastic plate we used. As a result, the refractive index of the plastic plate in the THz region can be estimated as 1.55. In addition, from Eq. (1), the experimental depth resolution in the air is determined asδz=1.55 mm, which is close to the calculated theoretical depth resolution i.e., 1.49 mm.
3.5 Lateral Resolution
Next, let us discuss lateral resolution. After observing the change in signal power using the knife edge method, we measured the lateral resolution of the system as follows. By moving a metallic plate, the signal power changes from 0%
to 100% as shown in Fig. 11. The beam waist of the focused THz wave can be defined as the distance from 0% to 100%
transmission. The experimental lateral resolution is given as a FWHM of the beam waist, 2δx. Since the experimentally obtained beam waist is 3.4 mm, the lateral resolution,δx, is 1.7 mm.
1214
IEICE TRANS. ELECTRON., VOL.E96–C, NO.10 OCTOBER 2013
Fig. 9 Point spread function for the plastic plates. Thicknesses of plastic plates are 5.0 mm, 3.0 mm, 1.0 mm and 0.9 mm.
Fig. 10 Relationship between the actual thickness and the measured dis- tance between the two peaks.
Fig. 11 Relationship between the signal power and the moved distance of metallic plate.
Table 1 Summary of THz-SS-OCT system performance.
Fig. 12 (a) Schematic of object for imaging. (b) Tomographic image of the object. (c) Cross-sectional images at each depth position.
Here, the theoretical lateral resolution with the objec- tive lens,δx, is given as [22]
δx=1.22λ0f
D , (2)
whereλ0is the center wavelength of the THz wave source, f is the focal length, andDis the diameter of the objective lens. By substitutingλ0 =0.923 mm, f =75 mm, andD= 50 mm, the theoreticalδxbecomes 1.69 mm. This value is in good agreement with the experimental result mentioned above.
To sum up this section, basic system performance pa- rameters are listed in Table 1.
4. Experimental Results of Tomographic Imaging In this section, we demonstrate the 3D-imaging with our THz SS-OCT system. Figure 12(a) shows the test object.
The object consists of three plastic plates which have hol- low holes in the shape of the capital letters T, H, and Z.
Each plastic plate is 50 mm2, 1 mm thick, and the distance
Fig. 13 Block diagram of the millimeter-wave SS-OCT. SBD: Schottky barrier diode, BS: beam splitter.
between the plates is about 3 mm between the first and sec- ond and 10 mm between the second and third. Figure 12(b) shows tomographic images of the object. As can be seen, each plate consists of two lines corresponding to the front and back sides, respectively, and as a result the position of each plate can be determined. Figure 12(c) shows cross- sectional images at the front side of each plate. The capital letters T, H and Z are clearly observed.
The number of voxels of this tomography is 30×30× 500 and the resolution is 1.7 mm in the x- and y- directions, respectively, and 0.08 mm in the z-direction. The total mea- surement time of this object is 90 minutes for a full scan.
On the other hand, the measurement time of the same object when using THz-TD-OCT is about 3 hours. From these re- sults, we can say that introducing a frequency-swept source instead of the mechanical movement of the reference mirror can decrease the measurement time for tomographic imag- ing.
5. Application of Millimeter-Wave Tomography Figure 13 shows a block diagram of the millimeter-wave SS-OCT. The frequency range of the millimeter-wave is from 22 GHz to 43 GHz. The lower frequency is limited by the cutoff frequency of the waveguide WR-28, while the higher one is limited by the synthesized signal gener- ator. Millimeter-waves are radiated from the horn antenna and incident to the Mickelson interferometer. A hyperbolic lens was used in order to perfectly collimate the millimeter- waves. The basic properties of the millimeter wave SS-OCT are summarized in Table 2.
In order to make the system compact, we integrated the components in the dotted area of Fig. 13 on the plastic-plate platform. Figure 14 shows a photo of the integrated system.
The size of the system is 30 cm×30 cm×30 cm. Other components, such as a signal generator, a TTL modulator, a lock-in amplifier, etc., are placed in a movable cabinet.
Table 2 Summary of the system performance of the millimeter wave SS-OCT.
Fig. 14 Picture of integrated millimeter wave SS-OCT.
Fig. 15 (a) Schematic of object for imaging. (b) Picture of the object.
To confirm that the system is applicable to the struc- tural inspection of buildings, we conducted an experiment aimed at imaging the hidden cracks in a concrete struc- ture. The size of the object is 100 mm2, and the positions of the cracks are 3 mm deep under the concrete surface. Fig- ures 16(a), (b) show cross-sectional images at the surface and the 3 mm depth point, and the few millimeter-width hid- den cracks are clearly observed in Fig. 16(b). Thus, we have been able to prove that the millimeter-wave SS-OCT enables
1216
IEICE TRANS. ELECTRON., VOL.E96–C, NO.10 OCTOBER 2013
Fig. 16 Cross-sectional images of (a) surface and (b) 3 mm depth.
us to inspect hidden cracks in concrete structures.
6. Conclusion
Tomographic imaging with terahertz waves is expected to be utilized for various industrial applications as a new non- destructive and non-contact inspection system. In this paper, we have proposed and demonstrated SS-OCT- based THz tomography as a novel technique apt to replace other tomo- graphic imaging techniques.
Using a frequency-swept THz source centered at 325 GHz, we have experimentally demonstrated tomo- graphic imaging with a depth resolution of 1.55 mm and a lateral resolution of 1.7 mm. In addition, we developed millimeter-wave tomography using SS-OCT techniques, and succeeded in the tomographic imaging of hidden cracks in a concrete structure.
In our future work, we shall focus on improving the measurement time. The raster scan requires a long time to image the object. Therefore, we will introduce the Galvano scanner with a Galvano mirror and an f-theta lens. Further- more, we will try to establish a tomographic imaging sys- tem applicable to the diagnosis of sub-millimeter thin-layer structures, such as multi-layer films of painting or coating, while improving the depth resolution of the system by us- ing a higher center frequency and a wide frequency band of about 600 to 900 GHz.
Acknowledgments
Part of this work is supported by the Ministry of Education, Science, Sports and Culture, through the Grant-in-Aid for Scientific Research program (A), 23246067, 2011.
References
[1] B.B. Hu and M.C. Nuss, “Imaging with terahertz waves,” Opt. Lett., vol.20, pp.1716–1718, 1995.
[2] W.L. Chan, J. Deibel, and D.M. Mittleman, “Imaging with terahertz radiation,” Rep. Progr. Physics, vol.70, pp.1325–1379, Aug. 2007.
[3] K. Ajito and Y, Ueno, “THz chemical imaging for biological appli- cations,” IEEE Trans. Tera. Sci. Tech., vol.1, pp.293–300, 2011.
[4] A.J. Fitzgerald, B.E. Cole, and P.F. Taday, “Nondestructive analy- sis of tablet coating thickness using terahertz pulsed imaging,” J.
Pharm. Sci., vol.94, pp.177–183, 2005.
[5] J. Takayanagi, H. Jinno, S. Ichino, K. Suizu, M. Yamashita, T.
Ouchi, S. Kasai, H. Ohtake, H. Uchida, N. Nishizawa, and K.
Kawase, “High-resolution time-of-flight terahertz tomography us- ing a femtosecond fiber laser,” Opt. Express, vol.17, pp.7549–7555, 2009.
[6] X.-X. Yin, B.W.-H. Ng, B. Ferguson, S.P. Mickan, and D. Abbott,
“2-D wavelet segmentation in 3-D T-ray tomography,” IEEE Sensors J., vol.7, pp.342–343, 2007.
[7] B. Recur, A. Younus, S. Salort, P. Mounaix, B. Chassagne, P.
Desbarats, J.-P. Caumes, and E. Abraham, “Investigation on recon- struction methods applied to 3D terahertz computed tomography,”
Opt. Express, vol.19, pp.5106–5117, 2011.
[8] M. Imamura, S. Nishina, A. Irisawa, T. Yamashita, and E. Kato, “3D imaging and analysis system using terahertz waves,” Proc. IEEE Int.
Conf. on IR. MMW. THz. waves., Rome, Italy, 2010.
[9] H. Quast and T. Loffler, “3D-terahertz-tomographic for material in- spection and security,” J. Conf. Infrared Millimeter and Terahertz Waves IRMMW-THz, Sept. 2009.
[10] H. Quast, A. Keil, T. Hoyer, and T. Loeffler, “All-electronic 3D tera- hertz imaging for the NDT of composites,” 2nd Int. Symp. NDT. in Aerospace 2010 –We.4.B.3, 2010.
[11] K.B. Cooper, R.J. Dengler, N. Llombart, T. Bryllent, G.
Chattopadhyay, E. Schlecht, J. Gill. C. Lee, A. Skalare, I. Mehdi, and P.H. Siegel, “Penetrating 3-D imaging at 4- and 25-m range us- ing a submillimetr-wave rader,” IEEE Trans. Microw. Theory Tech., vol.56, no.12, pp.2771–2778, Dec. 2008.
[12] D. Huang, E.A. Swanson, C.P. Lin, J.S. Schuman, W.G. Stinson, W. Chang, M.R. Hee, T. Flotte, K. Gregory, C.A. Puliafito, and J.G. Fujimoto, “Optical coherence tomography,” Science, vol.254, pp.1178–1181, 1991.
[13] T. Isogawa, T. Kumashiro, H.-J. Song, K. Ajito, N. Kukutsu, K.
Iwatsuki, and T. Nagatsuma, “Tomographic imaging using pho- tonically genetrated low-choherence terahertz noise sources,” IEEE Trans. THz Sci. Tech., vol.2, no.5, pp.485–492, 2012.
[14] H.-J. Song, N. Shimizu, N. Kukutsu, T. Nagatsuma, and Y. Kado,
“Microwave photonic noise source from microwave to sub-terahertz wave bands and its applications to noise characterizations,” IEEE Trans. Microw. Theory Tech., vol.56, pp.2989–2997, 2008.
[15] H.-J. Song, N. Shimizu, T. Furuta, A. Wakatsuki, and T. Nagatsuma,
“Sub-terahertz noise generation with a photodetector and wave- length sliced optical noise signals and its application to spectroscopy mesurement,” Appl. Phys. Lett., vol.93, 241113, 2008.
[16] T. Nagatsuma, T. Kumashiro, Y. Fujimoto, K. Taniguchi, K. Ajito, N. Kukutsu, T. Furuta, A. Wakatsuki, and Y. Kado, “Millimater- wave imaging using photonics-based noise source,” J. Conf. Infrared Millimeter and Terahertz Waves (IRMMW-THz), Sept. 2009.
[17] D.M. Sheen, D.L. McMakin, and T.E. Hall, “Three-dimensional millimeter-wave imaging for councealed weapon detection,” IEEE Trans. Microw. Theory Tech., vol.49, no.9, pp.1581–1592, Sept.
2001.
[18] K. Watanabe, K. Shimizu, M. Yoneyama, and K. Mizuno,
“Millimeter-wave active imaging using neural networks for sig- nal processing,” IEEE Trans. Microw. Theory Tech., vol.51, no.5, pp.1512–1516, May 2003.
[19] K. Mizuno, H. Matono, Y. Wagatsuma, H. Warashina, H. Sato, S.
Miyanaga, and Y. Yamanaka, “New applications of millmeter-wave incoherent imaging,” IEEE MTT-S International Microwave Synpo- sium, no.WE2C-3, June 2005.
[20] A. Wakatsuki, T. Furuta, Y. Muramoto, T. Yoshimatsu, and H, Ito,
“High-power and broadband sub-terahertz wave generation using a J-band photomixier module with rectangular-waveguide output port,” J. Conf. Infrared Millimeter and Terahertz Waves (IRMMW- THz), pp.1999-1–1999-2, 2008.
[21] S.H. Yun, G.J. Tearney, J.F. de Boer, N. Iftimia, and B.E. Bouma,
“High-speed optical frequency-domain imaging,” Opt. Express, vol.11, pp.2953–2963, 2003.
[22] M. Griot, “Fundamental optics,” CVI Laser Optics and Melles Griot, https://www.cvimellesgriot.com/products/Documents/TechnicalGuide/ fundamental-Optics.pdf, accessed June 2013.
Toshiyuki Ikeo was born in Fukui, Japan, on July 1, 1989. He received his B.S. degree in engineering science from Osaka University, Osaka, Japan, in 2012. In 2012, he entered the Graduate School of Engineering Science, Osaka University. His current research includes THz imaging. Mr. Ikeo received the Best Student Pa- per Award at International Topical Meeting on Microwave Photonics (MWP) held in Nether- lands in 2012.
Takayuki Isogawa was born in Shiga, Japan, on January 6, 1988. He received B.S.
degree in engineering science from Osaka Uni- versity, Osaka, Japan, in 2011. In 2011, he entered graduate school of engineering science, Osaka University. His current research includes millimeter-wave and THz imaging. Mr. Isogawa received the Best Student Paper Award at Inter- national Topical Meeting on Microwave Photon- ics (MWP) held in Singapore in 2012. Since 2013, he has been with NTT Docomo Inc., To- kyo, Japan.
Tadao Nagatsuma received B.S., M.S., and Ph.D. degrees in electronic engineering from Kyushu University, Fukuoka, Japan, in 1981, 1983, and 1986, respectively. In 1986, he joined the Electrical Communications Labora- tories, Nippon Telegraph and Telephone Corpo- ration (NTT), Atsugi, Kanagawa, Japan. From 1999 to 2002, he was a Distinguished Techni- cal Member with NTT Telecommunications En- ergy Laboratories. From 2003 to 2007, he was a Group Leader with NTT Microsystem Integra- tion Laboratories. He is currently a Professor at the Division of Advanced Electronics and Optical Science, Department of Systems Innovation, Grad- uate School of Engineering Science, Osaka University, Toyonaka, Japan.
His research interests include millimeter-wave and terahertz photonics and their application to sensors and wireless communications. Prof. Nagat- suma is a member of the Technical Committee on Microwave Photonics of the IEEE Microwave Theory and Techniques Society, and the Microwave Photonics Steering Committee, and serves as an associate editor of IEEE Photonics Technology Letters. He is the recipient of numerous awards in- cluding the 1992 IEEE Andrew R. Chi Best Paper Award, the 1997 Okochi Memorial Award, the 1998 Japan Microwave Prize, the 2000 Minister’s Award of the Science and Technology Agency, the 2002 Asia-Pacific Mi- crowave Conference Prize, the 2004 Yokosuka Research Park Award, the 2006 Asia-Pacific Microwave-Photonics Conference Award, the 2006 Eu- ropean Microwave Conference Prize, the 2007 Achievement Award pre- sented by the IEICE, the 2008 Maejima Award presented by the Post and Telecom Association of Japan, the 2011 Commendation for Science and Technology by the Minister of Education, Culture, Sports, Science and Technology, and the 2011 Asia-Pacific Microwave Conference Prize.