著者
石田 正美
権利
Copyrights 日本貿易振興機構(ジェトロ)アジア
経済研究所 / Institute of Developing
Economies, Japan External Trade Organization
(IDE-JETRO) http://www.ide.go.jp
journal or
publication title
IDE Research Paper
volume
5
year
2003-09
Industrialization in Indonesia since the 1970s
Masami ISHIDA
Senior Research Fellow, Institute of Developing Economies (IDE-JETRO)
Industrialization in Indonesia since the 1970s
1Masami ISHIDA
Introduction
During the period from the latter half of the 1980s until just before the Asian currency crisis in 1997, Indonesia’s economic development had drawn expectations and attention from various quarters, along with Malaysia and Thailand within the same Association of Southeast Asian Nations (ASEAN). In fact, the 1993 report by the World Bank, entitled “East Asian Miracle: Economic Growth and Public Policy,” recognized Indonesia as one of the East Asian economies with the strong economic performance, i.e. sustained economic growth (World Bank [1993]). And it was the manufacturing industry that had been the driving force behind Indonesia’s economic growth during that period. Since the 1997 outbreak of the Asian currency crisis, however, the manufacturing sector in Indonesia has been mired in a situation that rules out the kind of bright prospects it had emanated previously. The Indonesian economy is still in the developing stage, and in accordance with the history of industrial structural changes in other countries, Indonesia’s manufacturing industry can still be expected to serve as the engine of the country’s economic development. But is it really possible in an environment where economic liberalization and globalization are forging ahead? And, what sort of problems have to be dealt with to make it possible? To answer these questions, it is necessary to know the current conditions of Indonesia’s manufacturing sector, and to do that, it becomes important to think back on the history of the country’s industrialization. Thus, this paper is intended to retrace and unlock the track of Indonesia’s industrialization up until the establishment of the manufacturing sector in its present form, with the ultimate goal being to give answers to the above-mentioned questions. Subject to an analysis in this paper is the period from the installment of President Soeharto’s administration onward when industrialization of the
1
modern industrial sector2 moved into high gear.
The composition of this paper is outlined below. Section 1 first shows why it is important to examine import substitution and export orientation, both of which are used as the measures of the analysis in this paper, in tracking the history of the industrialization, and then discuss indicators of import substitution and export orientation as well as statistical data and resources needed to develop those indicators. Section 2 clarifies the status of the manufacturing industry among all industries by looking at the composition ratio of the manufacturing industry in terms of value added, imports and exports. Section 3 to 5 cover three periods between 1971 and 1995 and make an analysis of import substitution, export orientation and changes in the industrial structure for each period. Section 3 analyzes the period from 1971 through 1985, when Indonesia pursued the import substitution policy amid the oil boom. Section 4 covers the period from 1985 through 1990, when the packages of deregulatory measures were announced successively under structural adjustment policies made necessary by the fall in oil prices. Section 5 examines the period from 1990 through 1995, which saw the alternate shifts between the overheating of the economy by sharply rising investment by both domestic and foreign investors in the wake of the liberalization of investment, trade and financial services, and polices to cool down the economy. Section 6, which covers the 1995-1999 period straddling the economic crisis, is designed for an analysis of the changes in production trends before and after the economic crisis as well as the changes in the industrial structure. Section 7, after summing up the history of Indonesia’s industrialization examined in the previous sections, discusses problems found in respective sectors and attempts to present future prospects for the country’s manufacturing industry.
2 The “modern industry” here means the manufacturing industry based on imported foreign
technologies. Thus, the term “modern” is being used to signify that something is based on foreign technologies.
1. Perspective of Analysis, Indicators of Industrialization, and
Statistical Data
1. Perspective of an Analysis
This paper attempts to make an analysis of the tracks of industrialization by using the two measures of import substitution and export orientation. The reason for this approach is that import substitution initially becomes necessary for a modern manufacturing industry to grow out of conventional sectors including agriculture and simple, primary processed products. During the period immediately after winning independence, Indonesia could not possess a modern manufacturing sector other than factories set up by the Netherlands, its former suzerain power, and had to totally depend on imports for goods that required the modern manufacturing process. Industrialization of the modern sector begins with import substitution, which calls for construction of domestic factories for manufacturing products that previously had to be imported.
But construction of modern-sector factories requires imports of machinery and other capital goods, and imports of capital goods require foreign currencies, and further, earning foreign currencies requires exports. The past research into the economic development process of Japan, Taiwan and South Korea has found that foreign currencies were initially earned through exports of conventional goods such as agricultural products and the primary stage of import substitution began with light industry through imports of machinery financed with foreign currencies earned by exports of conventional goods. But exports of industrial products bring in more foreign currencies than those of agricultural and other primary products. This is because, generally speaking, manufactured goods require more sophisticated technologies and have greater value added under the law of scarcity, with international prices for industrial goods being more stable than those for primary products. For these reasons, when light industry industries have developed enough to satisfy domestic demand, exports of light industrial products begin. At this point, a developing economy enters
the stage of export orientation, starting to ship light industrial products abroad to replace exports of primary and other conventional products.
By the same token, heavy industry products require technologies more sophisticated than those needed to make light industry products, and accordingly the cost of purchasing capital goods needed is higher. For these reasons, heavy industry products are considered to have a higher degree of scarcity than light industrial products, have higher value added, and benefit from more stable international market prices. Consequently, as a stage to follow exports of light industry products, a developing economy purchases capital goods needed for the development of the heavy industry sector with foreign currencies earned through exports of light industry products, thus entering the second import substitution period when the developing economy focuses on the development of the heavy industry sector for producing capital goods, intermediate goods and durable consumer goods for which it previously depended on imports. Then, as the heavy industry sector is developed enough to satisfy domestic demand, the developing economy goes into a period when main export items switch from light industry products to heavy industry products, or the stage of export orientation of heavy industry products. Generally speaking, the developing economy evolves through the process described above.3
In the sense of discussion thus far, it can be recognized that the development of manufacturing industries requires the process of import substitution and export orientation. At the same time, this means that the process of import substitution and export orientation naturally entails the increasing value added of industrial production.
3 Ohkawa [1993:13-14] and Fei, Ohkawa and Ranis [1986] use the term, the first period of export
substitution, to signify the period when mainstay export items shift from primary products and other conventional products to light industry products, and use the term, the second period of export substitution, to signify the period when heavy industry products replace light industry products as main items for exports. However, the idea of export substitution also has the meaning that for example, exports of natural rubber are suspended and instead, natural rubber is supplied to domestic tire makers and others as intermediate material. The author decided to avoid the use of the idea of export substitution for the sake of avoiding confusion.
Many developing countries aim for import substitution and export orientation in their industrialization policies because both are necessary as the process of industrialization. In tracing the tracks of industrialization, therefore, the importance to examine policies designed for the promotion of import substitution and export orientation and also to look into whether both processes are actually making headway on an industry-by-industry basis.
In looking at industrialization in Indonesia, however, we need to pay heed to the following three matters. First, initial conditions for Indonesia’s industrialization were different from those seen in Japan, Taiwan or South Korea in that the country had an abundance of unskilled labor as well as an abundance of natural resources. Second, as soon as Indonesia went into the process of modern industrialization, crude oil prices soared to bring in huge revenue from exports of crude oil on top of foreign aid money, finding itself in a considerably blessed position in terms of acquiring foreign currencies needed for import substitution. This made Indonesia’s industrialization different from industrialization in South Korea or Taiwan in that the first stage of industrialization was attempted to immediately elevate to the “full-set” industrialization where import substitution for heavy industry products came into sight along with import substitution for light industry products. Third, in Indonesia, the full-fledged development of light industries came after the startup of heavy industries, because the downturn in crude oil prices made it necessary for Indonesia to grow out of the economy heavily dependent on oil and gas development and prompting the country to make a shift from industry protection policy, implemented as part of import substitution, to export-oriented policy, a shift that contributed to the development of light industries at this stage.
2. Indicators Employed in Analysis
The ratio of imports to domestic demand in each manufacturing sector (hereinafter referred to as import ratio) and the composition ratio of each sector’s imports to total imports of manufactured goods (hereinafter referred to as import composition ratio) are used as indicators of import substitution. If the import ratio for a particular sector at a
given point of time shows a decline from an earlier different point of time, import substitution is making progress in that particular sector, while a decline in the import composition ratio leads to a judgement that import substitution in that particular sector is making headway relative to other sectors. However, imports of production goods such as machinery and chemical products, particularly imports of capital goods like machinery, are essential in the process of industrialization. The increase in the import composition ratio of these production goods was recognized in many countries in the process of their industrialization. In this respect, when the import composition ratio rises for production goods, whether it means a fallback in import substitution relative to other sectors or an increase in demand for production goods due to active industrialization needs to be determined by taking into consideration changes in other indicators as well as specific economic conditions prevailing at that particular point of time. When the import ratio rises but the import composition ratio declines, import substitution is possibly making progressing but not fast enough to catch up with the pace of increase in demand in that particular sector. Conversely, when the import ratio declines but the import composition ratio rises, import substitution is also possibly making progress despite a higher ratio of that particular sector to total imports.
The impact of import substitution on other sectors of industry is measured by the ratio of imported intermediate goods to all intermediate goods (hereinafter referred to as import dependence or as import dependence on intermediate input) used each of downstream sectors. When the degree of dependence on imports declines, it is judged that import substitution is making progress in upstream sectors of that particular sector. As for policy indicators, the direction of trade policy is judged on the basis of changes in the ratio of the combined amounts of import tariffs and import sales taxes, imposed as a policy tool to aid import substitution, to the total value of imported goods. A rise in the ratio of import tariffs and import sales taxes is interpreted as a result of the raising of the tariff and tax rates to protect that particular manufacturing sector. A decline in the ratio is judged to mean either the rates of the import tariffs and import sales taxes are lowered or the import tariffs and/or import sales taxes are abolished to result in the progress of trade liberalization. However, a decline in the ratio of import
tariffs and import sales taxes could occur when import restrictions or other non-tariff protection policies are invoked against particular products. Therefore, we need to keep in mind that a decline in the ratio of import tariffs and import sales taxes alone does not warrant an unequivocal judgment that trade liberalization measures have been taken.
Used as indicators for export orientation are the ratio of exports to total domestic supply (hereinafter referred to as export ratio) and the composition ratio of exports by each sector of total exports of manufactured goods (hereinafter referred to as export composition ratio). A rise in the export ratio is interpreted as showing progress in export orientation, while a rise in the export composition ratio is judged to represent progress in export orientation of that particular sector relative to other manufacturing sectors. When a rise in the export ratio is accompanied with a decline in the export composition ratio, that particular sector is understood to be possibly making progress in export orientation but accounts for a relatively small share of the country’s overall manufacturing sector. Conversely, when the export ratio declines but the export composition ratio rises, the domestic demand is probably increasing faster than exports but that particular sector is still making progress in export orientation.
The ratio of value added contributed by each sector to overall value added in manufactured goods (hereinafter referred to as value added composition ratio), is used as an indicator of changes in the industrial structure. Further, in order to assess the relationship between respective changes in import substitution and export orientation and the industrial structure,4 this analysis looks at the relationship between the rise/fall in the import ratio and the rise/fall of the value added composition ratio as well as the relationship between the rise/fall in the export ratio and the rise/fall of the value added composition ratio, for each manufacturing sector. Specifically, data is tabulated for four
4 Import substitution, in other words, means the rise in the ratio of domestically produced goods to
the total supply of a particular product, and as such, leads to an increase in production. Similarly, export orientation means an increase in production provided that domestic demand is fully satisfied. In this meaning, the progress in import substitution and export orientation, as far as production is increased, is considered to bring a positive impact in terms of the industrial structure.
groups: sectors with the higher import ratio and the higher value added composition ratio; sectors with the higher import ratio and the lower value added composition ratio; sectors with the lower import ratio and the higher value added composition ratio, and sectors with the lower import ratio and the lower value added composition ratio. When the number of sectors with the lower import ratio and the higher value added composition ratio, or the number of sectors with the higher import ratio and the lower value added composition ratio is larger than the total number of sectors covered, it can be judged that the industrial structure has changed as a result of import substitution. As for the rise/fall in the export ratio and the rise/fall in the value added composition ratio, data is also collected for four groups. When the number of sectors with the higher export ratio and the higher value added composition ratio or the number of sectors with the lower export ratio and the lower value added composition ratio is larger than the total number of sectors covered, it can also be concluded that the industrial structure has changed as a result of export orientation.
3. Statistical Data and Sources
The above-mentioned indicators are based on data that can be obtained from the input-output table, published in about every five years. This paper makes use of the input-output table for its analysis between 1971 and 1995. In tracing the tracks of industrialization, it is necessary to examine changes in the industrial structure of the manufacturing sector by chronological order. Thus, this paper uses the input-output table based on producer prices in a total of 66 sectors.5
5 Indonesia’s input-output tables have the three different numbers for industry sectors covered: 19,
66 and about 170. The 1971 table covered 175 sectors, the 1975 table 179 sectors, the 1980 table and the 1985 table 170 sectors, and 1995 table 172 sectors. The number of sectors covered by the most detailed tables is varied year by year, and the frequent changes in industry sector codes make them unsuitable to use in an analysis of the tables of different years. On the other hand, the tables for 66 sectors offer stability in the use of industry codes and are also easy to use for a times-series analysis.
The input-output table does not include price levels for each sector. So, it cannot be expressed in real terms unless price data is borrowed from other statistics and processed in a manner that suits each sector in the input-output table. For this reason, it is not necessarily clear whether an increase in terms of value means stems from a rise in prices or from an increase of volume. In this respect, it cannot be denied that an analysis based on the input-output table has its limits.
On the other hand, an analysis for the period from 1995 through 1999 is conducted by converting large and medium manufacturing statistics industrial statistics into input-output table codes. This method is instrumental in closely following the kaleidoscopic changes seen before and after the economic crisis, in addition to the fact that a fully reliable input-output table was not available until 2000. The period straddling the economic crisis is analyzed by examining specific indicators like the value added composition ratio and the growth of value added in real terms for each year of the period.
2. Position of Manufacturing Sector among All Industries
Table 1 shows the composition ratios for the sectors of agriculture, forestry and fisheries, mining, manufacturing, construction and services in terms of value added, imports and exports of goods and services of all the industries.
First, the agriculture, forestry and fisheries sector and the services sector accounted for 30 to 40%, respectively of the value added in 1971, with the manufacturing sector’s composition ratio standing low at only 12.1%. Later, the composition ratio for the agriculture, forestry and fisheries sector declined steadily and slumped to 17.5% in 1995. On the other hand, in the wake of the oil boom, the mining sector raised its composition ratio to as high as around 25% in 1980. But the subsequent fall in crude oil prices brought down the sector’s composition ratio. The services sector has managed to maintain the high composition ratio in the 30% to 40% range, though always showing fluctuations in response to the changes in the ratios of the other manufacturing sectors as well as to the cyclical ups and downs of the
Table 1. Composition of Major Industries (%)
1971 1975 1980 1985 1990 1995
Share of Value Added
Agriculture 35.0 29.2 24.6 22.9 20.5 17.5 Minning & Guarrying 7.3 18.6 25.7 14.9 12.3 7.7 Manufacturing 12.1 11.2 10.3 15.6 20.2 23.6 Construction 4.6 5.3 5.3 6.4 5.7 6.7 Services 41.1 35.8 34.0 40.2 41.3 44.5 100.0 100.0 100.0 100.0 100.0 100.0 Share of Imports Agriculture 3.1 4.8 3.8 5.3 1.7 2.9
Minning & Guarrying 0.5 0.6 7.9 7.5 5.1 3.0 Manufacturing 87.4 84.9 76.4 68.2 79.1 75.4 Construction 0.0 0.0 0.0 0.0 0.0 0.0 Services 9.0 9.7 11.9 19.1 14.1 18.8 100.0 100.0 100.0 100.0 100.0 100.0 Share of Exports Agriculture 32.7 13.2 12.3 6.9 2.6 1.6 Minning & Guarrying 33.7 67.8 70.1 43.4 24.9 15.0 Manufacturing 10.6 7.6 9.1 37.1 53.7 57.3 Construction 0.0 0.0 0.0 0.0 0.0 0.0 Services 23.1 11.4 8.4 12.6 18.8 26.0 100.0 100.0 100.0 100.0 100.0 100.0 (1) Agriculture is composed of agriculture, fishery and forestry.
(Source) Processed in accordance with Input-Output Table of Indonesia
economy. In the meantime, the value added composition ratio of the manufacturing sector has steadily increased since 1985. It overtook the mining sector in 1985, surpassed the agriculture, forestry and fisheries sector in 1995 to come closer to 25%, becoming the second biggest industry sector next only to the services sector. As for imports, the composition ratio of manufactured goods remained high in the 70% to 90% range throughout the period of the analysis. However, reflecting progress in import substitution due to industrialization, the import composition ratio of manufactured goods, which stood at as high as nearly 90% in 1971, fell to 75.4% in 1995 after repeated fluctuations, showing a medium- and long-term downtrend. Still, in the short to medium term, the import composition ratio of manufactured goods remains vulnerable to cyclical changes in terms of income factors. By contrast, the import composition ratio of agricultural, forestry and fisheries products, which was a mere 3.1% in 1971, rose to 5.3% in 1985 apparently because the income elasticity of demand for these products was low relative to demand for industrial products. The
composition ratio of services imports is on the long-term uptrend. But the import composition ratio of services increased during the periods of from 1980 to 1985 and from 1990 to 1995, when the import composition ratio of manufactured goods declined, suggesting it is sensitive to the rise/fall in the import composition ratio of manufactured goods.
As for exports, the composition ratio of agricultural products and mineral products stood at over 30% respectively in 1971, while the ratio of manufactured goods was only about 10%, less than a little over 20% for services exports. The export composition ratio for mineral products surged to around 70% from 1975 to 1980 in the wake of rising crude oil prices, but followed the downtrend since 1985 and came down to the low of 15.0% by 1995. In addition to the decline in crude oil prices, the drop in the composition ratio for mineral products was apparently caused by the rise in the composition ratio of manufactured products as exports of refined petroleum, which are included in manufactured goods, replaced exports of crude oil as a result of the rush of construction of oil refineries in Indonesia in the 1980s and 1990s. On the other hand, the export composition ratio of manufactured products, which broke through 10% to plunge to 7.6% in 1975, rose sharply from 1985 through 1990, and topped 50% to reach 57.3% in 1995.
As seen above, the import composition ratio of manufactured goods remained overwhelmingly high in the 70% to 90% range throughout the period under review. For value added and exports, however, the share of manufactured goods was lower than agricultural, forestry and fisheries products in 1971, and increased only after the oil boom came to an end in 1985. As of 1995, manufactured goods achieved the export composition ratio of over 50%, but their value added composition ratio was still less than 25%, falling short of the ratio for the services sector. Therefore, given the overwhelming import composition ratio of manufactured goods, including production goods and raw materials throughout the period of the analysis and the increasing value added and export composition ratios for them in 1985 onward, we can see the tracks of the increasingly evident industrialization in Indonesia since 1985, after staying in the shadow of the mining sector amid the oil boom until that year.
3. Powerful Industrialization for Import Substitution and
Broad-based Industrialization for Export Orientation (1971-1985)
1. Era of Industrialization Policy for Import Substitution
Generally speaking, the majority view had it that Indonesia’s industrialization policy for import substitution was implemented simultaneously and in parallel with the oil boom that began in 1973. Certainly, there is no question that the oil boom had spurred the import substitution policy. But the First Five-Year Program announced in 1969 designated fertilizers, cement and agricultural machinery as priority areas for industrialization. In the same year, Indonesia also announced a policy for the promotion of domestic production of automobiles requiring automakers to shift gears from semi-knockdown production to full knockdown production (the Institute of Developing Economies [1970:454]). Considering these developments, it can be argued that the import substitution policy was already in place in 1969. Subsequently, beginning in 1970, Indonesia successively adopted such measurers as import tariff hikes and import bans targeted at specific industry sectors. On the other hand, Indonesia basically permitted foreign companies to make direct investment freely in the country, as demonstrated by the fact that the enactment of the law on foreign investment in 1967 preceded the 1968 enactment of the law on domestic investment, with the bulk of foreign direct investment flowing into synthetic fibers and other spinning sectors. However, as Indonesian industrialists intensified their calls for the government to protect domestic industries, the government gradually began to become selective in accepting foreign direct investment, starting with the 1970 designation of sectors where foreign companies were not allowed to enter any longer. The oil boom that began in 1973 made major oil-producing nation Indonesia very rich, and the Indonesian government, which was previously forced to depend on foreign aid to procure funds for economic development, gradually began to adopt nationalistic policies toward foreign direct investment and trade in general. Thus, Indonesia strengthened protectionism through both tariff and non-tariff barriers and tightened the
screws further on foreign investment. In particular, after the anti-Chinese and anti-Japanese “Malari disturbances” that broke out in 1974 when then Japanese Prime Minister Kakuei Tanaka visited Indonesia, the government in the same year further intensified restrictions on foreign capital, requiring all foreign-affiliated companies in the country to raise the ratio of Indonesian capital to 51% or more within 10 years. In the process of industrialization, meanwhile, using the ample revenue from oil exports that flowed to state-owned oil firm Pertamina, state enterprises established new factories or boosted production capacity of existing factories one after another in such areas as oil refining, fertilizers, cement, basic iron/basic iron/steel and aluminum. The downturn in crude oil prices, which peaked out in 1982, prompted a reconsideration of the industrialization policy for import substitution. In 1983, the rupiah, Indonesia’s currency, was devalued, and large-scale industrialization projects were either scaled back or postponed. Yet, the course correction for macroeconomic policy as a whole was limited (Hill [2000]), and Indonesia continued to undertake projects by state enterprises that were already under way at the time. The examples of continued projects include the startup of the Cilacap oil refinery and the start of production of hot-rolled basic iron/basic iron/steel and slab basic iron/basic iron/steel by PT Krakatau Steel in 1983, the launch of construction work on a purified terephthalic acid (PTA) plant by Plaju and completion of the Asahan aluminum project in 1984. Meanwhile, this period saw the activated entry into manufacturing operations by Chinese corporate groups, including Soedono Salim (Salim Group), who founded a flour miller, PT Bogasari, in 1969; William Soeryadjaya (Astra Group), who established PT Astra Motor, an auto importer, seller and assembler, in a joint venture with Toyota Motor Corp. in 1971; The Ning King (Argo Manungal Group), who established PT Darma Manunggal as an integrated spinning and weaving concern in 1972; and Prajogo Pangestu (Barito Pacific Group), who founded a company for manufacturing and exporting plywood in 1977 (Mihira and Sato ed. [1992: 139-156]).
2. Validation of Results of Industrialization Policy for Import Substitution
(1) Validation by Import Ratios
Table 2 shows the changes in the period from 1971 to 1985 in the value added composition ratio, the import composition ratio, the export composition ratio of each sector in the manufacturing sector, the import ratio, the export ratio and the ratio of import tariffs and import sales taxes of each sector, as well as the changes in the import dependence on intermediate input in the period from 1980 to 1985. Points that should be kept in mind in looking at the table are explained in the note at the foot of the table6.
As the period under review was the period during which the industrialization policy for import substitution was implemented, the import ratio is examined at first to see the import substitution achieved by each sector. In this period, the import ratio declined for 16 out of 23 sectors7. The import ratio for the overall manufacturing sector
6 The first of the points to be kept in mind is that while the value added composition ratio, the
import composition ratio and the export composition ratio for the sector of refined petroleum represent the composition ratios to manufactured goods as a whole, the composition ratios for all other sectors represent the ratios to manufactured goods excluding refined petroleum. Thus, the ratios for all the sectors other than refined petroleum add up to 100. The reason for this treatment of refined petroleum is that, as shown by Table 4, the composition ratio of refined petroleum was extremely large in 1985 for exports and value added and prices of refined petroleum changed hugely from 1971 due to the oil boom, and unless refined petroleum are excluded, exports and value added for the other sectors in the year would be overly underestimated. The second point is that for rubber/plastic wares, no simple comparison can be made between the respective ratios of 1980 and 1985. In the 1971 table up to the 1980 table, the process of making rubber resin from natural rubber sap was classified in the natural rubber sector of primary industries. But the process was classified in the sector of rubber/plastic wares from the 1985 table onward. Thus, strictly speaking, the total value added, exports and imports of manufactured goods as a whole in 1985 would increase due to the addition of that process. In order to reflect that factor in the comparison between 1985 and other years, it may be more appropriate to prepare the tables that exclude rubber/plastic wares. However, because the value of output of rubber resin produced by this process accounts for only a fraction of the value of manufactured products as a whole, this paper uses the tables with no adjustment made for the sector.
7
As far as Table 2 is concerned, the import ratio of cigarettes is 0.0% for both 1971 and 1985. But the calculation to two places of decimals showed the decline in the import ratio. Hereinafter, when
Table 2.Structural Change in Manufacturing Industries from 1971 to 1985 (Continues)
Share of Value Added(%) Share of Import(%) Share of Exports(%) 1971 1975 1980 1985 1971 1975 1980 1985 1971 1975 1980 1985 Processed/Preserved Food 0.5 1.2 1.5 1.2 0.8 0.8 1.0 0.9 1.1 0.7 0.3 0.3 Oil and Fat 2.9 0.7 1.0 2.6 0.1 0.1 0.2 0.1 34.9 13.3 5.8 0.5 Milled Rice 7.2 13.1 12.4 7.2 5.4 7.4 6.6 0.2 0.0 3.8 3.5 0.7 Flour/Flour Products 1.0 2.9 2.2 1.5 1.0 0.1 0.2 0.2 0.0 0.2 0.1 0.0 Sugar/Sugar Products 6.2 5.5 2.3 2.8 1.1 0.8 0.2 0.0 2.9 4.2 1.7 0.6 Other Food Products 5.9 5.1 4.5 4.2 0.3 0.2 3.3 0.6 33.0 5.2 2.0 2.2 Beverages 1.5 1.5 1.2 1.1 0.2 0.1 0.1 0.1 0.1 0.1 0.3 0.1 Cigarettes 6.2 8.9 10.7 12.6 0.0 0.2 0.0 0.0 0.0 0.4 0.1 0.1 Yarn Spun 1.7 1.8 2.3 2.8 3.1 2.7 0.4 0.5 0.2 0.0 0.2 0.4 Textiles/Apparel/Leather 16.3 11.9 9.5 7.9 3.1 1.7 1.3 1.0 4.7 2.1 10.1 16.0 Bamboo/Wood/Rattan Products 2.2 2.9 6.9 9.2 0.2 0.1 0.0 0.0 0.2 0.7 20.3 28.7 Paper/Paper Products/Cardboard 4.8 4.1 2.6 3.1 3.8 1.6 2.3 2.8 0.0 3.6 0.3 0.6 Fertilizer/Pesticide 0.2 1.7 2.4 3.7 3.1 9.1 1.1 1.1 0.0 0.1 2.2 2.4 Chemicals 5.3 4.3 6.1 5.2 6.6 10.0 12.9 21.0 1.9 11.7 2.7 4.6 Refined Petroleum 12.4 6.0 1.9 28.2 1.3 9.2 1.9 4.6 16.7 67.9 47.8 58.0 Rubber/Plastic Wares 0.9 1.2 2.3 5.3 0.6 0.7 0.8 1.0 0.1 0.1 0.1 20.5 Non-metallic Mineral Products 4.0 3.6 2.6 3.7 1.0 0.7 0.8 2.2 0.1 0.1 0.3 0.2 Cement 1.1 1.3 2.4 2.0 1.1 1.6 0.4 0.0 0.0 0.0 1.2 0.4 Basic Iron/Steel 0.3 0.3 3.0 3.6 5.6 9.8 9.2 5.8 1.3 0.1 1.3 0.9 Non-ferrous Basic Metal 1.4 1.2 1.5 2.9 1.0 1.5 1.8 2.4 15.5 37.7 39.9 16.7 Fabricated Metal Products 4.4 3.8 3.1 3.6 3.9 6.4 5.8 7.8 0.0 1.1 0.5 0.1 Machine/Electrical 1.8 3.2 9.3 6.6 48.7 26.1 21.9 32.6 1.5 8.8 6.2 2.8 Transport Equipment 22.7 18.9 8.9 6.4 7.5 17.2 27.8 16.7 0.0 5.5 0.6 0.1 Other Manufactured Products 1.2 1.0 1.3 1.0 1.6 1.3 1.9 2.7 2.3 0.7 0.3 0.9 Total Manufactured Industries 112.4 106.0 101.9 128.2 101.3 109.2 101.9 104.6 116.7 167.9 147.8 158.0
showed an 8.2-point drop from 28.6% to 20.4%, with the marked decline registered between 1980 and 1985. By sector, nine sectors showed the fall of two-digit or larger: fertilizers/pesticide (with the drop of 72.4 points in the import ratio); basic iron/basic iron/steel (44.6 points); yarn spun (35.4 points); machine/electrical machinery/apparatus (32.4 points); cement (25.1 points); flour/flour products (23.0 points); processed/preserved food (19.2 points); milled rice (13.2 points); and paper/paper products/cardboard (11.0 points).
Of these nine sectors, the three sectors of fertilizers/pesticide, basic iron/steel
the tables for different years show the identical figures, the calculation to two places of decimals is adopted to detect potential difference.
Table 2.Structural Change in Manufacturing Industries from 1971 to 1985 (Continued)
Import Ratio (%) Export Ratio (%) Import Related Tax (%) Dep. on Import (%) 1971 1975 1980 1985 1971 1975 1980 1985 1971 1975 1980 1985 1980 1985 Processed/Preserved Food 32.5 17.7 22.2 13.3 5.8 0.9 1.0 1.7 30.2 38.4 18.1 10.6 9.4 5.5 Oil/Fat 1.5 2.1 5.2 1.1 25.6 16.1 18.7 1.8 12.2 29.5 7.1 5.7 1.8 3.2 Milled Rice 13.5 12.6 0.3 0.0 0.3 0.9 0.3 0.0 0.0 2.3 0.2 0.1 Flour/Flour Products 25.0 0.8 2.6 2.0 0.0 0.1 0.1 0.1 4.0 21.1 4.8 4.8 33.2 47.8 Sugar/Sugar Products 9.6 2.5 0.5 2.3 2.5 4.1 2.6 40.6 18.3 9.3 2.5 1.5 Other Food Products 2.3 1.2 26.1 3.5 20.2 1.7 1.9 4.5 39.1 59.9 2.1 9.0 10.5 9.2
Beverages 5.0 3.9 5.5 2.4 0.1 0.2 1.9 1.1 61.7 98.7 67.9 8.9 21.8 7.2 Cigarettes 0.0 0.9 0.3 0.0 0.0 0.1 0.1 0.1 90.7 155.1 67.6 9.8 15.2 6.0 Yarn Spun 40.5 32.7 6.9 5.1 0.4 0.0 0.5 1.6 12.4 15.7 11.0 7.0 89.4 63.1 Textiles/Apparel/Leather 7.1 5.6 6.3 4.8 1.0 0.3 5.8 22.1 83.5 59.2 29.6 11.6 15.2 12.1 Bamboo/Wood/Rattan Products 3.3 2.1 0.6 0.2 0.3 0.5 21.7 38.4 45.4 44.5 17.1 16.3 3.0 1.6 Paper/Paper Products/Cardboard 34.4 18.7 28.0 23.4 0.0 2.4 0.6 2.3 19.5 31.2 15.5 8.6 70.3 39.7 Fertilizer/Pesticide 81.4 18.6 9.0 0.2 0.3 5.3 7.1 6.1 1.4 2.4 46.1 42.4 Chemicals 35.6 42.2 53.7 56.2 1.5 4.6 3.0 9.7 20.9 27.8 5.0 5.7 56.3 54.6 Refined Petroleum 4.3 51.0 5.8 7.6 5.3 50.9 42.9 45.2 10.5 5.3 6.5 1.6 42.7 16.2 Rubber/Plastic Wares 21.0 18.7 11.6 7.3 0.3 0.1 0.2 35.9 51.7 91.9 17.0 11.9 75.8 36.3 Non-metallic Mineral Products 14.7 8.9 15.8 20.8 0.1 0.0 0.8 1.0 50.6 230.4 13.5 4.1 30.8 17.7
Cement 25.8 41.7 11.2 0.7 0.0 0.0 4.1 2.2 35.4 22.5 5.4 9.7 54.2 10.4 Basic Iron/Steel 85.0 79.1 60.3 40.4 12.7 0.8 2.6 3.6 4.5 17.9 7.5 4.5 61.4 31.0
Non-ferrous Basic Metal 37.1 56.4 59.0 43.9 43.9 63.3 79.9 67.1 10.0 10.8 4.3 8.1 11.7 30.9 Fabricated Metal Products 28.6 36.8 42.1 38.8 0.0 0.5 0.7 0.4 21.2 24.5 7.6 7.1 59.7 38.9 Machine/Electrical Machinery/Apparatus 88.9 70.3 52.3 56.5 4.3 6.1 3.9 4.3 6.8 18.9 9.9 9.8 71.0 69.1 Transport Equipment 18.1 28.1 52.9 42.1 0.0 0.6 0.3 0.2 31.6 29.2 9.2 5.4 82.2 54.2 Other Manufactured Products 37.8 36.0 48.8 50.0 7.8 1.5 1.8 11.1 23.1 27.8 18.3 8.1 44.3 32.6 Total Manufacturing Industries 28.6 29.2 28.3 20.4 4.0 5.3 8.7 17.4 7.1 7.0 5.1 4.1 20.0 4.6
(1) The import ratio is obtained by dividing imports of goods by domestic demand (intermediate demand + private consumption + government consumption + inventory change).
(2) The export ratio is obtained by dividing exports of goods by total production.
(3) The ratio of import tariffs and import sales taxes is obtained by dividing the combined total of import tariffs and import sales taxes by the value of imports of goods.
(4) In the 1975 table, since subsidies provided to the milled rice, sugar/sugar products and fertilizers/pesticide sectors were deducted from the a mounts in the columns for the import tariffs and import sales taxes, the actual combined amounts of import tariffs and import sales taxes are not known. In addition, imports of the three sectors were included in the value of imports of goods, but excluded from the composition of demand. For these reasons, the columns for the import ratio and the ratio of import tariffs and import sales taxes in the 1975 table for these three sectors are left blank.
(5) As for the value added composition ratio, the import composition ratio and the export composition ratio, the ratios for the refined petroleum sector are those against the total value of all manufactured goods, but the ratios for all other sectors are the ratios against the total value of all manufactured goods minus the value of refined petroleum.
(6) No comparison is available for the indicators for rubber/plastic wares in 1980 and 1985. But the composition ratios for 1985 were calculated with rubber/plastic wares included.
and yarn spun saw their import ratios decline steadily between 1971 and 19858. The yarn spun sector made the progress in import substitution through the advance into Indonesia by Japanese and Hong Kong cotton yarn spun and synthetic fiber manufacturers in the first half of the 1970s. In the fertilizers/pesticide and basic iron/steel sectors, state enterprises established many new plants and boosted production at existing plants on the strength of increasing oil revenue. In the cement sector, where import substitution went ahead rapidly from 1975 to 1985, the expansion of capacity at a factory of Indo Cement of the Salim Group helped accelerate import substitution, in addition to the new plant construction and capacity expansion by state-owned firms.
In the field of oil refining, where import substitution was accelerated by the establishment of more oil refineries by state oil firm Pertamina, any significant fall was not recognized for the long period between 1971 and 1985, but the import ratio did fall by a sharp 45.2 points for the shorter period from 1975 to 1980. For nonferrous fabricated metal products, including the Asahan aluminum project, the import ratio chalked up the two-digit fall of 15.1 points for the five years between 1980 and 1985. In the transport equipment sector, Japanese-affiliated automobile manufacturers and Astra Group and other local companies promoted import substitution under the government’s policy for domestic production of automobiles, the import ratio also showed the two-digit drop of 10.8 points in the same five-year period. Thus, these sectors can be characterized as the latecomers in Indonesia’s industrialization drive for import substitution.
As reviewed above, import substitution in the period from 1971 to 1985 was clearly characterized by the principal role played by state-owned enterprises that either established new plants or expanded capacity at existing factories in the
8 On the other hand, sugar/sugar products and bamboo/wood/rattan products are among those
sectors that steadily lowered the import ratio from 1971 to 1985, though not by two-digit margins. When the period covered is shortened to that from 1971 to 1988, the sector for rubber/plastic wares also reduced the import ratio consistently, making it the sector with the continued progress in import substitution, though only on a limited scale.
fertilizers/pesticide, basic iron/steel, cement, oil refining and nonferrous metal sectors, while the private sector led import substitution in the yarn spun and transport equipment sectors.
(2) Validation by Import Composition Ratios
Next, the import composition ratios are examined. What should be noted first of all are the extremely high import ratios shown by capital goods and industrial materials, relative to all other sectors, during the whole period from 1971 to 1985. As pointed out in Section 1, the increases in the import composition ratios for capital goods and industrial materials were a phenomenon observed by many other countries that went through the process of industrialization, and thus the increases for Indonesia can also be interpreted as the evidence of the rapid pace of industrialization during this period. In particular, machine/electrical machinery/apparatus constantly registered the biggest import composition ratio, except for 1980, followed by transport equipment, which showed the highest ratio in 1980. The combined import composition ratio for machine/electrical machinery/apparatus and transport equipment, or capital goods, regularly maintained the level of around 50%. Particularly, the fact that the share of machine/electrical machinery/apparatus of total imports of manufactured goods reached as high as 47.8% in 1971 further solidifies the basis for an argument that industrialization for import substitution in Indonesia started before the oil boom. Similarly, the import composition ratios for industrial materials industries, such as chemicals, basic iron/steel and fabricated metal products, are higher than most other sectors.
Next, the extent of import substitution is examined based on the changes in the import composition ratios between 1971 and 1985. The machine/electrical machinery/apparatus and milled rice sectors showed the notable declines of 16.1 points and 5.2 points, respectively. As these two sectors also registered the two-digit falls in their import ratios, the significance of import substitution is fairly large for the two sectors. The machine/electrical machinery/apparatus sector saw the import composition ratio decline between 1971 and 1980 but rise between 1980 and 1985. The
decline in the import composition ratio was remarkably huge between 1971 and 1980, pointing to the possibility that the big fall was a direct result of the hikes in the import tariffs and import sales taxes, which are explained later. The decline in the import composition ratio of milled rice reflects the advancement of the rice self-sufficiency program, which was achieved in 1984 through such policy measures as low-rate loans to rice-growing farmers and subsidies that helped lower prices of chemical fertilizers whose domestic production increase as a result of import substitution.
Sectors that recorded the big drops in their import ratios also uniformly registered the declines in their import composition ratios, though the margins of decline and the order by those margins are slightly different from the import ratio falls. Such sectors included fertilizers/pesticide (with the drop of 2.0 points in the import composition ratio), yarn spun (2.6 points), cement (1.1 points), flour/flour products (0.8 point), and paper/paper products/cardboard (1.0 point). It is almost certain that import substitution pulled ahead in these five sectors during the period under review. However, while basic iron/steel and processed/preserved food, as well as rubber/plastic wares until 1980, showed the decline in their import ratios but they actually increased their import composition ratios. As pointed out in Section 1, these developments indicate that while import substitution itself is making smooth headway in these sectors but the pace of industrialization for import substation simply is not catching up with the remarkable rise in demand for products of the three sectors.
(3) Trends in Import Tariffs and Import Sales Taxes
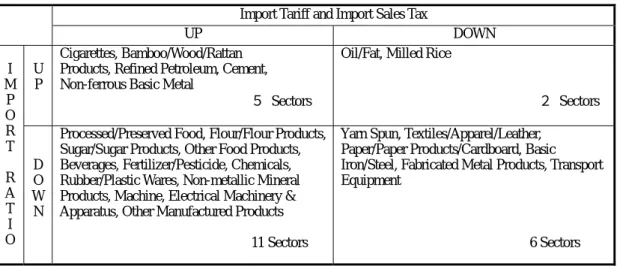
After the validation of import substitution on the basis of the two indicators of the import ratio and the import composition ratio, the next subject of examination is the ratio of import tariffs and import sales taxes, one of policy measures adopted for the promotion of import substitution. As a general trend, the tax rates for the overall manufacturing sector declined steadily from 1971 to 1985. In particular, in the period between 1975 and 1985, the downtrend in the ratio of import tariffs and import sales taxes was recognized in all of the 20 sectors where the ratios were measurable. As of 1985, the ratios were below 20% in all the sectors, showing the fall and leveling of the
ratios. But overall industry protection policies for the promotion of import substitution cannot be assessed solely by the changes in the ratio of import tariffs and import sales taxes. Given the fact that in this period, Indonesia newly instituted non-tariff barriers such as import prohibition steps for specific sectors, we need to make an analysis from a more microeconomic viewpoint going forward.
Meanwhile, for the period between 1971 and 1975, the ratio of import tariffs and import sales axes was generally high relative to other periods and the ratio actually went up in some sectors, making the overall situation more complicated. As the prevailing trend as of 1971, however, it can be observed that firstly, for consumer goods, the ratio was set low for sectors providing daily necessities relative to sectors offering luxury articles of taste9. Secondly, the ratio of import tariffs and import sales taxes was also set low for capital goods and industrial materials for which Indonesia had to depend on imports10. Then, the comparison between 1971 and 1975 revealed that the ratio was raised in 16 out of 21 sectors11. Of these 16 sectors, 11 sectors experienced the decline in the import ratio during the same period, indicating that the higher tax ratios helped achieve a certain measure of progress in import substitution in these sectors12. This suggests that the ratio of import tariffs and import sales taxes was raised during this period as a policy measure for domestic industry protection to
9 While the tax rate is 0.0% for milled rice and 4.0% for flour/flour products, the tax rate is high at
90.7% for cigarettes and at 61.7% for beverages.
10 For example, the tax rate in 1971 was 6.8% for machine/electrical machinery/apparatus , 4.5%
for basic iron/steel, and 6.1% for fertilizers/pesticide. Compared with other product items, the tax rate was also set low at 10.0% for non-ferrous basic metal and 10.5% for refined petroleum.
11 In particular, the tax rate was raised noticeably for non-metallic mineral products (the tax
increase by 179.8 points), cigarettes (64.4 points), rubber/plastic wares (40.2 points), and beverages (37.0 points).
12 The progress in import substitution was recognized for a total of 11 sectors: non-metallic
mineral products, rubber/plastic wares, beverages, other food products, flour/flour products, basic iron/steel, machine/electrical machinery/apparatus , paper/paper products/cardboard, processed/preserved food, other manufactured products, and yarn spun. On the other hand, no progress was seen in the five sectors: cigarettes, oil and fat, chemical products, fabricated metal products, and non-ferrous basic metal.
promote import substitution. On the other hand, in the five sectors of textiles/apparel/leather, bamboo/wood/rattan products, refined petroleum, cement and transport equipment for which the ratios were lowered, insufficient domestic supply presumably prompted the government to put the necessity of imports before import substitution.
At this stage, the changes in the ratios of import tariffs and import sales taxes between 1971 and 1975 are examined for the eight sectors of fertilizers/pesticide, basic iron/steel, yarn spun, cement, refined petroleum, non-ferrous basic metal, milled rice, and machine/electrical machinery/apparatus , which were previously cited as the areas with notable progress in import substitution between 1971 and 1985. First of all, only the three sectors of basic iron/steel, machine/electrical machinery/apparatus and yarn spun witnessed both the higher tax ratios and the lower import ratios. As for milled rice and fertilizers/pesticide, the ratio of import tariffs and import sales taxes is not known for the year of 1975 because of protective subsidies. Meanwhile, the tax ratios were lowered for cement and refined petroleum, indicating that at least at this point of time, industry protection through the ratio of import tariffs and import sales taxes was not introduced in earnest.
(4) Impact of Import Substitution Policy on Other Sectors
Finally, the impact of industrialization for import substitution on other sectors is reviewed here on the basis of the import dependence of intermediate input in each sector between 1980 and 19851319. As discussed up so far, the progress in import substitution in many sectors lowered the import dependence of intermediate input in 20 out of 23 sectors. Also, the import dependence in the entire manufacturing sector fell
13 This sort of analysis is possible only for 1980 and onward. In Indonesia’s input-output tables,
the 1971 table and the 1975 table provided only tables for competitive imports, which do not offer the value for sector-by-sector imports of intermediate goods. On the other hand, the 1980 table provides the table for imports, and the 1985 table and tables thereafter offer tables for non-competitive imports. These tables contain the input value of imported intermediate goods to make is possible to calculate the import dependence for intermediate goods.
by 15.4 points, another indication of the remarkable achievement in import substitution in the five-year period under review.
Of the 20 sectors with the lower import dependence, the two-digit decline was registered by 10 sectors: cement (43.8 points); basic iron/steel (30.4 points); paper/paper products/cardboard (30.6 points); transport equipment (28.0 points); refined petroleum (26.5 points); yarn spun (26.3 points); fabricated metal products (20.8 points); beverages (14.6 points); nonferrous fabricated metal products (13.1 points); and other manufacturing products (11.7 points). Looking more deeply into factors that lowered the import dependence of intermediate input in these sectors, the first thing that draws attention is that import substitution of refined petroleum, as fuel, played a significant part in the import substitution of intermediate input in the beverage, paper/paper products/cardboard, cement and basic iron/steel sectors. Paper/paper products/cardboard contributed to import substitution of intermediate input in the same sector, while also aiding import substitution of intermediate input in the cement and cigarette sectors in the form of packaging material and paper for rolling cigarettes. Import substitution for basic iron/steel products, in addition to its contribution to intermediate input in the same basic iron/steel sector, also helped increase import substitution of intermediate input for fabricated metal products. Further, import substitution of chemicals and sugar/sugar products were instrumental in promoting import substitution of intermediate input in the yarn spun and beverage sectors, respectively14.
Import substitution in the sectors of refined petroleum, basic iron/steel and paper/paper products/cardboard up until 1985 has been broadly criticized as inefficient because those industries are being run by state-owned enterprises. From the standpoint of stability of international balance of payments, however, import substitution achieved in these sectors deserves the credit for producing a certain measure of benefits not only for their own sectors but also for other manufacturing sectors by helping reduce the import dependence for intermediate input.
14
3. Modest But Broad-based Export Orientation
The increases in the export ratio were registered by 19 out of 23 sectors between 1971 and 1985, with the number of such sectors exceeding the number of sectors that reduced the import ratio in the same period. Moreover, the export ratio for the whole manufacturing sector also rose from 4.0% to 17.4%, and the increase margin of 13.4 points is larger than the 8.2-point decline seen in the import ratio for the entire manufacturing sector. Generally, the period prior to 1985 is recognized as the era of import substitution in view of actual policies implemented by the Indonesian government. Yet, in the period before 1985, the export ratios actually increased in a wide array of sectors, and the increase in the export ratio was bigger than the decline in the import ratio for the whole manufacturing sector, though a large portion of that increase in the export ratio came from refined petroleum. These are certainly the unexpected results of this analysis.
Still, the two-digit increase in the export ratio was reported by only the four sectors: refined petroleum (with the increase margin of 39.9 points), bamboo/wood/rattan products (38.1 points), non-ferrous basic metal (23.2 points), and textiles/apparel/leather (21.1 points), with the 14 other sectors posting only single-digit rises. Comparison with the nine sectors that registered the two-digit import ratio falls during the same period indicates that the extent of export orientation seen in this period was small relative to the extent of import substitution achieved. All in all, it can be argued that in the period from 1971 to 1985, import substitution made the powerful advance, accompanied by export orientation that was moderate in extent but seen in a broad range of manufacturing sectors.
Meanwhile, looking at the combination of import substitution and export orientation, as many as 12 sectors witnessed both the decline in the import ratio and the increase in the export ratio15, raising the possibility that the domestic surplus created
15 The 12 sectors are: bamboo/wood/rattan products, textile/leather goods, fertilizers/pesticide,
through import substitution was made available for greater exports. In terms of the export composition ratio, refined petroleum, bamboo/wood/rattan products and textiles/apparel/leather saw two-digit rises in their ratios, making these three sectors the leaders in industrialization for export orientation during this particular period.
4. Changes in Industrial Structure Symbolized by Industrialization for Import Substitution
The value added composition ratio of refined petroleum rose sharply to 28.2% in 1985 primarily because of the surge in crude oil prices. In view of this extraordinary factor, in calculating the value added composition ratios, the ratio for refined petroleum is shown as the ratio to the total value added of all manufactured goods, while the ratios for all other sectors are shown as the ratios to the total value added of all manufactured goods minus refined petroleum.
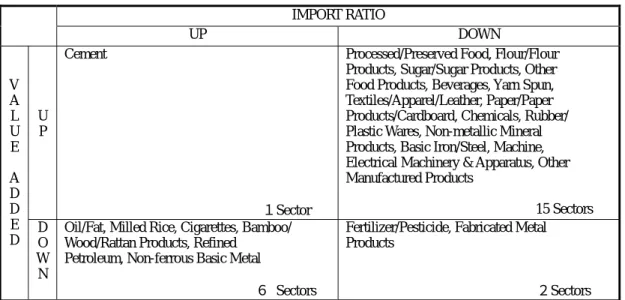
Table 3 classifies manufacturing sectors solely by the rise/fall in the value added composition ratio and the rise/fall in the import ratio between 1971 and 1985. The table shows that of the 12 sectors where the value added composition ratio rose in that period, 10 sectors also registered the decline in the import ratio, indicating the close link between the changes in the value added composition ratio and industrialization for import substitution during the period. When refined petroleum and non-ferrous basic metal, both the latecomers for import substitution, which increased the import ratios between 1971 and 1985, but had the lower import ratios from 1975 to 1980, and from 1980 to 1985, respectively, are included, all the 12 sectors that made progress in import substitution also saw their value added composition ratio increase. This provides further testimony to the even closer relationship between the changes in the industrial structure and import substitution.
Regarding the 12 sectors that saw their value added composition ratio decline, six of them raised the import ratio and another six sectors lowered the import ratio,
m a c h i n e / e l e c t r i c a l m a c h i n e r y / a p p a r a t u s , c i g a r e t t e s , a n d f l o u r / f l o u r p r o d u c t s .
Table 3. Relation between Rise/Falls of Value Added and Import Ratio on 1971-1985
IMPORT RATIO
UP DOWN
U P
Non-ferrous Basic Metal, Refined Petroleum
2Sectors
Processed/Preserved Food, Flour, Cigarettes, Yarn Spun,
Bamboo/Wood/Rattan Products,
Fertilizer/Pesticide, Rubber/Plastic Wares, Cement, Basic Iron/Steel,
Machine/Electrical Machinery/Apparatus, Other Manufactured Products 11 Sectors V A L U E A D D E D D O W N
Other Food Products, Chemicals, Non-metallic Mineral Products,
Fabricated Metal Products, Transport Equipment 5 Sectors
Oil/Fat, Rice Milled, Sugar, Beverages, Textiles/Apparel/Leather, Paper, Paper/Paper Products/Cardboard
6Sectors
1) The values of 1971 and 1980 are compared for Rubber/Plastic Wares. (Source) classified based on Table 2.
offering little evidence of any link between the higher import ratio and the lower value added composition ratio.
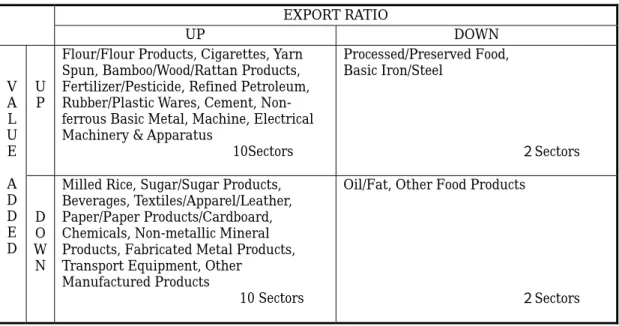
Similarly, Table 4 classifies manufacturing sectors by the rise/fall in the export ratio and the rise/fall in the value added composition ratio to show their relationship in the period between 1971 and 1985. Of the 12 sectors with the higher value added composition ratio, nine sectors also raised the export ratio while three sectors saw the export ratio decline. On the other hand, of the 12 sectors with the lower value added composition ratio, 10 sectors increased the export ratio while two sectors had the lower export ratio. Between the sectors with the rises in the value added composition ratio and those with the declines in the ratio, there was not a big difference in the number of sectors that increased the export ratio, meaning that the rises or declines in the export ratio offer little by way of explanation for the changes in the industrial structure during the period. Meanwhile, textiles/apparel/leather (one of the three sectors cited as the leading forces of industrialization for export orientation during the period) and paper/paper products/cardboard, both of which showed the noticeable trend toward import substitution as well as export orientation, actually reduced their value added composition ratios. This suggests that the extent of progress in industrialization for export orientation was of only limited scale at the time, compared with the degree of
Table 4. Relation between Rise/Falls of Value Added and Export Ratio on 1971-1985
EXPORT RATIO
UP DOWN
U P
Flour/Flour Products, Cigarettes, Yarn Spun, Bamboo/Wood/Rattan Products, Fertilizer/Pesticide, Refined Petroleum, Rubber/Plastic Wares, Cement, Non- ferrous Basic Metal, Machine, Electrical Machinery & Apparatus
10Sectors Processed/Preserved Food, Basic Iron/Steel 2Sectors V A L U E A D D E D D O W N
Milled Rice, Sugar/Sugar Products, Beverages, Textiles/Apparel/Leather, Paper/Paper Products/Cardboard, Chemicals, Non-metallic Mineral Products, Fabricated Metal Products, Transport Equipment, Other
Manufactured Products
10 Sectors
Oil/Fat, Other Food Products
2Sectors (1) The values of 1971 and 1980 are compared for Rubber/Plastic Wares.
(Source) classified based on Table 2.
progress seen in industrialization for import substitution.
Examining the extent of the increase in the value added composition ratio, standing out as the sectors with the increase of 3.0 points or larger are refined petroleum (15.8 points), the latecomer in import substitution that also shows a strong inclination toward export orientation, and bamboo/wood/rattan products (7.0 points), which displayed the two-pronged trend of import substitution and export orientation. The next group of sectors with the increases in the value added composition ratio include the three sectors of machine/electrical machinery/apparatus (4.8 points), fertilizers/pesticide (3.5 points) and basic iron/steel (3.3 points), all of which showed the more remarkable trend of import substitution. In addition, cigarettes (6.4 points), with little relevance in terms of either import substitution or export orientation, showed the noticeable rise in the value added composition ratio.
Conversely, sectors with the decline of 3.0 points or larger in the value added composition ratio include textiles/apparel/leather (8.4 points) and sugar/sugar products (3.4 points), both of which made headway in both import substitution and export orientation. The particularly remarkable drop in the value added composition ratio was registered by transport equipment (16.3 points), a sector that showed progress in
import substitution at last in 1980. This can be caused as indicating that domestic production of auto parts under the government’s policy announced in 1976 did not go as smoothly as expected, though production by the auto assembly industry increased under the policy for domestic production of automobiles announced in 1969. Actually, unit production of automobiles increased during this period, while imports of finished vehicles decreased (Mihira and Sato ed. [1992:338]) despite the rise in the import ratio of transport equipment sector as shown in Table 2. This indicates that because of the lack of progress in import substitution in the auto parts industry, the increased assembly of automobiles led to higher imports of auto parts.
4. Era of Export Orientation and Selective Import Substitution
(1985-1990)
1. Historical Backdrop Symbolized by Successive Liberalization Packages on Trade and Investment
During this period, the Indonesian economy began to feel the impact of the rapid increase in foreign direct investment from Japan and Asia’s newly industrializing economies (NIEs), triggered by the devaluation of the rupiah in 1986 and the Plaza Accord of 1985, and the private sector and exports became the main engine of the development of the manufacturing sector for the first time ever. During the period, the government unleashed a string of liberalization packages on trade and investment, including the relaxation of restrictions on foreign investment, tariff cuts and the abolition of non-tariff trade barriers such as import restrictions. Companies designated as export-oriented firms on the basis of the export ratios of products, were accorded preferential treatment in the equity ratio of foreign capital, operations in bonded export processing zones and procurement of raw materials. The government also restored the drawback system, under which import tariffs imposed on raw materials and parts are refunded when finished products are exported.
and 1990. First, as for the input-output table of Indonesia this paper refers to quite often, the table from 1971 to 1985 uses industry codes different from those adopted for the 1990 table onward16. The second point is that some processes previously classified as the primary industry, such as husking of beans, were moved to the category of the secondary industry, beginning with the 1990 table17. Because of this change, the composition ratios for the value added, imports of manufactured goods and exports of manufactured goods for respective manufacturing sectors cannot be compared with the composition ratios for the previous period without bias, because some processing industries, previously classified in the primary industry, were added. Simple comparison of the export and/or import ratios between the pre-change tables and the post-change tables could also be misleading because the newly added primary processing sectors may show the export and/or import ratios that are different from the export and/or import ratios of the previous period. Thus, the analysis in this section
16 Specifically, the classification of sector code 2 signified hand-pounded rice in the 1971 table up
to the 1985 table, but was used to mean beans in the 1990 table onward. Hand-pounded rice was classified into milled rice with the sector code 29 from 1990 onward, while beans was classified in other food crops with the sector code 6 in tables before 1985. In the input-output table covering a total of 66 sectors, sector codes 1 to 26 are assigned to the primary industry, codes 27 to 50 to manufacturing, codes 51 to 66 to the tertiary industry, which includes construction, electricity/gas/water, and transportation/communications.
17
In the changes from the 1985 table to the 1990 table, the process to peel potatoes and the process to obtain starch from sago were reclassified from sector code 4 for potatoes to sector code 30 for flour/flour products, and the process of husking of beans, such as soybeans and peanuts, was reclassified from code 6 for other food crops to code 32 for other food products. Similarly, the process to make brown sugar from sugar canes was moved from code 8 to code 31 for sugar/sugar products, and the process to express oil and fat from coconuts with code 9, and of oil palm with code 10, the process to express oil and fat from oil palm and plants and animals were reclassified into oil and fat with code 28. The process to process leaf tobacco with code 11 was moved to cigarettes with code 34, while coffee beans with code 12, the process to husk beans with code 17 for other plants, and the process to boil tea leaves with code 13 were all classified into other food products with code 32. The process to produce kapok for wad of cotton with code 17 for other plants was reclassified into yarn spun with code 35. It requires attention that in the 1995 table as well, meat packing and other sectors classified as manufacturing in the annual industrial statistics of large and medium companies are classified as the primary industry, while production of natural
excludes the seven sectors of oil and fat, milled rice, flour/flour products, sugar/sugar products. Other food products, cigarettes and yarn spun.
2. Export Ratios Higher in Most Sectors, Led by Light Industries
Table 5 shows the value added composition ratio, the import composition ratio, the export composition ratio, the import ratio, the export ratio, the ratio of import tariffs and import sales taxes, and the import dependence of intermediate input for 17 sectors, or a total of 24 sectors minus the above-mentioned seven sectors, for 1985 and 1990.
First, the export ratio is examined, because the period under review is defined as the era of industrialization for export orientation. The table shows all the sectors but non-ferrous basic metal raised the export ratio. There are five sectors with the two-digit increases in the export ratio between 1985 and 1999: processed/preserved food (45.7 points), other manufacturing (30.5 points), textiles/apparel/leather (23.7 points), bamboo/wood/rattan products (19.6 points), and non-metallic mineral products (12.1 points). The number is higher, albeit by only one, than the four sectors, out of the total of 24 sectors, which showed the two-digit or larger increases in the export ratio between 1971 and 1985. As for changes in the export composition ratio, the remarkable growth was recorded by textile/leather goods (12.2 points), bamboo/wood/rattan products (7.5 points), and processed/preserved food (4.4 points). Therefore, the three sectors of textile/leather goods, bamboo/wood/rattan products and processed/preserved food can be characterized as the manufacturing sectors that posted the largest growth in the era of export-oriented industrialization. On the other hand, among sectors that posted the declines in the export composition ratio are refined petroleum (24.9 points) and non-ferrous basic metal (3.6 points). Taking all these changes together, the export-oriented industrialization in the era under review can be characterized by the general trend of lessening dependence on oil and gas production and shift of emphasis from heavy industries to light industries.
gas is classified into the sector of refined petroleum in the secondary industry.
Table 5.Structural Change in Manufacturing Industries from 1985 to 1990
Composition (%) Import Ratio Export Ratio Import- Dependence Value-added Import Export (%) (%) related Tax(%) on Import(%) 1985 1990 1985 1990 1985 1990 1985 1990 1985 1990 1985 1990 1985 1990 Processed/Preserved Food 1.1 2.0 0.9 0.6 0.1 4.5 13.3 13.6 1.7 47.4 10.6 4.4 5.5 4.7 Beverages 1.0 0.9 0.1 0.1 0.0 0.2 2.4 7.9 1.1 11.0 8.9 3.0 7.2 1.9 Textiles/Apparel/Leather 7.5 10.8 1.0 3.3 6.8 19.0 4.8 16.6 22.1 45.8 11.6 15.2 12.1 19.4 Bamboo/Wood/Rattan Products 8.7 13.7 0.0 0.1 12.3 19.8 0.2 1.0 38.4 58.0 16.3 3.6 1.6 3.4 Paper/Paper Products/Cardboard 3.0 5.4 2.7 2.0 0.3 1.3 23.4 15.4 2.3 7.7 8.6 17.7 39.7 19.7 Fertilizer/Pesticide 3.5 2.2 1.1 0.7 1.0 1.4 9.0 11.0 7.1 16.2 2.4 2.1 42.4 45.3 Chemicals 4.9 6.2 20.4 18.1 2.0 2.4 56.2 56.0 9.7 11.3 5.7 3.6 54.6 40.2 Refined Petroleum 37.1 24.4 4.7 3.9 59.1 34.2 7.6 12.4 45.2 47.5 1.6 2.4 16.2 18.9 Rubber/Plastic Wares 5.0 4.3 1.0 1.3 8.8 7.4 7.3 13.9 35.9 39.9 11.9 7.3 36.3 33.5 Non-metallic Mineral Products 3.5 2.5 2.1 2.5 0.1 0.8 20.8 38.0 1.0 13.1 4.1 8.7 17.7 19.9
Cement 1.9 1.1 0.0 0.0 0.2 0.5 0.7 0.3 2.2 11.2 9.7 2.3 10.4 3.8 Basic Iron/Steel 3.4 4.4 5.7 5.0 0.4 1.3 40.4 36.5 3.6 9.9 4.5 8.9 31.0 26.0
Non-ferrous Basic Metal 2.8 2.0 2.3 2.0 7.1 3.5 43.9 43.2 67.1 49.1 8.1 2.6 30.9 38.5 Fabricated Metal Products 3.4 3.6 7.6 5.0 0.1 0.7 38.8 33.2 0.4 5.8 7.1 36.5 38.9 29.3 Machine/Electrical machinery/Apparatus 6.2 8.3 31.6 38.8 1.2 1.3 56.5 64.3 4.3 4.7 9.8 4.4 69.1 66.6 Transport Equipment 6.0 7.5 16.2 13.6 0.0 0.8 42.1 42.9 0.2 3.6 5.4 11.2 54.2 49.2 Other Manufactured Products 0.9 0.8 2.6 2.9 0.4 0.9 50.0 66.3 11.1 41.6 8.1 20.1 32.6 25.4 Total Manufacturing Industries 100.0 100.0 100.0 100.0 100.0 100.0 29.7 37.4 26.0 31.2 7.1 8.1 4.6 8.6
(1) In this analysis, sectors of oil/fat, milled rice, flour/flour products, sugar/sugar products, other food products, cigarettes and yarn spun are excluded.
(2) The import ratio is obtained by dividing imports of goods by domestic demand (intermediate demand + private consumption + government consumption + inventory change).
(3) The export ratio is obtained by dividing exports of goods by total production.
(4) The ratio of import tariffs and import sales taxes is obtained by dividing the combined total of import tariffs and import sales taxes by the value of imports of goods.
(Source) As same as Table 1.
3. Import Substitution Limited to Materials Sectors
(1) Hikes in Import Tariffs and Import Sales Taxes Particularly in Raw Material Sectors
The period from 1985 to 1990 is generally regarded as the era of trade liberalization, perhaps partly because of the successive liberalization packages on trade and investment announced by the government. However, the ratio of import tariffs and import sales taxes for the manufacturing sector, which recognizably dropped until 1985, rose slightly in 1990 for eight sectors out of the 17 sectors under review. The overall