INTRODUCTION
The changes of biomaterial and biomechanical properties of bone during development and aging affect bone strength. Bone strength is determined by both bone quantity and quality. Bone quantity, including bone mineral density (BMD) and bone
mineral content (BMC), accounts for approximately 75-80% of the variance in bone strength (1). Bone quality is assessed by the architecture, turnover, damage of accumulation (e.g., microfractures), and mineralization of bone (2). The three-dimensional trabecular microarchitecture by micro-computed to-mography (μCT) is one of the determinants of bone strength, apart from the BMD or BMC. Principally, μCT is principally applicable in vitro (3, 4). Fourier transform infrared (FTIR) spectroscopy allows us to examine the molecular structure and conformation of biological macromolecules because it measures the absorption energy which produces an increase
ORIGINAL
Mineral to matrix ratio determines biomaterial and
biome-chanical properties of rat femur -application of Fourier
transform infrared
spectroscopy-Shinjiro Takata
1), Hiroshi Yonezu
2), Akira Shibata
3), Tetsuya Enishi
1), Nori Sato
1),
Mitsuhiko Takahashi
4), Shigetaka Nakao
1), Koji Komatsu
1), and Natsuo Yasui
1,4) 1)Division of Rehabilitation, Tokushima University Hospital, Tokushima, Japan ;2)
Department of Ortho-pedic Surgery, Mitoyo General Hospital, Kagawa, Japan ;3)
Faculty of Pharmaceutical Science, Yasuda Women’s University, Hiroshima, Japan ; and4)
Department of Orthopedics, Institute of Health Bi-osciences, the University of Tokushima Graduate School, Tokushima, Japan
Abstract : We studied the changes of biomaterial and biomechanical properties of the rat femur during development. Thirty male Wistar rats were allocated to 6 groups : aged 6 weeks (n=5), 9 weeks (n=5), 12 weeks (n=5), 15 weeks (n=5), 24 weeks (n=5), and 36 weeks (n=5). The mineral to matrix ratio (M/M ratio) of rat femur by Fourier transform infra-red spectroscopy was 0.97 0.10 at the age of 6 weeks, and reached the maximum of 1.52 0.17 at the age of 36 weeks. Total bone mineral density (BMD) by peripheral quantitative computed tomography of the femoral shaft aged 6 weeks was 479.1 58.7 mg/cm3, and reached the maximum of 1022.2 42.3 mg/cm3at the age of 36 weeks. The ultimate load to failure of the femur of the rat aged 6 weeks by the three-point bending test was 29.6 6.1 N. At the age of 36 weeks, the ultimate load to failure of the rat femur increased to the maxi-mum of 283.5 14.7 N. The results showed that the M/M ratio increased with development as total BMD and bone strength increased. The results suggest that the M/M ratio is one of the determinants of the biomaterial and biomechanical properties of bone. J. Med. Invest. 58 : 197-202, August, 2011
Keywords : Fourier transform infrared spectroscopy, bone quality, peripheral quantitative computed tomography,
three-point bending test
Received for publication May 17, 2011 ; accepted June 7, 2011. Address correspondence and reprint requests to Shinjiro Takata, MD, PhD, Division of Rehabilitation, Tokushima University Hos-pital, 2 - 50 - 1, Kuramoto - cho, Tokushima 770 - 8503, Japan and Fax : + 81 - 88 - 633 - 0178.
in the vibrational or rotational energy of atoms or groups of atoms within the molecule (4). Evaluation of bone mineralization is calculated the mineral to matrix ration (M/M ratio) by FTIR (5-12). Biome-chanical parameters of bone were made with three-point bending test according to the meth od of Molster et al. (13). Stiffness and ultimate load to fail-ure of bone by three-point bending test were deter-mined from a load-deflection curve (5).
The purpose of this study was to show changes in the M/M ratio of rat femur during development using FTIR spectroscopy. The results showed that the M/M ratio is an important determinant of the biomaterial and biomechanical properties of bone.
MATERIALS AND METHODS
Experimental Animals
All experimental procedures were approved by the local animal protection and ethics committee.
Thirty male growing Wistar rats were allocated to 6 groups : aged 6 weeks (n=5), 9 weeks (n=5), 12 weeks (n=5), 15 weeks (n=5), 24 weeks (n=5), and 36 weeks (n=5). The rats were euthanized by intrap-eritoneal injection of an overdose of sodium pento-barbital. Bilateral femora were removed to perform FTIR spectroscopy, peripheral quantitative com-puted tomography (pQCT), and the three-point bending test.
BIOMATERIAL PROPERTIES
1. Fourier Transform Infrared (FTIR) Spectroscopy
Femora were excised and the soft tissue, pe-riosteum, and bone marrow were immediately re-moved. The midshaft of the diaphysis was frozen in liquid nitrogen and lyophilized for 48 hours to remove all water and then ground in liquid nitro-gen. Infrared spectra were recorded by an FTIR spectrometer (FTIR-1720 ; Perkin-Elmer, Norwalk, USA) equipped with a triglycine sulfate detector with KBr windows. The samples were examined by the KBr technique (4).
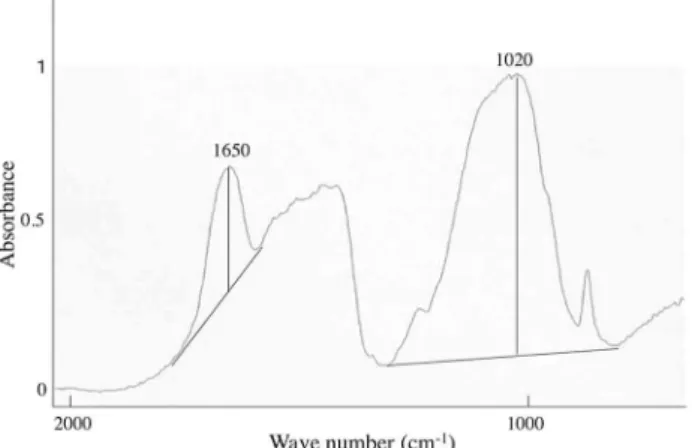
A typical FTIR spectrum of the rat femur is shown in Figure 1. Peak positions near 1020 cm-1and 1650
cm-1were assigned to the phosphate stretching
vi-bration of apatites and the amide I stretching vibra-tion of the bone organic matrix, respectively (5). The spectral resolution was 4 cm-1. The abscissa
range was 900-1800 cm-1, covering the phosphate
band and the amide 1 band. Data were Fourier transformed and averaged after 50 scans. The min-eral/matrix ratio was calculated from the ratio of the absorbance of the phosphate band at 1020 cm-1
to the amide I band at 1650 cm-1.
2. Peripheral Quantitative Computed Tomography (pQCT)
Bone mineral density (BMD), bone mineral con-tent (BMC), bone area, periosteal and endosteal cir-cumferences were measured by pQCT (XCT-960A ; Norland/Stratec, Fort Atkinson/Pforzheim, USA/ Germany). Measurements were taken using 1-mm-thick slices from the middle of the femoral shaft (diaphysis). Total BMD, cortical BMD, cacellous BMD, total BMC, cortical BMC, and cancellous BMC were measured.
Measurements of Bone Strength (Three-Point Bend-ing Test)
The rat femurs were subjected to the three-point bending test. Measurements were conducted with a bone strength tester (Model MZ-500S ; Marto, Tokyo, Japan) according to the method of Molster
et al. (13). Each femur was positioned with the
flexor surface side up on the top of two metal sup-ports located at a distance of 13 mm in the tester, and the bending force was applied midway at the rate of 10 mm/min until fracture occurred. Bone strength was determined from a load-deflection curve.
Figure 1. Fourier transform infrared spectroscopy (FTIR) spec-tra of rat femur.
Peak positions near 1020 cm-1and 1650 cm-1were assigned to
the phosphate stretching vibration of apatites and the amide I stretching vibration of the bone organic matrix. The mineral to matrix ratio (M/M ratio) was calculated from the ratio of the absorbance of the phosphate band at 1020 cm-1to the amide I
STATISTICS
Results were expressed as the mean!standard deviation (S.D.). One - way analysis of variance (ANOVA) was used to evaluate the significance of differences among the four groups. When ANOVA indicated significant differences among the six groups, the differences were evaluated using Fisher’s protected least significant difference (PLSD). Cor-relations of M/M ratio with other biomechanical pa-rameters including total BMD, periosteal and en-dosteal circumferences of femoral shaft, ultimate load to failure, and stiffness were assessed using lin-ear regression analysis. A p!0.05 value was con-sidered significant.
RESULTS
Mineral/Matrix Ratio (M/M ratio) (Fig. 2)
The M/M ratio of rat femurs increased with de-velopment, being 0.97!0.10 at the age of 6 weeks and rising to the maximum of 1.52!0.17 at 36 weeks.
The M/M ratio exceeded 1.0 between the ages of 6 and 9 weeks, indicating that the relative amount of minerals exceeds that of matrix content. The in-crease rate of the M/M ratio was greatest between the ages of 6 and 9 weeks.
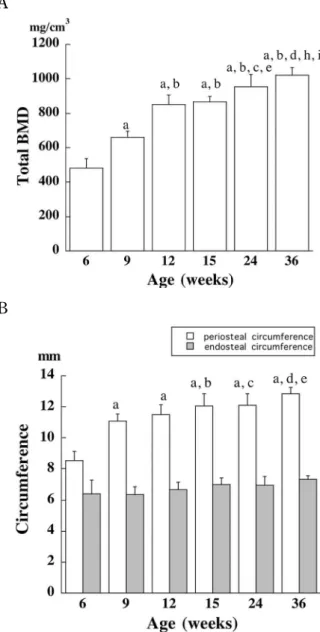
Bone mineral density (BMD), periosteal and en-dosteal circumferences (Fig. 3A-C)
The total BMD consists of cortical and cancel-lous BMD. The total BMD of the femoral shaft of
Figure 2. Mineral to matrix ratio (M/M ratio) of rat femur. M/M ratio of rat femur increased with development. M/M ratio exceeded 1.0 between the ages of 6 and 9 weeks. The increase rate of the M/M ratio between the ages of 6 and 9 weeks was greatest of all ages.
aP = 0.0235 vs. 6 - week group, bP = 0.0010 vs. 6 - week group, cP! 0.0001 vs. 6 - week group, dP = 0.0107 vs. 9 - week group, eP = 0.0004 vs. 9 - week group, fP!0.0001 vs. 9-week group, gP= 0.0232 vs. 12 - week group, hP = 0.0004 vs. 12 - week group, iP = 0.0071 vs. 15 - week group
A A
B B
Figure 3A, B. BMD, periosteal and endosteal circumferences. Total BMD of rat femoral shaft increased during development and reached the maximum at the age of 36 weeks (A). Total BMD consists of cortical and cancellous BMD. Total BMD of the femoral shaft increased with development. The increase rate of total BMD was greatest between the ages of 6 and 9 weeks. aP!0.0001 vs. 6-week group, bP!0.0001 vs. 9-week group, cP= 0.0030 vs. 12 - week group, dP!0.0001 vs. 12-week group, eP= 0.0110 vs. 15 - week group, hP!0.0001 vs. 15-week group, iP= 0.0496 vs. 24 - week group
Periosteal circumference of femoral shaft increased during de-velopment, whereas there were no significant differences in en-dosteal circumference during development (B).
Both periosteal and endosteal circumferences increased with de-velopment. The increase rate of periosteal circumference was greatest at between 6 and 9 weeks of age.
aP!0.0001 vs. 6-week group, bP=0.0200 vs. 9-week group, cP= 0.0166 vs. 9 - week group, dP = 0.0001 vs. 9 - week group, eP = 0.0022 vs. 12 - week group
the rat aged 6 weeks was 479.1!58.7 mg/cm3, and
increased from 3 to 36 weeks (Fig. 3A). At the age of 36 weeks, this value reached to the maximum of 1022.2!42.3 mg/cm3. The increase rate of total
BMD was greatest between the ages of 6 and 9 weeks.
The periosteal circumference of the femoral shaft increased with development (Fig. 3B). This value at the age of 6 weeks was 8.6!0.6 mm. At the age of 36 weeks, this value rose to the maximum of 12.9!0.4 mm. The increase rate of the periosteal circumference was greatest between 6 and 9 weeks of age. The increase rate of the periosteal circum-ference of the femoral shaft was greatest between the ages of 6 and 9 weeks. The endosteal circum-ference of the femoral shaft also increased with de-velopment, being 6.4!0.8 at the age of 6 weeks and increasing to the maximum of 7.3!0.2 mm at the age of 36 weeks.
Bone strength and stiffness by three-point bending test (Fig. 4)
Bone strength, the ultimate load to failure of the femoral shaft of rats increased with development
(Fig. 4A). The bone strength of the femur of a rat aged 6 weeks was 29.6!6.1 N, which increased to the maximum of 283.5!14.7 N at the age of 36 weeks. The increase rate of bone strength was greatest between the ages of 6 and 9 weeks.
The stiffness of the rat femur increased with de-velopment (Fig. 4B), being 44.6!7.9 N/mm at the age of 6 weeks and reaching the maximum of 509.2!59.0 N/mm at the age of 36 weeks. The in-crease rate of stiffness was greatest between the ages of 6 and 9 weeks.
Femoral length and body weight (Fig. 5A, B)
The femoral length in rats aged 6 weeks was 27.4!0.7 mm (Fig. 5A), reaching 43.6!1.0 mm at the age of 36 weeks. The increase rate of the femo-ral length was greatest between the ages of 6 and 9 weeks.
The body weight of rats aged 6 weeks was 159.0! 4.2 g (Fig. 5B), increased with development and reached the maximum of 598.0!153.5 g at the age of 36 weeks. The increase rate of body weight was greatest between the ages of 6 and 9 weeks.
A
A BB
Figure 4A, B. Bone strength by three - point bending test.
Ultimate load to failure of femoral shaft of rat increased with development (A). The ultimate load to failure of femoral shaft increased during development. These increase rates of bone strength and stiffness were greatest between the ages of 6 and 9 weeks.
aP = 0.0005 vs. 6 - week group, bP!0.0001 vs. 6-week group, cP=0.0008 vs. 9-week group, dP!0.0001 vs. 9-week group, eP=0.0390 vs. 12 - week group, fP!0.0001 vs 12-week group, gP=0.0004 vs. 15-week group, hP!0.0001 vs. 15-week group, iP=0.0069 vs. 24-week group
Stiffness of femoral shaft of rat increased with development (B). The stiffness of the rat femur increased during development. These increase rates of bone strength and stiffness were greatest between the ages of 6 and 9 weeks.
aP = 0.0072 vs. 6 - week group, bP = 0.0001 vs. 6 - week group, cP!0.0001 vs. 6-week group, dP=0.0212 vs. 9-week group, eP!0.0001 vs. 9 - week group, fP!0.0001 vs. 12-week group, gP!0.0001 vs. 15-week group
Correlations of M/M ratio with other biomechanical parameters.
There are significant positive correlations between M/M ratio and other parameters including total
BMD (r=0.8127, p!0.0001), periosteal circumfer-ence (r=0.7441, p!0.0001), endosteal circumfer-ence (r=0.6667, p=0.0002), ultimate load to failure (r=0.7957, p!0.0001), and stiffness of rat femur (r= 0.8150, p!0.0001).
DISCUSSION
The M/M ratio by FTIR spectroscopy increases in proportion with development as total BMD, and bone strength increases. The M/M ratio indicates the relative amount of minerals and matrix con-tents and bone mineralization (6). The strength of the femoral shaft depends on the cortical bone, because the diaphyses of long bones are formed mostly by cortical tissue (14, 15). Increased miner-alization of the diaphysis causes an increase in bone strength with development. In addition, there are significant positive correlations between M/M ra-tio and other parameters including total BMD, pe-riosteal and endosteal circumferences, ultimate load to failure, and stiffness of rat femur. Based on these facts, the M/M ratio determines the biomaterial and biomechanical properties of bone.
Interestingly, the rates of increases of the M/M ratio, total BMD, and bone strength, femoral length of the rat femur, and body weight were greatest between 6 and 9 months of age, indicating that mineralization shown as the M/M ratio of the rat femur highly accelerated at this age. In addition, the M/M ratio of the rat femur by FTIR spectros-copy exceeded 1.0 between the ages of 6 and 9 weeks, showing that between these ages, the rela-tive mineral content exceeded that of matrix con-tent.
Both periosteal and endosteal circumferences of the femoral shaft of rats increased during develop-ment, indicating that both inner and outer diame-ters increased during development. The increase of periosteal circumference of the femoral shaft indi-cates acceleration of periosteal bone formation by osteoblasts compared with bone resorption by os-teoclasts. In contrast, the increased endosteal cir-cumference indicates acceleration of endosteal bone resorption by osteoclasts compared with bone for-mation by osteoblasts. The width of the cortical bone of the femoral shaft increases with develop-ment, indicating that periosteal bone formation over-whelms endosteal bone resorption of the rat femur. In conclusion, the M/M ratio increases in propor-tion with development as bone quantity and bone A
A
B B
Figure 5A, B. Femoral length and body weight.
Femoral length (A). The femoral length of rats and body weight increased during development. The increase rate of the femoral length was greatest between the ages of 6 and 9 weeks. aP!0.0001 vs. 6-week group, bP!0.0001 vs. 9-week group, cP= 0.0307 vs. 12 - week group, dP = 0.0001 vs. 12 - week group, eP! 0.0001 vs. 12 - week group, fP = 0.0002 vs. 15 - week group, gP = 0.0424 vs. 24 - week group
Body weight (B). The body weight of rats increased during de-velopment. The increase rate of body weight was greatest be-tween the ages of 6 and 9 weeks.
The increase rate of body weight was the greatest between the ages of 6 and 9 weeks (B).
aP!0.0001 vs. 6-week group, bP=0.0090 vs. 9-week group, cP= 0.0001 vs. 9 - week group, dP!0.0001 vs. 9-week group, eP= 0.0017 vs. 12 - week group, fP = 0.0007 vs. 12 - week group, gP = 0.0429 vs. 15 - week group
strength increase. Based on this finding, the M/M ratio is one of the determinants of the biomaterial and biomechanical properties of bone.
REFERENCES
1. Smith CB, Smith DA : Relationship between age, mineral density and mechanical proper-ties of human femoral compacta. Acta Orthop Scand 47 : 496-502, 1976
2. Osteoporosis prevention, diagnosis, and ther-apy. NIH Consensus Development Panel on Osteoporosis Prevention, Diagnosis, and Ther-apy. JAMA 285 : 785-795, 2001
3. Ito M, Nishida A, Nakamura T, Uetani M, Hayashi K : Differences of three-dimensional trabecular microstructure in osteopenic rat models caused by ovariectomy and neurec-tomy. Bone 30 : 594-598, 2002
4. Guo XE, Kim CH : Mechanical consequence of trabecular bone loss and its treatment : A three-dimensional model simulation. Bone 30 : 404-411, 2002
5. Yonezu H, Ikata T, Takata S, Shibata A : Effects of sciatic neurectomy on the femur in growing rats : Application of peripheral quantitative com-puted tomography and Fourier transform in-frared spectroscopy. J Bone Miner Metab 17 : 259-265, 1999
6. Paschalis EP, Dicarlo E, Betts F, Shermann P, Mendelsohn R, Boskey AL : FTIR microspec-troscopic analysis of human osteonal bone. Cal-cif Tissue Int 59 : 480-487, 1996
7. Takata S, Shibata A, Yonezu H, Yamada T, Takahashi M, Abbaspour A, Yasui N : Bio-physic evaluation of bone quality-Application
of Fourier transform infrared spectroscopy and solid-state nuclear magnetic resonance spec-troscopy-. J Med Invest 51 : 133-138, 2004 8. Yang X, Ricciardi BF, Hernandez-Soria A, Shi
Y, Pleshko Camacho N, Bostrom MP : Callus mineralization and maturation are delayed dur-ing fracture healdur-ing in interleukin-6 knockout mice. Bone 41 : 928-936, 2007
9. Weiss P, Bohic S, Lapkowski M, Daculsi G : Application of FT-IR microspectroscopy to the study of an injectable composite for bone and dental surgery. J Biomed Mater Res 41 : 167-70, 1998
10. Boskey AL, Spevak L, Weinstein RS : Spectro-scopic markers of bone quality in alendronate-treated postmenopausal women. Osteoporos Int 20 : 793-800, 2009
11. Kuhn LT, Grynpas MD, Rey CC, Wu Y, Ackerman JL, Glimcher MJ : A comparison of the physical and chemical differences between cancellous and cortical bovine bone mineral at two ages. Calcif Tissue Int 83 : 146-154, 2008 12. Paschalis EP, Mendelsohn R, Boskey AL : In-frared assessment of bone quality : a review. Clin Orthop Relat Res : 2011 Jan 6. [Epub ahead of print]
13. Molster AO : Biomechanical effects of intrame-dullary reaming and nailing on intact femora in rats. Clin Orthop 202 : 278-285, 1986 14. Carter DR, Heys WC : The compressive
behav-ior of bone as a two-phase porous structure. J Bone Joint Surg 59A : 954-962, 1977
15. Augat P, Reeb H, Claes LE : Prediction of frac-ture load at different skeletal sites by geomet-ric properties of the cortical shell. J Bone Miner Res 11 : 1356-1363, 1996