INTRODUCTION
Since the original description by Norum and Gjone
in 1967 (1), only 14 families with hereditary leci-thin : cholesterol acyltrasferase (LCAT) deficiency have been reported in Japan. This rare disease is
ORIGINAL
Alterations in erythrocyte membrane lipid and its fragility in
a patient with familial lecithin : cholesterol acyltrasferase
(LCAT) deficiency
Takeo Suda
1, Akira Akamatsu
2, Yutaka Nakaya
1, Yasunobu Masuda
3and
Junzo Desaki
4 1Department of Nutrition, The University of Tokushima School of Medicine, Tokushima, Japan ;2
Depart-ment of Internal Medicine, The Matsuyama Prefecture Hospital, Ehime, Japan ;3
R & D Division of Q.P. Co., Fuchu-Shi, Tokyo, Japan ; and4
Department of Anatomy, The Ehime University School of Medi-cine, Ehime, Japan
Abstract : Lecithin : cholesterol acyltrasferase (LCAT) plays a key role in the cholesterol metabolism-mediated esterification of free cholesterol into the cholesterol ester in normal plasma. Familial LCAT deficiency is frequently associated with anemia. Using biochemical and physiological techniques, the erythrocytes of this patient were investigated to gain an insight into the relationship between the abnormalities of lipid metabolism and erythro-cyte membrane fragility. Abnormal erythroerythro-cytes, so-called Target cells and/or Knizoerythro-cytes, were observed at 20% in our patient’s erythrocytes. Moreover, the mean corpuscular vol-ume of the patient’s cells was 7% greater than that of a normal individual. In the membrane lipids of the patient’s erythrocytes, cholesterol and phosphatidylcholine increased, and phosphatidylethanolamine decreased. The electron spin resonance technique with a fatty acid spin probe showed that the membrane fluidity was more elevated than that of normal cells in spite of the increase in cholesterol content and the cholesterol/ phospholipid ratio of the membrane of patient’s erythrocytes. The patient’s abnormally shaped erythrocytes were less deformed than those of the normal individual under high shear stress. The par-tial depletion of membrane cholesterol from the patient’s erythrocytes was demonstrated by incubation with normal plasma with LCAT activity. The increment of transformed eryth-rocytes during the incubation could be prevented by cholesterol depletion from the patient’s erythrocyte membrane. These findings indicate that normochromic anemia of the patient might be caused by erythrocyte fragility resulting from decreased deformity and/or abnor-mal shape of the cells due to abnorabnor-mal lipid composition in the membrane.
J. Med. Invest. 49 : 147-155, 2002
Keywords : familial lecithin : cholesterol acyltrasferase deficiency, cholesterol, osmotic fragility, membrane
flu-idity, erythrocyte deformability.
Abbreviations : LCAT ; lecithin : cholesterol acyltrasferase, the CE/TC ratio ; the cholesterol ester/total cholesterol ratio, the C/P ratio ; the free cholesterol/total phospholipids ratio, HDL ; high density lipoprotein, ESR ; electron spin resonance, I(5.10) : a stearic acid analogue of spin probe
Received for publication July 18, 2002 ; accepted July 31, 2002.
Address correspondence and reprint requests to Yutaka Nakaya, M.D., Department of Nutrition, The University of Tokushima School of Medicine, Kuramoto-cho, Tokushima 770-8503, Japan and Fax : +81-88-633-7113.
The Journal of Medical Investigation Vol. 49 2002
manifested by moderate anemia, proteinuria and corneal opacity (2-5). The proportion of cholesterol esters in the total plasma cholesterol is invariably depressed, although total cholesterol concentration may either be depressed or elevated. It is also known that cholesterol accumulates in a limited number of organs in patients with genetic or secondary LCAT deficiencies (6, 7), and erythrocytes are one of the primary organs where such cholesterol accumula-tion takes place.
LCAT specifically converts free cholesterol and phosphatidylcholine into cholesterol esters and lysophosphatidylcholine, respectively (8). Further-more, this conversion is an irreversible reaction in plasma as follows : membrane free cholesterol ← - - → plasma free cholesterol - - → plasma cholesterol es-ter. Hence its deficiency impairs the transport of cholesterol from extrahepatic tissues to the liver via plasma cholesterol esters. The resulting changes of membrane lipids and/or erythrocyte shape are then presumed to be responsible for the instability of the patient’s erythrocytes with mechanical strain in cir-culation. In this report, we examined a typical case of this disease emphasizing the role of membrane lipids in the physical properties of the erythrocytes. Contrary to the above presumption, the patient’s erythrocytes exhibited decreased osmotic fragility, and increased membrane fluidity and visco-elasticity despite the fact that the majority of the cells were transformed, presumably owing to the abnormal intramembrane distribution of lipid components as a result of the lipid equilibrium.
Case presentation :
A 31-year-old woman exhibited the typical symptoms of LCAT deficiency, such as anemia, proteinuria and corneal opacity, but showed no liver or renal dys-functions. She had been well until her visit and her family history is summarized in Fig. 1. Hematocrit was 32.7 percent ; red-cell count 3.29×10⁶per cubic
millimeter, white-cell count 8,100 per cubic millimeter, and platelet count 200,000 per cubic millimeter. The blood levels of total cholesterol was 96 mg/dL, tri-glyceride 204 mg/dL, HDL-choesterol 13 mg/dL, to-tal bilirubin 1.7 mg/dL, toto-tal protein 7.7 g/dL, aspartate aminotransferase 20 IU, alanine aminotransferase 26 IU, alkaline phosphatase 191 IU and creatine kinase 111 IU. LCAT activity was 30% of the control. In-formed consent was obtained from the patient and her family.
Fresh blood was drawn by venipuncture into a heparinized tube, and erythrocytes were washed twice with an isotonic phosphate buffer containing 42.6 mM Na2HPO4, 7.2 mM NaHPO4. 5.1 mM KCl, 90.3
mM NaCl and 5.6 mM D-glucose, pH 7.4. The cells were kept at 4 ℃.
Lipid and protein analysis
Lipids were extracted from the plasma and eryth-rocyte membrane with 10 volumes of CHCl3-methanol
(2/1 by volume). Plasma cholesterol was measured by the colorimetric method, and that in the eryth-rocyte membrane was determined by gas chroma-tography as described previously (9, 10). Phospholipid compositions were analyzed by two dimensional thin layer chromatography with Silica-Gel H (Merk Co.
Fig. 1. Pedigree of familial LCAT defi-ciency. Arrow indicates proband. Circles denote female subjects ; squares denote male subjects. Arrows indicate proband, and diagonal lines indicate deceased sub-jects. At the top left of the symbols, the cause of death is indicated, i.e., C indicates cardiovascular disease , O other diseases, ? unknown cause. In the sym-bols, black represents subjects with typical LCAT deficiency (LCAT activity>39% of normal), black and white represents par-tial deficiency (LCAT activity 40-60% of normal), and white indicates unaffected subjects.*indicates patients who were not
studied.
T. Suda et al. erythrocyte membrane in LCAT deficiency
Whitehouse Station, NJ), which was developed with CHCl3-methanol-glacial acetic acid-water (25/15/4/2)
and CHCl3-methanol-28% ammonia-water (120/15/
4/2) as the first and second developing solvents, re-spectively. The fatty acids of the membrane phospholipids were analyzed by gas chromatography after being esterified with 10% HCl-methanol (Tokyo Kasei Co., Tokyo, Japan) Lecithin : cholesterol acyltransferase activity was determined using a commercial test kit (Daiichi Chemicals Co, Ltd Tokyo, Japan) (11). Scanning electron microscopy
Erythrocytes of the patient and a normal individ-ual (33-year-old man) were fixed with 1% glutaraldehyde and 1% OsO4, and successively dehydrated with
etha-nol. Then, the specimen was coated with Pt using an Ion Coater (Model IB-5, Eiko Engineering., Tokyo, Japan) and observed with a scanning electron micro-scope (Model S-500, Hitachi Co. Tokyo, Japan). Effect of membrane cholesterol depletion
In order to investigate the relationship between membrane cholesterol and the erythrocyte shapes of the patient, the cells were incubated with normal plasma with LCAT activity (12). The erythrocytes were diluted to 10% Ht, with plasma containing Peni-cillin G (1000 units/ml) as a sterile drug, and incu-bated for six hours at 37℃. After incubation, the test tubes were centrifuged to remove the plasma, and the lipids and hemoglobin were measured. Over six hours, no hemolysis could be detected by the cyanmethemoglobin method. Cells were washed
twice with isotonic buffer to analyze the membrane lipids and to observe the erythrocyte shapes. Membrane fluidity measurement
A stearic acid analogue of spin probe, 2-(10-carboxydecyl)-2-hexyl-4, 4’-dimethyl-3-oxazolidinyloxyl, was pur-chased from Syva Co. (Palo Alto. CA). The spin probe was incorporated into intact erythrocyte membranes by labeled albumin as described previously (8). The labeled cells were packed in a capillary tube, and electron spin resonance (ESR) spectra were recorded by a Varian E-3 spectrometer at various tempera-tures.
Measurement of erythrocyte deformability and osmo-tic fragility
The cells were suspended in isotonic buffer with 20% Dextran T-40 (Pharmacia Chemical Co., Peapack, NJ) and erythrocyte deformability was measured using a rheoscope at 24℃. The ratio of long to short axis lengths was measured as the deformation in-dex. To measure osmotic fragility, the continuous dilution method by Maeda et al . (13) was employed, and salt concentrations giving 50% hemolysis and a slope of 25% and 75% hemolysis were subsequent-ly measured.
RESULTS
Hematological examination :
The hematological results are shown in Table 1,
Table 1. Hematological examinations of whole blood
Normal Individual LCAT deficiency Red blood cells (×106/mm3)
Hematocrit (%) Hemoglobin (g/dL) Mean corpuscular volume
Mean corpuscular hemoglobin (pg)
Mean corpuscular hemoglobin concentration (%) Reticulocytes (%)
Platelet (×104/mm3)
White blood cells (×103/mm3)
Neutorphils Lymphocytes Monocytes Eosinophils Basophils Atypical lymphocytes 5.37 (4.98) 47.6 (45.5) 16.7 89 (91.5) 31.9 34.9 1.6 16.4 7.8 60.5 28.5 4.5 5.0 1.0 0.5 3.82 (3.80) 35.7 (38.0) 12.2 94 (100) 31.8 33.8 4.3 18.2 7.3 73.6 19.5 3.5 3.0 0.5 not detectable Measurement by an Coulter Counter (Type A). Values by standard manual methods were given in paren-thesises.
in which the changes were mainly in erythrocytes. The mean corpuscular volume increased by 7%. The patient’s erythrocytes showed the typical figures of normochromic anemia associated with increased reticulocytes (4.3%). Moreover, the erythrocytes were heterogeneous in shape and about one-fifth of the cells were either so-called Target cells or Knizocytes (Fig. 2).
Comparison of plasma and erythrocyte membrane lipids :
The lipid composition of the patient’s plasma is listed in Table 2. Plasma CE concentration was marke-dly decreased in association with the decrease of
TC concentration. In our case, the CE/TC (choles-terol ester/total choles(choles-terol) ratio by weight was de-creased to 0.31, whereas the normal value was 0.73. Inversely, the cholesterol content in the erythrocyte membrane of the patient was increased by 140% com-pared with that of the normal individual (Table 3). Although the changes in phosphatidylchone and phosphatidylethanolamine concentrations in the plasma were small, the difference in plasma total phospholipid concentrations between the patient and the normal subject was maintained (Table 2). The erythrocyte mem-brane of the patient had increased phosphatidylchone, and decreased phosphatidylethanolamine (Table 3) in a type of equilibration of these phospholipids
be-Fig. 2. Schematic illustration of lipid equilibrium (upper panel) and the abnormal shapes of the lipid accumulated erythrocytes in the patient’s membrane (lower panel).
Upper panel ; Cholesterol level of the erythrocyte membrane was estimated by the number of erythrocytes in the blood and cho-lesterol per cell in the membrane. Dotted square indicates other compartments (such as cell membrane or lipoproteins). In a patient with LCAT, cholesterol ester in the plasma was decreased but cholesterol of the erythrocyte membrane increased.
Lower panel ; Left, control subject. Right, LCAT deficiency subject (#1). Abnormal erythrocytes (Target cells) are indicated by arrow heads. Note that the concavity of the cells was lost in Target cells. The white bar in the electron scanning microscope photographs indicated the scale of 5µm (Magnification×2800).
T. Suda et al. erythrocyte membrane in LCAT deficiency
tween the plasma and erythrocyte membrane in the patient’s blood. To obtain more quantitative figures, the phospholipid content in the membranes was calculated on the basis of moles of phospholipids per cell. The phosphatidylchone content per cell in the patient’s mem-brane was 158%, whereas the phosphatidylethanolamine content was 42% of that found in the membrane of the normal individual. However, sphingomyelin and phosphatidylserine in the patient’s membrane did not differ. Overall, the ratio of free cholesterol to to-tal phospholipids (C/P) was slightly increased in the erythrocyte membrane of the patient to maintain the lipid partition equilibrium.
Relationship of membrane cholesterol and cell shape : When normal plasma containing LCAT was added to the patient’s erythrocytes, the cholesterol content in the patient membrane decreased, 3.74×10⁻¹⁶moles
per cell associated with increase of cholesterol es-ter concentration in the normal plasma (Table 4). Namely, part of the membrane cholesterol of the
pa-tient’s erythrocytes moved to the plasma cholesterol ester via plasma free cholesterol by LCAT reaction. When authentic plasma or normal plasma with LCAT inhibitor (iodoacetoamide ; 1 mM) was added to the patient’s cells, no cholesterol movement from the mem-brane occurred. While transformed cells were 28.7% from the influence of long-term erythrocyte incuba-tion of the normal subject, the transformed cells in-creased from 19.9% to 49.5% in the patient with authen-tic plasma. This marked increment of abnormal trans-formation in the patient’s cells was held at 27.5% by incubation with normal plasma instead of that of the patient, which was similar to that of the normal sub-ject. This suggested that the prevention of abnormal transformation of the patient’s cells might attribute to partial depletion of the membrane cholesterol. Physical properties of the erythrocytes :
The patient’s erythrocyte exhibited marked osmot-ic resistance. NaCl concentrations at 50% hemolysis were 0.309±0.00 l% and 0.362±0.004% of NaCl
equiva-Table 2. Plasma lipid of the pateints and naormal individual
Normal individual LCAT deficiency Total cholesterol (TC ; mg/dL)
Free cholesterol (mg/dL) Cholesterol ester (CE ; mg/dL) CE/TC Phospholipids (mg/dL) Phospholipids composition (%) Lysophosphatidylcholine Posphatidyliositol+Phsophatidylserine Sphingomyelin Phosphatidylethanolamine Phosphatidylcholine 157 43 114 0.73 168 7.9±2.2 3.2±0.7 17.9±1.1 6.1±0.6 64.9±0.2 67 46 21 0.31 171 not detectable not detectable 16.3 1.1 82.6
Table 3. Erythrocytes membrane lipids of the patient and normal individual
Normal individual LCAT deficiency Cholesterol (C ;×10-16mol/cell)
Phospholipids (P :×10-16mol/cell) C/P ratio
Phospholipids composition (mol ; %) Lysophosphatidylcholine Posphatidyliositol Phsophatidylserine Sphingomyelin Phosphatidylethanolamine Phosphatidylcholine 3.01±0.08 3.66±0.12 0.82 0.8±0.7 (0.03) 2.8±0.6 (0.10) 11.8±0.6 (0.43) 30.3±2.1 (1.11) 21.5±2.6 (0.79) 32.7±0.2 (1.21) 4.24±0.21 4.28±0.11 0 1.5±0.3 (0.06) 2.5±0.9 (0.11) 9.3±0.5 (0.40) 26.0±1.8 (1.11) 9.1±1.7 (0.39) 51.6±1.6 (2.21) Values in the parenthesises were calculated from 3.66 and 4.28×10⁻¹⁶moles/cell, respectively.
lent in the patient’s and normal cells, respectively. However, the other parameters of osmotic resistance (H25 -75) were increased 1.75 fold in spite of the high C/P ratio of the membrane.
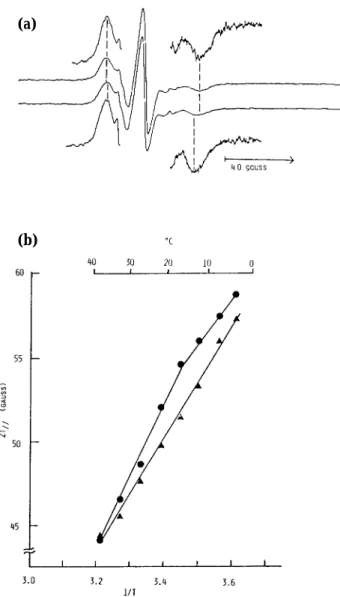
The erythrocyte membrane fluidity of the patient was assessed by ESR analysis using a lipid analogue. The erythrocyte membrane gave a small but nar-row overall splitting (2T//) between the outer ex-tremes of the ESR spectrum (Fig. 3). This difference was approximately two gausses at 17℃ (Fig. 3). When the temperature dependence of the splitting was examined, this difference was evident over the range 2℃ and to 39℃. Moreover, the discontinuity seen with a normal membrane at 22℃ singularly disap-peared in the patient’s membrane. The results sug-gested that the erythrocyte membrane with LCAT deficiency was more fluid in spite of its high cho-lesterol content.
In order to examine the functional properties of the patient’s erythrocytes, the deformability of the cells was measured (Fig. 4). The decreased deformability of the patient’s cells, which gave smaller values for deformation indices than normal cells, might reflect increased reticulocytes (4.3%) in the patient’s circu-lation (Table 1).
DISCUSSION
Increased phosphatidylchone and cholesterol, and
decreased phosphatidylethanolamine in the patient’s erythrocyte membrane (Table 3) are consistent with earlier reports of LCAT deficiency. In our case, the free cholesterol concentration in the plasma was maintained to the normal concentration though the cholesterol ester proportion was low due to LCAT deficiency (Table 2). Inversely, the membrane cho-lesterol (140%) and phospholipids (127%) in the pa-tient’s cells were increased in spite of a decrease of phosphatidylethanolamine (42%) as shown in Table 3. In order to investigate the relation between plasma and the membrane lipid of the patient, we estimated the total amount of free cholesterol (6 l mg/dl) in plasma and the erythrocytes in blood in circulation. As a result, this value was unchanged between the patient’s and normal blood. From the above calculation, it was suggested that an equilib-rium of cholesterol between the plasma and brane might exist and decline to the patient’s mem-brane accompanied with increased phospholipids and changes of the phospholipid compositions of the membrane. Thus, membrane cholesterol accumulated accompanied with changes of phosphatidylcholine and phosphatidylethanolamine levels in the membrane. Owing to abnormality in the membrane lipids, the patient’s erythrocytes also exhibited increased mean corpuscular volume, abnormal erythrocyte shapes, and anemia associated with increased reticulocytes. Concerning osmotic resistance in vitro, our previous report (9, 13) showed that the C/P ratio of the
mem-Table 4. Relationship of membrane cholesterol and erythrocyte shapes Erythrocyte Lipids Transformed Erythrocytesc) Plasma Lipids FCa) PLsa) C/Pb) FC/TCd) CE/TCd)
Normal subject’s erythrocytes 1) before incubation
2) incubation with normal plasma 3) incubation with patient plasma 4) incubation with normal plasma
and LCAT inhibitor
LCAT deficiency’s erythrocytes 1) before incubation
2) incubation with patient plasma 3) incubation with normal plasma 4) incubation with patient plasma
and LCAT inhibitor
3.15 2.79 3.21 3.22 4.15 4.22 3.74 4.23 3.80 3.87 3.77 3.76 4.33 4.33 4.32 4.38 0.83 0.72 0.85 0.86 0.96 0.97 0.91 0.97 3.4±0.4 28.7±6.1 25.6±8.7 echinocyte 19.5±10.0 49.5±11.2 27.5±9.1 echinocyte 33.5 29.3 67.6 33.7 70.6 69.1 28.9 70.2 66.5 70.7 32.4 66.3 29.4 30.9 71.1 29.8 a) All values were expressed as×10-16moles/cell.
b) All values were expressed as molar ratio. c) All values were expressed as % and mean±S.D.. d) All values were expressed as weight %.
T. Suda et al. erythrocyte membrane in LCAT deficiency
brane was one of the factors which increased the osmotic fragility. However, in this patient, another parameter of osmotic fragility, H25-75, was increased 1.7 fold compared with that of the normal subject. If the increased osmotic resistance was due to the increased C/P ratio of the membrane, the other pa-rameter would decrease followed by increased free cholesterol in the membrane (9, 13, 16). Thus, the change of osmotic fragility in the patient might sug-gest other factors such as the increased surface area of the membrane and/or mean corpuscular volume due to lipid abnormality in the membrane. It has been reported that erythrocytes with LCAT deficien-cy possess a short life-span in vivo. It had been ac-cepted that erythrocyte deformability was one of the
major factors in the destruction of circulation. We, as well as other investigators, reported previously that deformability, membrane fluidity and choleste-rol content are closely related : that is, increased cho-lesterol concentration in the erythrocyte membrane decreases deformability due to the decreased mem-brane fluidity of the cells (16). This patient’s cells, however, possessed decreased deformability in spite of elevated membrane fluidity. In 1997, Abugo et al . showed that geometric properties such as mean cor-puscular volume and excess surface area were re-lated to the deterioration of the red cell mechanical properties in capillary flow (17). In this case, the amount of membrane lipids (free cholesterol and total phosphpolipids) accumulated to 127% due to (a)
(b)
Fig. 3. (a) Electron spin resonance spectra of I (5, 10)-labeled erythrocytes.
(upper spectra) control, (lower spectra) LCAT deficien-cy subject.
(b) Temperature dependence of the overall splitting (gauss).
(●) control, (▲) LCAT deficiency subject
Fig. 4. Viscosity (upper panel) and deformability of erythrocytes (lower panel) under various shear rates. Viscosity and deformability of patient’s erythrocytes were decreased compared to those of a normal subject.
(●) control, (▲) LCAT deficient subject
the deterioration of lipid equilibrium. Therefore, the abnormal shape of the patient’s erythrocytes was related to the depletion of the partial free choleste-rol by LCAT from the patient’s membrane followed by decreased abnormal shapes in vitro in Table 4.
The total lipid amount of free cholesterol and phosphpolipids increased by 27% associated with the completely different phospholipid compositions. The increased phosphatidylchone (158%) and decreased phosphatidylethanolamine (42%) in the membrane might contribute to the increased fluidity of the pa-tient’s membrane in spite of the slight increase in C/P ratio.
Recently, Jain et al . (18) indicated that a patient’s erythrocytes were more unstable mechanically in hypotonic medium due to membrane fragmentation of the cells, and were more susceptible to peroxidant stress due to the increased membrane level of poly-unsaturated fatty acid. In our case, the fatty acid com-positions of phospholipids in the membrane did not change significantly (data not shown). On the other hand, Flamm K and Schacter D (19) showed that erythrocyte membranes with betalipoprotein deficiency and enriched membrane cholesterol decreased the fluidity of the outer but not the inner hemileaflet. It is interesting that erythrocyte membranes (acanthocytes) with betalipoprotein deficiency have increased cho-lesterol and phosphatidylethanolamine, but decreased phosphatidylchone, which is opposite to those changes in LCAT deficiency.
Concerning the asymmetric distribution of mem-brane phospholipids as a sort of lipid equilibrium, membrane proteins such as spectrin play an impor-tant role in the maintenance of membrane lipid asym-metry in erythrocytes (20, 21). The membrane pro-teins of our patient did not reveal any abnormalities (data not shown).
These results suggest that erythrocytes with LCAT deficiency may have an abnormal intramembrane distribution of lipids, and abnormal properties such as deformability, membrane fluidity, mean corpus-cular volume and the shape of the cells may attrib-ute to the abnormal distribution of membrane lipids. This was supported by the fact that we are able to prevent the increase of transformed cells by means of cholesterol depletion from the membrane (Table 4). As a preliminary experiment for confirmation, intact erythrocyte membranes were exposed to choleste-rol oxidase from outside the membrane. Although all the membrane cholesterol was oxidized, choles-terol in the patient’s membrane exhibited less re-activity (ca. 4 fold) despite the total amount of
cho-lesterol being richer than in normal cells. These re-sults indicate that anemia, abnormal shape and the increased mean corpuscular volume of this patient’s erythrocytes may be related to membrane instabil-ity owing to the abnormal distribution of membrane lipids such as cholesterol, phosphatidylcholine and phosphatidylethanolamine.
ACKNOWLEDGEMENTS
The authors wish to thank Dr. Sayaka Utsumi for helpful proofreading, and Miss Misuzu Sekiya and Mr. Daizaburo Shimizu for their expert technical assistance. We gratefully acknowledge Tokushima Res. Inst., Otsuka Pharmaceutical Co., Ltd.,Tokushima, Japan, which contributed to the execution of this study.
REFERENCES
1. Norum KR, Gjone E : Familial plasma lecithin : cholesterol acyltransfrase deficieney. Biochemical study of a new inborn of metabolism. Scand J Clin Lab Invest 20 : 231-243, 1967
2. Hovig T, Gjone E : Familial plasma lecithin : cholesterol acyltransferase (LCAT) deficiency. Ultrastructural aspects of a new syndrome with particular ref-erence to lesions in the kidneys and the spleen. Acta Pathol Microbiol Scand 81 : 681-697, 1973 3. Gjone E : Familial LCAT deficiency. Acta Med
Scand 194 : 353-356, 1973
4. Borven I, Egge K, Gjone E : Corneal and fundus changes in familial LCAT-deficiency. Acta Ophthalmol (Copenh) 52 : 201-210, 1974 5. Takeuchi N, Matsumoto A, Bando S, Kabazawa
I, Akamatsu A, Nomoto R and Kato M. Lecithin cholesterol acyltransferase deficiency. Taisha 20 (1) : 81-88, 1983 (in Japanese)
6. Glomset JA, Norum KR, Gjone E : The Metabolic Basis of Inherited Disease, 5th Ed., eds by Stanbury JB, Wyngaarden JB, Fredrickson DS, Goldstein JL, Brown MS, McGraw-Hill, New York pp.643-654, 1983
7. Simon JB, Scheig R : Serum cholesterol esterification in liver disease. New Engl J Med 283 : 841-846, 1970
8. Frohlich J, McLeod R, Hon K : Lecithin : cho-lesterol acyl transferase (LCAT). Clin Biochem 15 : 269-278, 1982
9. Maeda N, Aono K, Sekiya M, Suda T, Shiga T : T. Suda et al. erythrocyte membrane in LCAT deficiency
A computerized method for the determination of the osmotic fragility curve of erythrocytes. Anal Biochem 83 : 149-161, 1977
10. Ruiz JI, Ochoa B : Quantification in the subnanomolar range of phospholipids and neutral lipids by monodimensional thin layer chromatography and image analysis. J Lipid Res 38 : 1482-1489, 1997
11. Ways P, Hanahan DJ : Characterization and quantification of red cell lipids in normal man. J Lipid Res 5 : 318-328, 1964
12. Chen CH, Albers JJ : Characterization of proteoliposomes containing apoprotein A-I : A new substrate for the measurement of lecithin : cholesterol acyltransferase activity. J Lipid Res 23 : 680-691, 1982
13. Shiga T, Suda T, Maeda N : Spin label studies on the human erythrocyte membrane. Two sites and two phases for fatty acid spin labels. Biochim Biophys Acta 466 : 231-244, 1977
14. Lepage G, Roy CC : Direct transesterification of all classes of lipids in one-step reaction. J Lipid Res 27 : 114-120, 1986
15. Baba Y, Hamada F, Aozaki S, Hagihara R, Ohashi T, Yasumoto Y, Ohsaki K, Yamashita W, Harada R, Arima T. : A case of familial lecithin : choles-terol acyltransferase deficiency. Nippon Jinzo
Gakkai Shi 34 : 309-316, 1992
16. Suda T, Shimizu D, Maeda N, Shiga T : Decreased viscosity of human erythrocyte suspension in-duced by chlorpromazine and isoxsuprine. Biochem Pharmacol 30 : 2057-2064, 1981 17. Abugo OO, Peddada RR, Kelly JF, Roth GS, Rifkind
JM : Effect of choeresterol content in diet on capillary flow of rat erythrocytes. Part 1 : Geo-metric and flow characteristics. Clinical Hemorheol Microcirc 17 : 437-443, 1997
18. Jain SK, Mhohndas N, Sensabaugh GF, Shojania AM, Shohet SB : Hereditary plasma lecithin : cho-lesterol acyltransferase. J Lab Clin Med 99 : 816-826, 1982
19. Flamm M, Schachter D : Acanthocytosis and cholesterol enrichnent decrease lipid fluidity of only the outer human erythrocyte membrane leaflet. Nature, 298 : 290-292, 1982
20. Elgsaeter A, Shotton DM, Branton D : Intramembrane particle aggregation in erythrocyte ghosts. II. The influence of spectrin aggregation. Biochim Biophys Acta 426 : 101-122, 1976
21. Haest CW, Plasa G, Kamp D, Deuticke B : Spectrin as a stabilizer of the phospholipid asymmetry in the human erythrocyte membrane. Biochim Biophys Acta 509 : 21-32, 1978