A
pproximately 15% of all clinically recognized pregnancies end in miscarriage during the first trimester [1,2]. The most common cause of first tri- mester pregnancy loss is fetal chromosomal abnormali- ties [3]. The American Society for Reproductive Medicine (ASRM) defines recurrent pregnancy loss (RPL) as the occurrence of two or more consecutive pregnancy losses [4]. The causes of RPL include genetic, anatomic, endocrine, immunologic, and environmental factors [6-8]. For the estimation of the risk of further miscar- riage, individuals who experience RPL are examined for congenital uterine malformation, coagulation factoranomalies, antiphospholipid antibodies, thyroid dys- function, and impaired glucose tolerance, and they are managed accordingly.
Up to 50% of RPL cases do not have a clearly defined etiology [5]. Sixty percent of patients who have had two miscarriages have no maternal risk factors for RPL [6].
In such cases, miscarriages may be caused by recurrent chromosomal abnormalities. Identifying the chromo- somal profile of the miscarried embryo is important in the selection of a treatment strategy for the next preg- nancy [5], particularly for patients with RPL. In RPL cases at our institution we therefore perform a chromo- somal analysis using chorionic villus sampling, with the
CopyrightⒸ 2018 by Okayama University Medical School.
http ://escholarship.lib.okayama-u.ac.jp/amo/
Original Article
Slow Fetal Heart Rate before Miscarriage in the Early First Trimester Predicts Fetal Aneuploidy in Women with Recurrent Pregnancy Loss
Ai Sakamotoa*, Yasuhiko Kamadaa, Kotaro Kuboa, Toru Hasegawaa, Sayoko Kotania, Mikiya Nakatsukab, and Yuji Hiramatsua
aDepartment of Obstetrics and Gynecology, Okayama University Graduate Schools of Medicine,
Dentistry and Pharmaceutical Sciences, bGraduate School of Health Sciences, Okayama University, Okayama 700-8558, Japan Establishing whether miscarriages result from fetal aneuploidy or other factors is important for treating recur- rent pregnancy loss. We examined the relationship between fetal heart rate (FHR) before miscarriage in the early first trimester and fetal karyotype, analyzing 223 pregnant women with recurrent pregnancy loss. Among the pregnancies, 110 resulted in live births regarded as normal karyotype (the Norm-group). The other 113 pregnancies ended in miscarriage, and we categorized them into groups based on fetal karyotype, determined by chorionic villus sampling: the Misc-NK (normal karyotype) group, n=35 euploid cases; the Misc-CA1 (chromosomal abnormality) group, n=18 cases of aneuploidy with trisomies 13/18/21, Turner’s syndrome, or Klinefelter’s syndrome; and the Misc-CA2 subgroup, n=60 cases of other aneuploidies excluding those in the Misc-CA1 group. We compared the groups’ regression line slopes and intercepts for FHR by an analysis of covariance. The FHRs of the Norm, Misc-NK and Misc-CA1 groups increased from 36 to 49 days after fertil- ization, but did not significantly differ across these groups. The Misc-CA2 group’s FHR did not increase and significantly differed from the other three groups (p<0.01). These results suggest that the absence of an increase in FHR in early pregnancy may indicate the presence of chromosomal abnormalities causing miscarriage.
Key words: aneuploidy, chorionic villi, fetal heart rate, recurrent pregnancy loss
Received March 21, 2017 ; accepted September 22, 2017.
*Corresponding author. Phone : +81-86-235-7320; Fax : +81-86-225-9570
E-mail : [email protected] (A. Sakamoto) Conflict of Interest Disclosures: No potential conflict of interest relevant to this article was reported.
patient’s consent.
However, if this test cannot be performed for any reason (e.g., acute complete abortion), no information can be obtained about fetal chromosomal abnormali- ties. In this study, we retrospectively compared euploid and aneuploid pregnancies to evaluate differences in fetal heart rate (FHR) patterns, and we investigated the possibility of using FHR patterns to predict the presence of fetal chromosomal abnormalities.
Patients and Methods
Management of RPL. At our hospital, outpa- tients with RPL are examined for risk factors of miscar- riage. Screening tests include the measurement of anti- phospholipids (lupus anticoagulant, anti-cardiolipin IgG antibody, anti-cardiolipin IgM antibody, anti-β2 glycoprotein-I antibody, and anti-thrombin antibody), prolactin, thyroid-stimulating hormone, hemoglobin A1c, and coagulation factors (protein S antigen levels and activity, protein C antigen levels and activity, and factor XII). Based on the results of these tests, we develop a treatment plan for subsequent pregnancies in accordance with the ASRM guidelines [5] and the pro- posal from the study group of the Japanese Ministry of Health, Labor and Welfare (available at: <Fuiku.jp/
common/teigen001.pdf> in Japanese). When miscar- riages occur despite our management, we conduct a chorionic villus chromosomal analysis to ascertain the cause of pregnancy loss after informing the patient of the potential benefits and risks of the procedure and obtaining her consent.
Chorionic villus chromosomal analysis. We ret- rospectively analyzed the cases of 113 women with sin- gleton pregnancies who were managed for RPL and underwent a chorionic villus chromosomal analysis after miscarriage at Okayama University Hospital during the period from January 2010 to April 2016. The median maternal age was 35.5 years (range 25-44 years).
The chorionic villus chromosomal analyses were per- formed by SRL, Inc. (Tokyo, Japan) before January 2014 and by LabCorp Japan (Tokyo, Japan) thereafter.
A total of 110 women with RPL and subsequent normal deliveries from January 2010 to September 2010 were also analyzed as a control group. The median maternal age of the control group was 35.0 years (range 21-41 years).
We divided the cases into 4 groups based on their
pregnancy outcomes and chorionic villus chromosomal analysis results: the Norm-group, 110 normal deliver- ies with no anomalies and regarded as euploid; the Misc-NK (normal karyotype) group, 35 miscarriages with normal karyotype; and the Misc-CA (chromo- somal abnormality) group, 78 miscarriages with chro- mosomal anomalies, subdivided into the Misc-CA1 group, comprising the 18 cases of aneuploidy with rela- tively higher possibilities of live birth (trisomies 13/18/21, Turner’s syndrome, and Klinefelter’s syn- drome), and the Misc-CA2 group, the other 60 cases of aneuploidy causing miscarriage (triploid, tetraploid, and autosomal chromosome trisomy other than triso- mies 13/18/21).
Our study was based on a retrospective review of patient data. We conducted this study under the approval of the local institutional review board of our university (No. 1507-040). The need for informed con- sent was waived due to the retrospective nature of the study, and the details of the study are outlined in a pub- lication on the website of our department <http://www.
okayama-u-obgyn.jp/torikumi/rinri_research.html>, accessed March 2016
FHR analysis. To investigate the relationship between FHR and karyotype, we analyzed the cases of the patients whose pregnancies ended in miscarriage after the fetal heartbeat was identified, which included patients in the Misc-NK group, Misc-CA1 subgroup, and Misc-CA2 subgroup (Table 1).
We used fertilization age in days for comparison in
Table 1 Types of miscarriage and karyotypes
Group
Pre-identification of fetal heartbeat (only the gesta-
tional sac was identified) n=34
Post-identification of fetal heartbeat
n=79
Misc-NK n=35 13 (37.1%) 22 (62.9%)
Misc-CA n=78 21 (26.9%) 57 (73.0%)
Misc-CA1 n=18 2 (11.1%) 16 (88.9%)
Misc-CA2 n=60 19 (31.7%) 41 (68.3%)
Misc-NK, miscarriages with a normal karyotype; Misc-CA1, mis- carriages with trisomies 13/18/21, Turnerʼs syndrome, or Klinefelterʼs syndrome; Misc-CA2, miscarriages with triploid, tetraploid, and autosomal chromosome trisomies other than trisomies 13/18/21.
There were no marked differences in the rate of confirmed fetal heartbeat among these 3 groups.
this study, calculated as the time from ovulation to fer- tilization; this age is 14 days less than the gestational age. We collected data from day 28 after fertilization (DAF 28) to DAF 49 because the FHR increase follows a linear regression during this period [7].
FHRs were measured using transvaginal ultraso- nography with a 3.5-MHz transducer (ALOKA, Tokyo, Japan) during weekly check-ups. The basal body tem- perature was recorded in most of the patients. We thus believe that our estimates of fetal gestational age are accurate and reliable.
Statistical analysis. Patient characteristics were compared using the Mann-Whitney U-test. The regres- sion lines for the FHR of each group from DAF 28 to DAF 49 were calculated, and the slope and the inter- cept of the regression lines were compared by an analy- sis of covariance. SPSS software ver. 21 (IBM Japan, Tokyo, Japan) was used to analyze these results. Values of p<0.05 were considered significant.
Results
Chorionic villus chromosomal analysis. Fetal chromosomal abnormality was identified in 78 (69.0%) of the 113 patients who underwent a chorionic villus chromosomal analysis. Among the 34 cases in which only the gestational sacs were confirmed and fetal heartbeats were unconfirmed, chromosomal abnor- mality was identified in 21 (61.8%). Among all 35 cases of euploidy (the Misc-NK group), the fetal heartbeat could be detected in 22 (62.9%). Among the 78 cases of aneuploidy (Misc-CA1+CA2 groups), we detected fetal heartbeats in 57 (73.0%) (Table 1). There was no signif- icant difference between the Misc-NK group and Misc- CA group in the rate of fetal heartbeat confirmation.
Among the cases with a confirmed fetal heartbeat,
there were no significant differences in age, body mass index, or past history of live births among the groups and controls. However, there was a marked difference in the history of miscarriage, with a significantly greater number of miscarriages in the Misc-NK group compared to the patients in the Norm-group, the Misc-CA1 group, and the Misc-CA2 group (p<0.05) (Table 2).
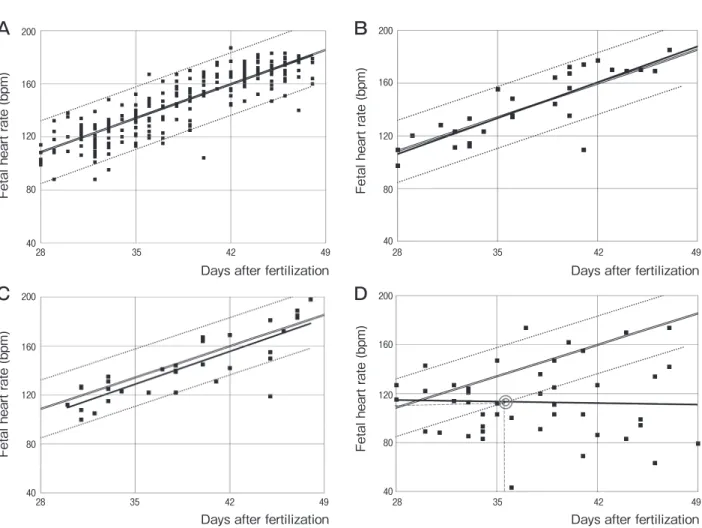
FHR before miscarriage. The FHRs of each group at DAF 28-49 (6-9) weeks of gestation are shown in Fig.1. The regression line equations for each group were as follows, where y=FHR (bpm) and x=days after fertilization (DAF):
Norm-group: y=3.664x−5.896; n=253, r=0.862;
p<0.001 (Fig.1A)
Misc-NK group: y=3.898x−3.306; n=31, r=0.855;
p<0.001 (Fig.1B)
Misc-CA1 group: y=3.812x−4.682; n=32, r=0.835;
p<0.001 (Fig.1C)
Misc-CA2 group: y =−0.172x +119.3; n =46, r=0.0346; p>0.1 (Fig.1D).
The results of the analysis of covariance revealed that the FHR did not significantly differ across the Norm-group, the Misc-NK group, and the Misc-CA1 group. The Misc-CA2 group significantly differed from the other three groups (p<0.01).
Based on the 95% confidence interval of the Norm- group and the regression line of the Misc-CA2 group (Fig.1D), after DAF 35.70, the regression line of the Misc-CA2 group diverged from the 5th percentile boundary of the normogram without increasing in accordance with the DAF. Thus, an FHR slower than the 5th percentile boundary of the normogram (Norm- group) could be used to predict the Misc-CA2 designa- tion with a sensitivity value of 0.543 and specificity value of 0.922.
Table 2 Patient characteristics in cases with confirmed fetal heartbeat; median (min.-max.)
Group Norm n=110 Misc-NK n=22 Misc-CA1 n=16 Misc-CA2 n=41 p-value
Age, yrs (range) 35.5 (21-41) 35.0 (28-39) 34.0 (25-44) 37.0 (25-44) n.s.
BMI (range) 20.9 (16.0-33.0) 21.5 (16.6-31.0) 20.0 (17.5-28.3) 22.3 (16.9-28.3) n.s.
Miscarriages (no.) 2.0 (1-6) 3.0 (2-8)* 2.0 (1-5) 2.5 (2-5) <0.05
Live births (no.) 0 (0-2) 0 (0-1) 0 (0-1) 0 (0-1) n.s.
There were no significant differences in age, body mass index (BMI), or past history of live birth across the Norm, Misc-NK, and Misc-CA groups. *The Misc-NK group significantly differed from the 2 other groups in history of miscarriage. The Mann-Whitney U-test was used to compare the data.
Discussion
The novel findings of this study are, first, that the FHRs of euploidy and aneuploidy with relatively higher possibilities of live birth (trisomies 13/18/21, Turner’s syndrome, and Klinefelter’s syndrome) increase simi- larly to the FHRs of livebirths until DAF 49. Second, the FHRs of the present aneuploid cases causing mis- carriage (triploid, tetraploid, and autosomal chromo- some trisomy other than trisomies 13/18/21) did not increase compared with those of the livebirths between
DAF 36 and 49.
For RPL patients who experience a miscarriage, regardless of the treatment that was indicated by screening tests, identifying whether the miscarriage was caused by fetal aneuploidy or other maternal risk factors is vital to planning the next treatment. When a miscarriage with a normal fetal karyotype occurs, a step-up of therapy for RPL is considered. Currently, the only method used to definitively diagnose the fetal chromosomal karyotype is a chorionic villus chromo- somal analysis, which after a miscarriage is performed
Fetal heart rate (bpm)
Days after fertilization
200
160
120
80
4028 35 42 49
Fetal heart rate (bpm)
Days after fertilization
200
160
120
80
4028 35 42 49
Fetal heart rate (bpm)
Days after fertilization
200
160
120
80
4028 35 42 49
Fetal heart rate (bpm)
Days after fertilization
200
160
120
80
4028 35 42 49
A B
C D
Fig. 1 Change in fetal heart rate (FHR) and regression line of each group. In all graphs, double lines indicate the regression line, and dotted lines indicate the 95%CI. A, FHRs of live births without anomaly (Norm-group). The change in FHR and the regression line of live births without anomaly between 28-49 days of gestation are shown. The regression line equation was y=3.664x-5.896 (n=253, R2=0.7443; y=fetal heartbeat [bpm], x=days after fertilization); B, FHRs of the pregnancies with normal karyotypes that ended in miscar- riage (Misc-NK group). The regression line equation was y=3.898x-3.306 (n=31, R2=0.7317); C, FHRs of the pregnancies with triso- mies 13/18/21, Turnerʼs syndrome, or Klinefelterʼs syndrome that ended in miscarriage (Misc-CA1 group). The regression line equation was y=3.812x-4.682 (n=32, R2=0.6979); D, FHRs in the pregnancies with aneuploidy including triploid, tetraploid, and autosomal chromosome trisomies causing miscarriage (Misc-CA2 group). The regression line equation was y=-0.1721x+119.3 (n=46, R2=0.001200). The coordinates of the intersection (◎) of the regression line and dotted lines indicate that the 95%CI of the Norm- group=35.70-113.2.
mainly with metaphase karyotyping. This method gives information on both the chromosome number and arrangement; however, it also has several limitations.
Because of the requirement for tissue culture, the cho- rionic villi tissue must be obtained by intrauterine sur- gery without bacterial or maternal cell contamination.
Discharged chorionic villi have been analyzed with microarray-based comparative genomic hybridization (array-CGH) [8]. However, this technique is expensive and not yet standardized. Moreover, the analysis of cases in which no tissue is collected (e.g., complete abortion) remains impossible.
At present, health insurance in Japan does not cover chorionic villus chromosomal analyses with either metaphase karyotyping or array-CGH, which are expensive for the average patient. We therefore investi- gated the possibility of the FHR measured ultrasono- graphically to serve as a predictor of fetal karyotype.
There were no notable differences in the rate of fetal heartbeat confirmation between the normal and abnor- mal fetal karyotypes, thus suggesting that the confir- mation of fetal heartbeat does not exclude fetal aneu- ploidy.
In the management of patients with RPL, we observed 2 typical FHR patterns that characterized miscarriages after the identification of fetal heart move- ment. In the first pattern, the FHR increases normally and stops abruptly. In the second pattern, the FHR does not demonstrate a normal pattern of increase and eventually ends in fetal death. We focused on the rela- tionship between these FHR patterns and the fetal karyotype. A normal fetal heartbeat is usually con- firmed around the sixth week of gestation and increases steadily to approx. 180 bpm at the ninth week of gesta- tion [9,10]. Although a slow FHR at the seventh week of gestation or earlier is associated with a high risk of first trimester death [11,12], it remains unclear whether fetal aneuploidy is the reason for these fetal deaths. Our present findings provide the first evidence that one pos- sible reason for first-trimester deaths with a slow FHR may be fetal aneuploidy.
We divided the present aneuploid cases into 2 groups, i.e., those with trisomies 13/18/21, Turner’s syndrome, or Klinefelter’s syndrome, and those with other aneuploidies. The following rates of miscarriage have been reported in fetuses with trisomies 13/18/21 and 45, X: 79% for trisomy 21, 94% for trisomy 18, 98% for trisomy 13, and 99.7% for 45, X [13]. Live
deliveries of trisomies 13/18/21, 45, X, and 47, XXY are not rare. By contrast, the live birth of triploid babies is extremely rare [14,15]. Almost all triploid, tetraploids, and autosomal chromosome trisomies other than trisomies 13/18/21 end in miscarriage.
Our analyses demonstrated that the pattern of FHR increase in miscarried fetuses with euploidy (the Misc-NK group) was not significantly different from that of the group with normal live births (the Norm- group). In most of the samples, the FHRs of the Misc-NK group were located mainly within the 95%CI of normal deliveries. Even with the chromosomal aber- rations, the FHR pattern of our Misc-CA1 cases was also not significantly different from that of the Norm- group. By contrast, the regression line of FHR in the Misc-CA2 group differed significantly from that of the Norm-group. No increase in the FHR with DAF was observed, and an FHR slower than the 5th percentile boundary of normal live births could be used to predict the existence of aneuploidy leading to miscarriage with 0.543 sensitivity and 0.922 specificity.
Notably, we cannot conclude that a miscarriage with a normal FHR is due to maternal factors and that the fetus was euploid. The possibility that a miscarriage may be due to trisomies 13/18/21, 45, X, or 47, XXY cannot be ruled out. Even in the fetal aneuploidy caus- ing miscarriages, 45.6% of the cases had a normal FHR.
While our results suggest a relationship between slow FHR and fetal aneuploidy, no conclusions can be drawn regarding normal FHR and fetal euploidy.
This study also has some limitations. The patients with live births were patients who had been previously treated for RPL at our hospital; they were not com- pletely healthy controls. Tezuka et al. reported that the regression equation for normal embryos from 36-38 days to 60-62 days of gestation is as follows: heart rate=3.850×gestational days (days after last menses)
−54.64 (R2=0.908, n=347) [7]. We recalculated our data from the 110 patients in the Norm-group with the same method and determined a regression equation of heart rate=3.767×gestational days (days after last men- ses)−56.10 (R2=0.744). Therefore, we believe that there is little difference between the FHRs in the healthy controls and the 110 controls in this study.
In conclusion, our findings indicate that the absence of a normal increase in FHR between DAF 36 and 49 may be useful in predicting a miscarriage that is due to fetal chromosomal aberrations. The results of this study
may be useful for the estimation of fetal aneuploidy due to miscarriage with FHR when a chorionic villus chro- mosomal analysis is not feasible.
References
1. Alijotas-Reig J and Garrido-Gimanez C: Current concepts and new trends in the diagnosis and management of recurrent miscarriage.
Obstet Gynecol Surg (2013) 68:445-466.
2. Zinaman MJ, Cleqq ED, Brown CC, OʼConnor J and Selevean SG: Estimates of human fertility and pregnancy loss. Fertil Steril (1996) 65:503-509.
3. Stephenson MD, Awartani KA and Robinson WP: Cytogenetic analysis of miscarriages from couples with recurrent miscarriage: a case-control study. Hum Reprod (2002) 17:446-451.
4. Practice Committee of the American Society of Reproductive Medicine: Definitions of infertility and recurrent pregnancy loss: a committee opinion. Fertil Steril (2013) 99: 63.
5. Practice Committee of the American Society of Reproductive Medicine: Evaluation and treatment of recurrent pregnancy loss: a committee opinion. Fertil Steril (2012) 98: 1103-1111.
6. Kataoka K, Tomiya Y, Sakamoto A, Kamada Y, Hiramatsu Y and Nakatsuka M: Altered autonomic nervous system activity in women with unexplained recurrent pregnancy loss. J Obstet Gynaecol Res (2015) 41:912-918.
7. Tezuka N, Sato S, Kanasugi H and Hirii M: Embryonic heart
rates: development in early first trimester and clinical evaluation.
Gynecol Obstet Invest (1991) 32:210-212.
8. Hu Y, Chen X, Chen LL, Xu ZF, Wang X and Cui H: Comparative genomic hybridization analysis of spontaneous abortion. Int J Gynaecol Obstet (2006) 92:52-57.
9. Hertzberg BS, Mahony BS and Bownie JD: First trimester fetal cardiac activity. Sonographic documentation of a progressive early rise in heart rate. J Ultrasound Med (1988) 7: 573-575.
10. Doubliet PM, Benson CB and Chow JS: Long-term prognosis of pregnancies complicated by slow embryonic heart rates in the early first trimester. J Ultrasound Med (1999) 18: 537-541.
11. Doubilet PM and Benson CB: Embryonic heart rate in early first trimester: What rate is normal? J Ultrasound Med (1995) 14: 431- 12. Doubilet PM and Benson CB: Outcome of first-trimester pregnan-434.
cies with slow embryonic heart rate at 6-7 weeks gestation and normal heart rate by 8 weeks at US. Radiology (2005) 236: 643- 13. Numabe H: Fetal abnormality and anomaly; autosomal aberration. 646.
The World of Obstetrics and Gynecology (2001) 53:771-781 (in Japanese).
14. Ben Hamouda H, Tfifha M, Elqhezal H, Tlili Y, Soua H, Saad A and Sfar MT: Postnatal diagnosis and prognosis of 2 cases of trip- loidy. Arch Pediatr (2010) 17:1078-1082.
15. Iliopoulos D, Vassiliou G, Sekrli E, Sidiropoulou V, Tsiga A, Dimopoulou D and Voyiatzis N: Long survival in a 69, XXX triploid infant in Greece. Genet Mol Res (2005) 4:755-759.