Corresponding author: Takaaki Sugihara, MD, PhD sugitaka@med.tottori-u.ac.jp
Received 2017 March 22 Accepted 2017 April 19
Abbreviations: AFP, alpha-fetoprotein; ALT, alanine aminotrans-ferase; AST, aspartate aminotransaminotrans-ferase; AUROC, area under the receiver operating characteristic; AUS, abdominal ultrasound; BMI, body mass index; CAP, controlled Attenuation Parameter; DCP, des-γ-carboxy prothrombin; GGT, gamma-glutamyl transferase; HbsAg, hepatitis B surface antigen; HBV, hepatitis B virus; HCC, hepatocellular carcinoma; HCV, hepatitis C virus; kPa, kilopascal; LSM, liver stiffness measurement; NAFLD, nonalcoholic fatty liver disease; NASH, non-alcoholic steatohepatitis; ns, not significant; NPV, negative predictive value; PPV, positive predictive value; RAS, the renin–angiotensin system; ROC, receiver operating characteris-tic; SNS, sympathetic nerve system; TE, transient elastography
Risk Assessment of Hepatocellular Carcinoma in General Population by Liver
Stiffness in Combination with Controlled Attenuation Parameter using Transient
Elastography: A Cross Sectional Study
Takaaki Sugihara,* Masahiko Koda,* Tomomitsu Matono,* Kinya Okamoto,* Yoshikazu Murawaki,* Hajime Isomoto* and Shiho Tokunaga†
*Division of Medicine and Clinical Science, Department of Multidisciplinary Internal Medicine, School of Medicine, Tottori University Faculty of Medicine, Yonago 683-8504, Japan and †Nonohana Clinic, 3-341 Gyotoku, Tottori 680-0824, Japan
ABSTRACT
Background Hepatocellular carcinoma (HCC) in pa-tients without hepatitis B (HBV) and -C virus (HCV) infection are increasing in Japan. Method for detecting high-risk liver diseases of HCC in general population has still not been established. Liver stiffness measure-ment (LSM) and Controlled Attenuation Parameter (CAP) using transient elastography (TE; FibroScan Sys-tem) are useful for detecting liver fibrosis and steatosis. The aim of this study is to clarify TE for risk assessment of HCC in general population.
Methods This cross-sectional study was performed for residents aged ≥ 40 years in an intermountain town in Japan with a population of 3,493. Blood laboratory testing included tumor markers, abdominal ultrasound (AUS), and TE was performed.
Results Among 175 subjects (64 men, 111 women), TE was evaluated and three patients with HCC were detected by AUS. For detecting HCC, the cut-off value of LSM was 5.3 kPa sensitivity 100%, specificity 75%, AUROC 0.88). The combination of LSM and CAP (LSM > 5.3 kPa with any CAP and CAP > 248 dB/m with any LSM) could detect the high-risk liver diseases of HCC (HCC, nonalcoholic fatty liver/steatohepatitis, HBV or HCV related chronic viral hepatitis with alanine transaminase (ALT) > 30 IU/L for men or > 19 IU/L for women or cirrhosis of any cause) with high sensitivity
(sensitivity 90%, specificity 55%, positive predictive val-ue 10%, negative predictive valval-ue 99%, P = 0.006). Conclusion The combination of LSM and CAP can be useful in detecting high-risk liver diseases of HCC out of general population.
Key words controlled attenuation parameter, liver stiffness measurement, transient elastography, transab-dominal ultrasound
Hepatocellular carcinoma (HCC), mainly related to hep-atitis C virus (HCV) infection, is a major disease entity with high mortality in Japan.1 Therefore, screening for
hepatitis virus infection had already been performed at periodical health check-ups by a 5-year national project from 2002 to 2006 in Japan.2, 3 However, only about
60% of these viral positives were admitted to hospitals.4
The early detection of HCC has not yet been achieved satisfactorily. Recently, the patients without viral in-fection also have increased in 5 to 20% in Japan,5 and
direct-acting antivirals are estimated to eradicate most of the HCV in the near future.6 Hence, establishing a
new diagnostic method regardless of viral infection is a crucial issue.
A mass-screening program for HCC has never been established in Japan. Although direct screening for all people with abdominal ultrasonography (AUS) is ideal, mass screening is hindered by its slow process (about 15 minutes per person) and cost (around 5000 yen per per-son).
Liver fibrosis has been reported to be correlated with risk of HCC.7 Detecting liver steatosis is also important
for diagnosing non-alcoholic steatohepatitis (NASH) as a risk of HCC without viral infection.8 In this regard,
liver stiffness measurement (LSM) and Controlled At-tenuation Parameter (CAP) using transient elastography (TE; FibroScan System, Echosens SA, Paris, France) can detect non-invasive liver fibrosis and steatosis, re-spectively.9–11 They can be measured at the same time.
Both LSMs between 7 kPa to 12.5 kPa and > 12.5 kPa are considered as an optimized cutoff value to detect
significance to sever fibrosis (F2–F3) and cirrhosis (F4) respectively.9 Recently, several reports have
demonstrat-ed that LSM is useful in detection of cirrhosis out of the general population.12–15 CAP is also reported to be
significantly correlated with steatosis found by AUS in the general population.16 However, to our knowledge,
there are no reports evaluating both parameters in HCC screening. The aim of this study is to clarify TE for risk assessment of HCC in general population.
SUBJECTS AND METHODS Subjects
Firstly, we planned the HCC screening program using tumor markers (alpha-fetoprotein; AFP and des- γ-car-boxy prothrombin; DCP) and AUS. Subjects with abnor-mal findings by AUS and/or elevation in tumor markers (AFP > 10ng /mL, DCP > 40 mAU/mL) were underwent further examinations. The evaluation of sonographic findings was based on the guideline edited by the Jap-anese society of gastrointestinal cancer screening.17 In
both June 2014 and January 2015, this program was performed for residents of the age of 40 or more in an intermountain town in Japan with a population of 3,493 (population of subjects aged 40 or more was 74.2%). About 40% of the residents aged ≥ 40 of the town were already checked for hepatitis B surface antigen (HBs-Ag) and hepatitis C virus antibody through the national health project,2, 3 and these data were available. On the
same day of the HCC screening program, each applied resident had undergone interviews (alcohol consumption, smoking, comorbidity; diabetes /hypertension/hyper-lipidemia), anthropometric measurements (height and weight), blood laboratory tests [aspartate aminotransfer-ase (AST), alanine aminotransferaminotransfer-ase (ALT), gamma-glu-tamyl transferase (GGT), AFP, and DCP], AUS, and TE. Drinkers and smokers were defined as alcohol consump-tion ≥ 20 g/day, and current and former smokers who have more than a 30-pack-per-year history of smoking, respectively.18, 19 Body mass index (BMI) was calculated
as the weight (kg) divided by height (m) squared (kg/ m2). TE was performed by FibroScan 502 equipped
with M-probe (Echosens SA, Paris, France). TE was measured through the skin between the rib bones at the level of the right lobe of the liver in the supine position without assistance by AUS. LSM was expressed in kilo-pascal (kPa) and the median value of 10 measurements was used. At least 10 valid measurements with success rate > 60% and interquartile range/median liver stiffness ratio < 30% were adapted.20, 21 CAP was also obtained
simultaneously. We used the median of individual CAP values expressed in decibels per meter (dB/m). We de-fined the high-risk liver diseases as HCC, hepatitis B
vi-rus (HBV) and hepatitis C vivi-rus (HCV) induced chronic viral hepatitis with ALT > 30 IU/L for men or > 19 IU/ L for women, nonalcoholic fatty liver disease (NAFLD)/ steatohepatitis (NASH) and cirrhosis of any causes. Ethical Considerations
The study protocol confirmed to the ethical guidelines of the 1975 Declaration of Helsinki as revised in 2000 and was approved by the ethics committee of the Tottori University (No. 2438). Subjects were enrolled after giv-ing their written informed consent.
Statistical analysis
Data are expressed as median (range) or mean ± SD. Statistical analyses for significant differences among the groups were performed using the chi-square test, the Mann-Whitney’s U test, or the Kruskal-Wallis test. Correlations were calculated using Spearman’s rank cor-relation coefficient. Multivariate analysis was performed using logistic regression model. All statistical analyses were performed using StatFlex (Windows ver 6.0; Ar-tech, Osaka, Japan). Statistical significance was set at P < 0.05.
RESULTS
Background of Subjects
We evaluated 181 subjects (65 men, 116 women) in the HCC screening program. In this program, AUS detected three patients (1.7%) with HCC out of 181 subjects in combination with positive tumor markers. The median age was 70 (40–81) years old, the median body mass in-dex (BMI) was 26.7 (15–35) kg/m2, diabetes in 19 cases
(11%), hypertension in 70 cases (38.7%) hyperlipidemia in 61 cases (33.7%) and viral hepatitis in 16 cases (HBV in 2, HCV in 14). Drinkers and smokers were in 36 cas-es (19.9%) and in 38 cascas-es (21%), rcas-espectively (Table 1). Transient elastography in the HCC screening pro-gram
TE could be analyzed in 175 subjects because six sub-jects were unmeasurable. The average exam duration was 138 ± 106 second, average success rate was 84 ± 23%, the median of LSM was 4.4 (2–27.7) kPa, 7–12.5 kPa in 11 cases (6%), and more than 12.5 kPa in 6 cases (3%) (Table 2). Six (35.3%) of 17 subjects with LSM > 7 kPa had HCV infection. The median LSM values were significantly higher in subjects with BMI ≥ 25 kg/m2,
hepatitis virus infection, habitual smoking, or hyperten-sion than those without these backgrounds (Table 3). On the other hand, the median CAP was 224 (100–389) dB/ m (Table 2) and CAP values were significantly higher in subjects with BMI > 25 kg/m2 and fatty liver detected by
Table 1. Clinical findings in HCC screening program Subjects n = 181 Gender (male:female) 65:116 Age (years) 70 (40–81) BMI* (kg/cm2) 26.7 (15–35) > 25 kg/cm2 47 (26%) HCC 3 ( 1.7%) Etiology** HBV infection 2 ( 1.1%) HCV infection 14 ( 7.7%)
Alcohol consumption (≥ 20 g/day) 36 (19.9%)
Smoking (≥ 30 pack-year) 38 (21%)
Comorbidity
Diabetes 19 (10.5%)
Hypertension 70 (38.7%)
Hyperlipidemia 61 (33.7%)
Data are expressed as median (range). *Lacked in 2 persons. **Hepatitis virus infection was checked by hepatitis B surface antigen (HBs-Ag) and HCV antibody.
BMI; body mass index, HBV, hepatitis B virus; HCC, hepatocel-lular carcinoma; HCV, hepatitis C virus.
Table 2. Results of transient elastography
n = 181 Success measurement 175 (96.7%) Exam duration (s) 138 ± 106 Success rates (%) 84 ± 23 LSM (kPa) 4.4 (2–27.7) 7–12.5 kPa 11 (6%) ≥ 12.5 kPa 6 (3%) CAP (dB/m) 224 (100–389)
Data are expressed as mean ± SD or median (range).
CAP, controlled attenuation parameter; LSM, liver stiffness mea-surement.
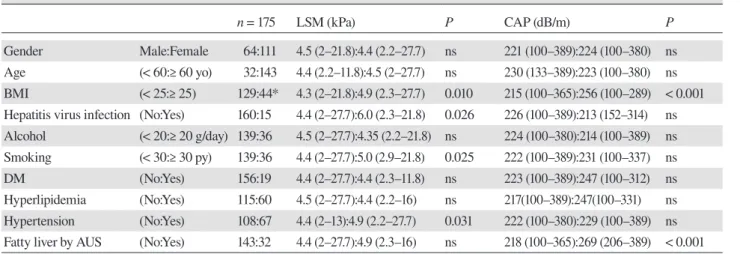
Table 3. Differences of LSM and CAP according to clinical parameters
n = 175 LSM (kPa) P CAP (dB/m) P
Gender Male:Female 64:111 4.5 (2–21.8):4.4 (2.2–27.7) ns 221 (100–389):224 (100–380) ns Age (< 60:≥ 60 yo) 32:143 4.4 (2.2–11.8):4.5 (2–27.7) ns 230 (133–389):223 (100–380) ns BMI (< 25:≥ 25) 129:44* 4.3 (2–21.8):4.9 (2.3–27.7) 0.010 215 (100–365):256 (100–289) < 0.001 Hepatitis virus infection (No:Yes) 160:15 4.4 (2–27.7):6.0 (2.3–21.8) 0.026 226 (100–389):213 (152–314) ns Alcohol (< 20:≥ 20 g/day) 139:36 4.5 (2–27.7):4.35 (2.2–21.8) ns 224 (100–380):214 (100–389) ns Smoking (< 30:≥ 30 py) 139:36 4.4 (2–27.7):5.0 (2.9–21.8) 0.025 222 (100–389):231 (100–337) ns DM (No:Yes) 156:19 4.4 (2–27.7):4.4 (2.3–11.8) ns 223 (100–389):247 (100–312) ns Hyperlipidemia (No:Yes) 115:60 4.5 (2–27.7):4.4 (2.2–16) ns 217(100–389):247(100–331) ns Hypertension (No:Yes) 108:67 4.4 (2–13):4.9 (2.2–27.7) 0.031 222 (100–380):229 (100–389) ns Fatty liver by AUS (No:Yes) 143:32 4.4 (2–27.7):4.9 (2.3–16) ns 218 (100–365):269 (206–389) < 0.001 *Lacked in 2 persons.
AUS, abdominal ultrasonography; BMI, body mass index; CAP, controlled attenuation parameter; DM, diabetes mellitus; LSM, liver stiffness measurement; ns, not significant; py, pack-year; yo, year-old.
AUS (Table 3). The subjects were divided into quartiles Q1 to Q4, according to CAP values: Q1, < 195; Q2, 195– 223; Q3, 224–263; and Q4, ≥ 264 dB/m. Among all the patients, the LSM values were significantly higher in Q4 [4.85 (2.3–16) kPa] compared with Q1 [4.5 (2–13) kPa] and Q3 [3.8 (2.2–20.2) kPa] (P = 0.02) (Fig. 1A). There was no significant correlation between CAP values and LSM values (r = 0.06, P = 0.11) (Fig. 1B). The only one case diagnosed as NASH demonstrated LSM 27.7 kPa and CAP 208 dB/m.
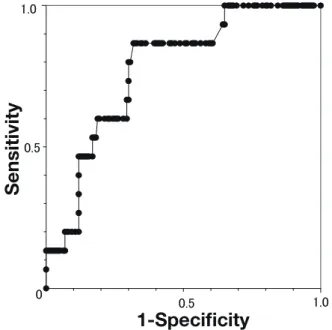
LSM in HCC detection
For detecting HCC, the area under the receiver operat-ing characteristic (AUROC) was 0.88. Usoperat-ing the cut-off value of LSM as 5.3 kPa, the sensitivity and specificity were 100% and 75%, respectively (Fig. 2).
Combined parameter for detecting high-risk liver diseases of HCC
Then, we evaluated TE as a tool for detecting high-risk liver diseases of HCC (HCC, HBV and HCV related chronic hepatitis with ALT > 30 IU/L for men or >19 IU/L for women, NAFLD/NASH or cirrhosis of any cause). We have defined a cut-off value of the CAP for the detection of fatty liver by AUS with abnormal ALT (> 30 IU/L for men or > 19 IU/L for women) as 248 dB/m (AUROC 0.77) (Fig. 3), and set the combined parameter as LSM > 5.3 kPa with any CAP and CAP > 248 dB/m with any LSM. The parameter demonstrated high
sensi-Fig.1
0
10
20
30
Q1
Q2
Q3
Q4
LSM
(kPa)
*
CAP
100 200 300 400
0
10
20
30
r
LSM
(kPa)
CAP (dB/m)
A
B
0.5 1.0 0 0.5 1.01-Specificity
Sensitivity
Fig.2 Fig.3
Sensitivity
1-Specificity
0.5 1.0 0.5 1.0 0Fig. 1. Relations between LSM and CAP values.
(A)The subjects were divided into quartiles Q1 to Q4, according to CAP values: Q1, < 195; Q2, 195–223; Q3, 224– 263; and Q4, ≥ 264 dB/m. LSM values were significantly higher in Q4 [4.85 (2.3–16) kPa] compared with Q1 [4.5 (2–13) kPa] and Q3 [3.8 (2.2–20.2) kPa] *P = 0.02 (B) There was no significant correlation between CAP values and LSM values (r = 0.06, P = 0.11). CAP, controlled attenuation parameter; LSM, liver stiffness measurement.
Fig. 2. ROC of the LSM values in detecting HCC.
For detecting HCC, the AUROC was 0.88. Cut-off values of 5.8 kPa had 100% sensitivity and 75% specificity. AUROC, area un-der the receiver operating characteristic CAP, controlled attenua-tion parameter; LSM, liver stiffness measurement; ROC, receiver operating characteristic.
Fig. 3. ROC of the CAP values in detecting fatty liver by AUS
with abnormal ALT.
For detecting fatty liver by AUS with abnormal ALT, the AUROC was 0.77. Cut-off values of 248 dB/m had 67% sensitivity and 70% specificity. ALT, alanine aminotransferase; AUS, abdominal ultrasonography; AUROC, area under the receiver operating char-acteristic; ROC, receiver operating characteristic.
tivity in detecting the high-risk liver diseases [sensitivity 90%, specificity 55%, positive predictive value (PPV) 10%, negative predictive value (NPV) 99%, P = 0.006]. The combined parameter could detect 11 subjects [HCC (n = 3), chronic hepatitis B (n = 1), chronic hepatitis C (n =3), NAFLD (n = 2), NASH (n = 1) and cirrhosis (n = 1)]. The numbers of hepatitis virus infection, AST and ALT levels were significantly higher in the high-risk liver dis-eases than in the others (Table 4).
DISCUSSION
This study demonstrated the combined parameter of LSM and CAP is a sensitive, non-invasive, quick (about 2 minutes average), and less expensive (around 2000 yen per person) tool in mass screening of high-risk liver dis-eases.
The detection rate of HCC was low (1.7%) in the present study. The large cohort study for screening HCC using ultrasonography in Japan also demonstrated the incidence of HCC was 0.034% (39/113,992).22 Taking
into consideration the low incidence of HCC in the gen-eral population, it is fundamentally difficult to obtain enough sample size for multivariate analysis to predict HCC in such population. Therefore, this preliminary study aimed to evaluate TE for detecting high-risk liver diseases.
Two (66.7%) out of three HCC subjects were HCV positive. The hepatitis virus screening is undoubtedly important for detecting HCC, however, these two pa-tients with known HCV infection had not been indicated
any HCCs until this study. Considering their significant-ly higher LSM, to show ‘direct’ liver parameters of TE is expected to motivate patients to have ultrasonographic examination.
Liver fibrosis has been reported to be closely relat-ed with HCC.7 Several reports have also demonstrated
LSM could indicate the presence of cirrhosis out of general population.12–15 The selected cutoff level of LSM
(5.3 kPa) was relatively lower, however, the optimal cutoff value of LSM is still controversial because of its differences with etiologies.23 Furthermore, there are no
optimal cutoff value for HCC screening.
On the other hand, meta-analysis indicated that the median optimal cut-off value of CAP for stage 1 to 3 ste-atosis were 232.5 (214–289) dB/m, 255 (233–311) dB/m, and 290 (266–318) dB/m, respectively.24 In the present
study, we set the cutoff value of CAP as 248 dB/m from result of fatty liver diagnosed by AUS with abnormal ALT levels. It covers the stage 1-2 of steatosis.
In this study, the obese subjects had higher LSM and higher CAP than non-obese subjects. Recent re-port indicated that the LSM values increase according to CAP values, and increase the percentage of false positive.25 However, in the present study, there was no
significant correlation between the two parameters. The LSM values were also significantly higher in smokers and subjects with hypertension. It has been reported that smoking increases hepatic fibrosis when associated with hepatitis virus infection or NAFLD.26, 27 In the present
study, there were only two smokers with hepatitis virus
Table 4. Differences between the subjects with and without high-risk liver diseases of HCC
Non high-risk (n = 164) High-risk (n = 11) P
Gender (male:female) 62:102 2:9 ns
Age (years) 70 (40–81) 69 (64–78) ns
BMI (kg/m2 ) 24.6 (15.0–34.3) 21.5 (17.9–28.6) ns
Hepatitis virus infection 8 (4.9%) 7 (63.6%) < 0.001
Alcohol consumption (≥ 20 g/day) 34 (20.7%) 2 (18.2%) ns
Smoking (≥ 30 pack-year) 34 (20.7%) 2 (18.2%) ns DM 18 (11%) 1 (9.1%) ns AST (IU/L) 23 (14–84) 32 (19–112) 0.001 ALT (IU/L) 17.5 (8–108) 38 (12–93) 0.002 GGT (mg/mL) 21 (9–278) 31 (13–80) ns AFP (ng/mL) 2.8 (0.7–9.5) 3.1 (1.2–92) ns DCP (mAU/L) 20 (10–281) 27 (10–110) ns
AFP, alpha-fetoprotein; AST, aspartate aminotransferase; ALT, alanine aminotransferase; BMI, body mass index; CAP, controlled at-tenuation parameter; DCP, des-γ-carboxy prothrombin; DM, diabetes mellitus; GGT, gamma glutamyl transferase; HCC, hepatocellular carcinoma; LSM, liver stiffness measurement; ns, not significant.
infection. Except for hepatitis virus infection, there was significant difference in LSM between non-smoker (n = 126) and smoker (n = 34) [4.4 (2–27.7) vs 4.9 (2.9–10.4) kPa, P = 0.028]. CAP values were higher in smokers; however, the rate of fatty liver was not significantly higher in smokers. Moreover, alcohol consumption was higher in smokers; however, no additional influences in LSM were observed. Therefore, there is no convincing data to ex-plain the relation between smoking and liver fibrosis. On the other hand, the subjects with hypertension had higher LSM. Recent reports have also indicated that hyperten-sion is associated with NAFLD as metabolic syndrome.28
Insulin resistance raises blood pressure through the acti-vation of the sympathetic nerve system (SNS) 29 and the
renin–angiotensin system (RAS).30 The up-regulation of
SNS and RAS induces liver fibrosis.31, 32 Therefore,
hyper-tension can be considered as a part of risk of HCC. Considering the high sensitivity (90%) and high NPPV (99%), the negativity of the combined parameter would rather effectively exclude the subjects who are supposed not to have high-risk liver disease. In mass screening settings, only the subjects with positive result of combined parameter should be performed further ex-aminations including AUS.
There were several limitations in this study. First, the sample size was small. Therefore, it was difficult to perform multivariate analysis. This is the first preliminary study to clarify the combination of TE parameters for risk assessment of HCC in general population, and it should be validated in a prospective large cohort. Second, six sub-jects could not be measured by TE; therefore, they were excluded from this study. We used only M probe (3.5MHz), and its unmeasurable rate is reported as 11.6–18.4%, and is associated with BMI > 30 kg/m2,23, 33 or age > 50
years.33 Although these 6 subjects (3%) had significantly
higher median BMI than measurable subjects [23.6 vs 26.2 kg/m2, P = 0.028], there was only one patient with
BMI > 30 kg/m2. On the other hand, all the six subjects
were > 50 years old. Nowadays, a new probe (XL probe, 2.5MHz) has become available for obese or older sub-jects. 23, 33 Further study with XL probe is needed.
In conclusion, the present study demonstrated that the combination of LSM and CAP is a sensitive, non-in-vasive, quick, and less expensive tool for detecting high-risk liver diseases of HCC out of general population. Acknowledgments: We would like to thank Yoko Yamane for ar-rangement of the health checks for this study.
The authors declare no conflict of interest.
REFERENCES
1 UmemuraT, Ichijo T, Yoshizawa K, Tanaka E, Kiyosawa K. Epidemiology of hepatocellular carcinoma in Japan. J Gastro-enterol. 2009;44:102-7. PMID: 19148802.
2 Tsukuma H, Tanaka H, Ajiki W, Oshima A. Liver Cancer and its Prevention. Asian Pacific J Cancer Prev. 2005; 6:244-50. PMID: 16235981.
3 Tanaka J, KoyamaT, Mizui M, Uchida S, Katayama K, Matsuo J, et.al. Total Numbers of Undiagnosed Carriers of Hepatitis C and B Viruses in Japan Estimated by Age- and Area-Specific Prevalence on the National Scale.Intervirology. 2011;54:185-95. PMID: 21454956.
4 MHLW GRANTS SYSTEM [Internet]. Tokyo: National In-stitute of Public Health. [Updated 2015 Jun 3; cited 2017 Mar 17]. Available from: http://mhlw-grants.niph.go.jp/niph/search/ NIDD01.do?resrchNum=201227012A. Japanese.
5 Nishikawa H, Osaki Y. Non-B, non-C hepatocellular carcinoma (Review). Int J Oncol. 2013;43:1333-42. PMID: 23969900.
6 Tamori A, Enomoto M, Kawada N. Recent Advances in An-tiviral Therapy for Chronic Hepatitis C. Mediators Inflamm. 2016:6841628. DOI: 10.1155/2016/6841628. PMID: 27022210. 7 Fattovich G, Stroffolini T, Zagni I, Donato F. Hepatocellular
carcinoma in cirrhosis: incidence and risk factors. Gastroen-terology. 2004;127:S35-50.PMID: 15508101.
8 Abd El-Kader SM, El-Den Ashmawy EM. Non-alcoholic fatty liver disease: The diagnosis and management. World J Hepatol. 2015;7:846-58. PMID: 25937862.
9 Castera L, Forns X, Alberti A. Non-invasive evaluation of liver fibrosis using transient elastography. J Hepatol. 2008;48:835-47. PMID: 18334275.
10 Friedrich-Rust M, Ong MF, Martens S, Sarrazin C, Bojunga J, Zeuzem S, et.al. Performance of transient elastography for the staging of liver fibrosis: a meta-analysis. Gastroenterology. 2008;134:960-74. PMID: 18395077.
11 de Lédinghen V, Vergniol J, Capdepont M, Chermak F, Hiriart JB, Cassinotto C, et.al. Controlled attenuation param-eter (CAP) for the diagnosis of steatosis: a prospective study of 5323 examinations. J Hepatol. 2014;60:1026-31. PMID: 24378529.
12 Roulot D, Costes JL, Buyck JF, Warzocha U, Gambier N, Czernichow S, et.al. Transient elastography as a screening tool for liver fibrosis and cirrhosis in a community-based population aged over 45 years. Gut. 2011;60:977-84. PMID: 21068129.
13 You SC, Kim KJ, Kim SU, Kim BK, Park JY, Kim DY, et.al. Factors associated with significant liver fibrosis assessed using transient elastography in general population. World J Gastro-enterol. 2015;21:1158-66. PMID: 25632188.
14 Cheng PN, Chiu YC, Chiu HC, Chien SC. The Application of Liver Stiffness Measurement in Residents Without Overt Liver Diseases Through a Community-Based Screening Pro-gram. Medicine (Baltimore). 2016;95:e3193. PMID: 27015215. 15 Gines P, Graupera I, Lammert F, Angeli P, Caballeria L, Krag
A, et al. Screening for liver fi brosis in the general population:a call for action. Lancet Gastroenterol Hepatol. 2017;1:256-60. DOI: 10.1016/S2468-1253(16)30081-4.
16 Carvalhana S, Leitão J, Alves AC, Bourbon M, Cortez-Pinto H. How good is controlled attenuation parameter and fatty liver index for assessing liver steatosis in general population: correlation with ultrasound. Liver Int. 2014;34:e111-7. PMID: 24034415.
17 The Japanese Society of Gastrointestinal Cancer Screening. Guideline for Abdominal Ultrasound Cancer Screening. J Gastrointestinal Cancer Screen. 2011;49:667-85. Japanese. 18 Okanoue T, Saibara T, Ono M, Sumida Y, Hashimoto E,
Tamura S, et al. JSH Consensus Kobe 2009; Diagnosis and Treatment of NASH. Kanzo. 2009;50:741-7. DOI: 10.2957/ kanzo.50.741. Japanese.
19 Blackmon SH, Feinglass SR. The United States Preventive Services Task Force recommendations for lung cancer screen-ing. Thorac Surg Clin. 2015;25:199-203. PMID: 25901563 20 Ziol M, Handra-Luca A, Kettaneh A, Christidis C, Mal F,
Kazemi F, et al. Noninvasive assessment of liver fibrosis by measurement of stiffness in patients with chronic hepatitis C.Hepatology. 2005;41:48-54. PMID: 15690481
21 Castera L, Forns X, Alberti A. Non-invasive evaluation of liv-er fibrosis using transient elastography.J Hepatol. 2008;48:835-47. PMID: 18334275.
22 Onodera H, Shibuya D, Iwasaki T, Nishino Y, Matsui A, Ono H, et al. Evaluation of upper abdominal screening using ultrasonography by calculating the observed and relative survival rates. Nihon Shoukaki Gan Kenshin Gakkai zasshi. 2008;46;35-45. DOI: 10.11404/jsgcs.46.35. Japanese.
23 Wong GL. Transient elastography: Kill two birds with one stone? World J Hepatol. 2013;5:264-74. PMID: 23717737. 24 Shi KQ, Tang JZ, Zhu XL, Ying L, Li DW, Gao J, et al.
Con-trolled attenuation parameter for the detection of steatosis severity in chronic liver disease: a meta-analysis of diagnostic accuracy. J Gastroenterol Hepatol. 2014;29:1149-58. DOI: 10.1111/jgh.12519. PMID: 24476011.
25 Petta S, Wai-Sun Wong V, Cammà C, Hiriart JB, Wong GL, Marra F, et.al. Improved Noninvasive prediction of Liver Fibrosis by Liver Stiffness Measurement in Patients with Non-alcoholic Fatty Liver Disease Accounting for Controlled At-tenuation Parameter Values. Hepatology. 2016 Sep 17. PMID:
27639088.
26 El-Zayadi AR. Heavy smoking and liver. World J Gastroenter-ol. 2006;12:6098-101. PMID: 17036378.
27 Zein CO, Unalp A, Colvin R, Liu YC, McCullough AJ; Nonalcoholic Steatohepatitis Clinical Research Network. Smoking and severity of hepatic fibrosis in nonalcoholic fatty liver disease. J Hepatol. 2011;54:753-9. PMID: 21126792. 28 Michopoulos S, Chouzouri VI, Manios ED, Grapsa E,
Antoniou Z, Papadimitriou CA, et.al. Untreated newly diag-nosed essential hypertension is associated with nonalcoholic fatty liver disease in a population of a hypertensive center. Clin Exp Gastroenterol. 2016;9:1-9. PMID: 26834493. 29 Wang Y, Zeng Y, Lin C, Chen Z. Hypertension and
Nonalco-holic Fatty Liver Disease Proven by Transient Elastography. Hepatol Res. 2016;46:1304-10. PMID: 26932594.
30 Sarafidis PA, Bakris GL. Non-esterified fatty acids and blood pressure elevation: a mechanism for hypertension in subjects with obesity/insulin resistance? J Hum Hypertens. 2007;21:12-9. PMID: 17051236.
31 Putnam K, Shoemaker R, Yiannikouris F, Cassis LA. The renin-angiotensin system: a target of and contributor to dyslip-idemias, altered glucose homeostasis, and hypertension of the metabolic syndrome. Am J Physiol Heart Circ Physiol. 2012; 302: H1219-30. PMID: 22227126.
32 Pereira RM, dos Santos RA, da Costa Dias FL, Teixeira MM, Simões e Silva AC. Renin-angiotensin system in the patho-genesis of liver fibrosis. World J Gastroenterol. 2009;15:2579-86. PMID: 1949612009;15:2579-86.
33 de Lédinghen V, Wong VW, Vergniol J, Wong GL, Foucher J, Chu SH, et.al. Diagnosis of liver fibrosis and cirrhosis us-ing liver stiffness measurement: comparison between M and XL probe of FibroScan®. J Hepatol. 2012;56:833-9. PMID: 22173167.