NANZAN REVIEW OF AMERICAN STUDIES Volume 37 (2015): 119-133
From Dynamic Ghetto to Hyper-Ghetto:
My research on the “Chicago Black Ghetto” and
African-Americans Now
TAKENAKA Koji*
It was April 4, 1968, I was a sophomore and had just begun to study American history and African-American history at the university, when a well-known leader of the Civil Rights movement, Martin Luther King, Jr. was assassinated in Memphis, Tennessee. After that terrible event, the key word of my study became “African-American.”
I: What I wanted to say in Social History of the Rising Chicago Black Ghetto . 1
To discuss why Chicago African-American Ghetto had emerged, I divided my book into two parts.
In the first part, I traced the socio-economic changes in the South and the North that were triggered by the Boll-weevil, floods and then drought―the Great Migration that resulted during World War I. Before the Great Migration, almost all African-Americans lived in the South; by 1900, however, the percent of African-Americans who lived there had fallen to less than 90. During World War I, African-Americans moved into the large industrial cities in the North directly or indirectly from the South: for instance, to New York, Philadelphia, Baltimore and Chicago.2
In terms of Chicago, the African-American population rose to 109,458, 4.1 percent of Chicago’s population, by 1920. Among the top ten largest cities, in terms of the rate of increase in the population of African-Americans, between 1910 and 1920, Chicago had the greatest, 148.2 percent.3
* Professor Emeritus of Tohoku University, Sendai Japan [takenakak@m.tohoku.ac.jp]. This article is based on a lecture on July 11, 2015, at the Center for Amrican Studies, Nanzan University, Nagoya.
1. Takenaka Koji, Shikago Kokujin Geto Seiritsu no Shakaishi , 竹中興慈『シカゴ黒人 ゲトー成立の社会史』明石書店 , [A Social History of the Making of the Chicago Black Ghetto] (Tokyo: Akashishoten, 1995).
2. U.S. Bureau of the Census, Negro Population, 1790 ― 1915 (Washington D.C.: G.P.O., 1918), 33, 50 ― 59; Fourteenth Census (1920) , Vol. 2 (Washington D.C.: G.P.O., 1923), 19.
3. U.S. Bureau of the Census, Negro Population, 1790 ― 1915 (Washington D.C.: G.P.O., 1918), 50 ― 59.
African-American men who moved into Chicago had jobs in the “manufacturing and mechanical industries.” They worked as laborers or semiskilled operatives in the slaughter and packing houses or iron and steel industries; 41.3 percent of all African-Americans worked in the slaughter and packing houses and 15.9 percent in the iron and steel industries. They could not get those occupations in the South. African-American women also got jobs in the slaughter and packing houses; 31.8 percent of all African-American women in Chicago were semiskilled or laborer in the “manufacturing and mechanical industries,” by 1920.4
African-Americans who found jobs in Chicago then needed to find dwellings. During the Great Migration, at first they entered the narrow “Back Belt,” but as more African-Americans arrived, the living area had to be extended. Expansion, however, was possible only to the east and south. To the north of the Black Belt, commercial companies and light industries were pressing downward. Just west of the Black Belt, the Rock Island Railroad ran and formed a boundary between the African-American area and an area where Italian or Irish immigrants already lived. In the east, they were fenced in by Lake Michigan. 5
Those African-American who “intruded” into white communities were not working class but middle class in the African-American community, and they were always in danger being bombed out of their newly bought houses. The identities of the attackers was a secret that was known only to realtors. 6 The other
way of deterring the expansion of the Black Belt was the “restrictive covenants,” a phenomenon that spread in the 1920s and did not depend on the law or violence. The residents of certain white communities agree to not accept African-American residents, a practice legitimized in 1926 by the U.S. Supreme Court. The “restrictive covenants” also had deeply rooted links to the realtors in Chicago. By the request of the Chicago Real Estate Board, a model plan was drafted by Nathan William MacChesney, a man who had formerly dwelled in Hyde Park-Kenwood and was general counsel to the National Association of Real Estate Boards.7
Of course, realtors in Chicago had more than a small responsibility for making 4. U.S. Bureau of the Census, Thirteenth Census (1910) , Vol. 4 (Washington D.C.: G.P.O., 1914), 544 ― 47; Fourteenth Census (1920) , Vol. 4 (Washington D.C.: G.P.O., 1924), 1076 ― 80.
5. Thomas Lee Philpott, The Slum and Ghetto: Neighborhood Deterioration and
Middle-Class Reform, Chicago, 1880 ― 1930 (New York: Oxford University Press, 1978), 119 ― 127;
Allan H. Spear, Black Chicago: The Making of a Negro Ghetto (Chicago: The University of Chicago Press, 1967), 14 ― 19.
6. The Chicago Defender , June 1, May 28, September 28, 1918; Chicago Commission on
Race Relations, The Negro in Chicago: A Study of Race Relations and Race Riot in 1919 ([orig. 1922], New York: Arno Press, 1968), 3, 53, 55 ― 57, 122 ― 23, 132; William M. Tuttle, Jr., Race
Riot: Chicago in Red Summer of 1919 (New York: Atheneum, 1978), 182.
7. Thomas Lee Philpott, op. cit. , 185, 189 ― 96; St. Clair Drake and Horace Cayton, Black
Chicago’s African-American ghetto. Their activity was backed by the consent, tacit or open, and understanding or support of the whole Chicago white community.
In the second part of my book, I wanted to discuss the fresh dynamism in the newly built Chicago African-American community. Although the first blow to segregate them into the “Black Belt” was given by Chicago’s white society, support which has persisted since then, African Americans who decided to live in the ghettos made the most of it.
Once an African-American society had emerged, they experienced many dynamic changes in their communities. Compared to white society, stratification in the African-American society was small in scale, but as a segregated African American community emerged, many chose neighborhoods divided by class. 8
The Chicago African-American ghetto could not be organized until the lower class of African-Americans got stability in their lives. Although African-American families lived with an constant uncertainty, to bring stability to their lives in Chicago, each family member played a very important role, as had been the custom since slavery. Many wives of lower class men worked outside the home and helped the family budget by managing a boarding house or preparing meals. Children from 13 to 15 years of age contributed to the family budget by working after school or during summer holidays at such jobs as selling newspapers, peddling, delivering parcels, or being a messenger boy, mail boy, janitor or clerk. African-American girls found jobs as long-hand entry clerks, typists, checkers, routers, and adding-machine operators. 9
Comparing to other Northern big cities, oppression from white Chicago was so violent that African-Americans in this city were forced to pack densely into the South Side. As a result, Chicago’s African-American ghetto became the most densely populated community in the U.S.. This condition effected many aspects of their lives. Firstly, they could develop their business by themselves serving African-Americans rather than catering to white customers. This helped to foster “self-help” and “Black-Consciousness” in the African-American community in the South Side.10
8. Franklin E. Frazier, The Negro Family in Chicago (Chicago: The University of Chicago Press, 1932), 100 ― 18, 132, 276; U.S. Bureau of the Census, Negroes in the United States,
1920 ― 32 ([orig. 1935], Westport: Greenwood Press, 1969), 257.
9. Chicago Commission on Race Relations, op. cit. , 160; Izada P. Comstock, “Chicago Housing Conditions, VI: The Problem of the Negro,” American Journal of Sociology , 18 (September 1912): 245, 253; Leila Houghteling, The Income and Standard Living of Unskilled
Laborers in Chicago (Chicago: The University of Chicago Press, 1927), 50, 64; Chicago
Commission on Race Relations, op. cit. , 162 ― 65; Irene Graham, “Family Support and Dependency among Chicago Negroes: A Study of Unpublished Census Data,” The Social
Service Review , Vol. 3 ― 4 (December 1929): 548.
Secondly, to activate the South Side community, many churches, such as the African-American Baptists, Methodists, Presbyterians and so on, played an important role and helped newcomers to Chicago get accustomed to life on the South Side. At those times when almost the entire population of a rural village in the South came to the South Side, the clergymen or preachers of African-American churches also came with them and so they also brought their customary religious practices to the South Side. They worked as a laborer in a packing house during the day, but presided over the mid-week prayer at night or a church ceremony on Sunday.11
Thirdly, at the beginning of the twentieth century there were many clergymen with clear-cut personalities on the South Side. For example, there were Reverdy C. Ransom of Bethel African Methodist Episcopal (A.M.E.) Church, Elijah J. Fisher of Olivet Baptist Church, Archibald J. Carey of Quinn Chapel A.M.E. Church, Bethel A.M.E. Church, and Institutional Church, and so on. They all competed, and they even antagonized each other. However, they did bridge the gap between the congregations of their churches and politics in Chicago city politics, as well as the Illinois state legislature, until professional politicians firmly emerged to take them in hand. 12
The African-American in the South Side had a chance to participate in politics that they had been deprived of in the South at that time. They enjoyed more political power in Chicago than any other big Northern city. They voted for candidates for the mayor of Chicago, the Illinois House of Representatives, and Senator. Compared to other cities, they elected many politicians, even in the early days at the “nadir” of American history. 13
In 1876, they elected an African-American member to the Illinois House of Representatives. Since 1882, they continually sent their candidate to the Illinois legislature. In 1914, they sent two representatives to Springfield. In the same year, Oscar De Priest was elected as the first African-American alderman of the Chicago assembly. In 1918, they sent three representatives to the Illinois state legislature, and in 1924, four. In 1928, there were five. And also in 1928, Oscar De Priest became the first African-American Congressman who was elected in the North. It is from this tough Chicago political tradition that Barack Obama came from when he was elected as 44th President of the United States. 14
11. The Chicago Defender , March 10, 1917; Emmet J. Scott, Negro Migration During the War ([orig. 1920], New York: Arno Press, 1969), 40; Benjamin Elijah Mays and Joseph
William Nicholson, The Negro’s Church ([orig. 1933], Salem: Ayer Co., 1988), 225; Robert Lee Sutherland, “An Analysis of Negro Churches in Chicago,” (Ph. D. Dissertation, The University of Chicago, 1930), 16; Takenaka Koji, op. cit. , Chapter 8, 339 ― 60.
12. Takenaka Koji, op. cit. , Chapter 9, 361 ― 91.
13. Rayford Logan first used the term “ nadir ” to describe this period in his 1954 book The
Negro in American Life and Thought: The Nadir, 1877 ― 1901 .
I wanted to discuss in my book that the Chicago African-American ghetto was not just an area where African-American citizens lived densely, but an area where the dynamism of the African-American emerged, and emerged as a result of white society’s attempts to violently confine them. So the African-American ghetto in Chicago derived from not just one factor but many factors̶and from causes in both the white community and the African-American community. It was a structural product that made from factors of race, class, and culture. Therefore to solve the problems of the ghetto, it is absolutely necessary to apply a multidimensional plan.
II: What I found after Social History of the Rising Chicago Black Ghetto
The most striking fact I found after I wrote my book was that the dynamism of Chicago African-American ghetto was being lost year by year. In response, I began to research the source of the phenomenon. As a result, I wrote three papers. The first one was “Present Conditions of African-American s in the Northern Metropolitan Cities.”15
The second was “Chicago Mayoral Election in 1989: The Uncompleted African-American Administration of Harold Washington,” 16
and the third, “Working Poor: Worsening Poverty and Inequality in Recent America.”17
At first I analyzed many indexes of economic conditions to check the widening gap between whites and African-Americans in 1970s and 1980s.
Table 1 shows the “Percentage of African-American Families Receiving Incomes In Selected Ranges.” At first, as this table clearly shows, between 1970 and 1987 the disintegration of middle class occurred in both races in the United States. In the “10,000 ― 34,999” range, whites decreased from 51.8 percent in 1970 to 45.1 percent in 1987 and African-Americans decreased from 56.6 to 47.7
of Negro Politics in Chicago ([orig. 1935], Chicago: The University of Chicago Press, 1969),
170; Charles Russel Branham, “The Transformation of Black Political Leadership in Chicago, 1864 ― 1942,” (Ph. D. Dissertation, The University of Chicago, 1981), 86, 89; Takenaka Koji, op. cit. , Chapter 10, 393 ― 453.
15. Takenaka Koji, “Amerika Kokujin no Genjo: Hokubu Daitoshi wo Chusin ni site,” 竹 中興慈「アメリカ黒人の現状──北部大都市を中心にして」『北九州大学外国語学部 紀要』, [Present Conditions of African-Americans in the Northern Metropolitan Cities], Kitakyushu Univ. Gaikokugogakubu Kiyo , 69 (Kitakyushu Univ., 1990), 1 ― 42.
16. Takenaka Koji, “1989nen Shicago Shicyosenkyo: Mikan no Kokujin Shisei,” 竹中興慈
「1989 年シカゴ市長選挙──未完の黒人市政」『北九州大学外国語学部紀要』, [Chicago
Mayoral Election in 1989: The Uncompleted African-American Administration of Harold Washington] Kitakyushu Univ. Gaikokugogakubu Kiyo , 70 (Kitakyushu Univ., 1990), 61 ― 116. 17. Takenaka Koji, “Wakingu Pua: Shinkokuka suru Gendai Amerika no Hinkon to Hubyodo,” 竹中興慈「ワーキングプアー:深刻化する現代アメリカの貧困と不平等」 『国際文化研究科論集』,(東北大学),[Working Poor: Worsening Poverty and Inequality in Recent America], Kokusaibunka Kenkyuka Ronshu , 6 (Tohoku Univ., 1998), 35 ― 54.
percent. Compared to whites, African-Americans dropped downward more severely. That is, the rate of disintegration was sharper for African-Americans than for whites. African-Americans who earn “Under 5,000” dollars increased from 9.0 percent in 1970 to 13.5 percent in 1987. During the same period, the rate for whites only increased from 2.9 percent to 3.2. Similarly between 1970 and 1987, the range of “More Than 35,000” among whites increased to 7.1, but among African-Americans it is 4.6 percent. The range of “More Than 50,000” increase rate for whites is also much higher than for African-Americans. Although African-Americans only increased to 3.8 percent, whites increased to 8.0 percent during the same period.
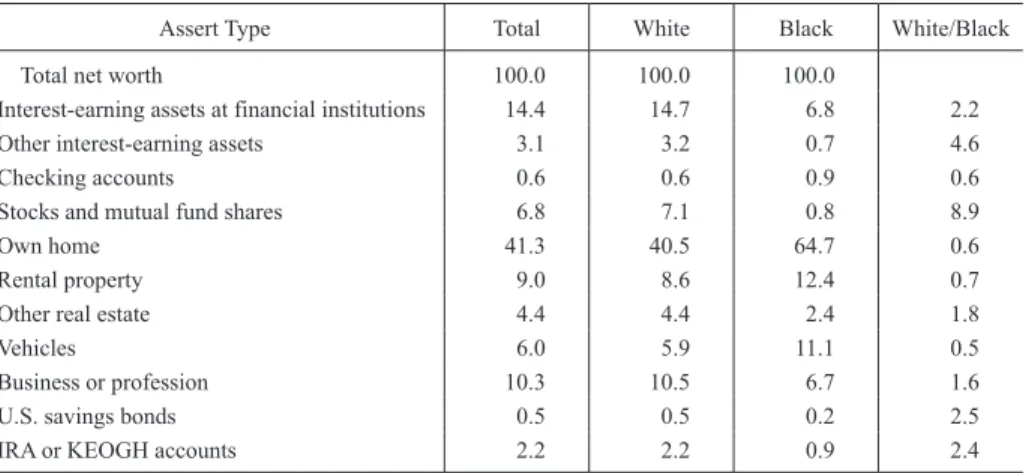
What kind of assets did they have? On table 2, you will see that in 1984 whites have a variety of assets from “Own home,” “Interest earning assets at financial institutions,” “Business or profession,” “Rental property,” to “U.S. savings bonds.”
Table 1. Percentage of Black Families Receiving Incomes in Selected Ranges
1987 1986 1978 1970
Black White Black White Black White Black White Under 5,000 Less Than 10,000 10,000―34,999 More Than 35,000 More Than 50,000 13.5 30.0 47.7 22.3 9.5 3.2 9.3 45.1 45.7 24.4 13.4 29.3 48.2 22.5 9.5 3.3 9.8 45.7 44.5 23.7 8.4 26.6 51.7 21.7 8.5 2.4 8.5 47.7 43.8 21.1 9.0 25.7 56.6 17.7 5.7 2.9 9.6 51.8 38.6 16.4 Source: David H. Swinton, “Economic Status of Black Americans,” Janet Dewart ed., The
State of Black America 1989 (New York; National Urban League Inc., 1989), 15.
Table 2. Distribution of Net Worth by Race of Householder and Assert Type in 1984
Assert Type Total White Black White/Black
Total net worth 100.0 100.0 100.0
Interest-earning assets at financial institutions 14.4 14.7 6.8 2.2 Other interest-earning assets 3.1 3.2 0.7 4.6
Checking accounts 0.6 0.6 0.9 0.6
Stocks and mutual fund shares 6.8 7.1 0.8 8.9
Own home 41.3 40.5 64.7 0.6
Rental property 9.0 8.6 12.4 0.7
Other real estate 4.4 4.4 2.4 1.8
Vehicles 6.0 5.9 11.1 0.5
Business or profession 10.3 10.5 6.7 1.6
U.S. savings bonds 0.5 0.5 0.2 2.5
IRA or KEOGH accounts 2.2 2.2 0.9 2.4
Source: U.S. Bureau of the Census, Household Wealth and Asset Ownership: 1984 Data from the Survey of
Income and Program Participation, Household Economic Studies Series P―70, No.7 (Washington
D.C.: U.S. G.P.O., 1986), 5. Extracted from Table H and the number of White/Black are calculated by the author.
But in the case of African-Americans, assets are restricted to primarily three: “Own home,” “Rental property,” and “Motor vehicles.” The same situation continued in the 1990s.
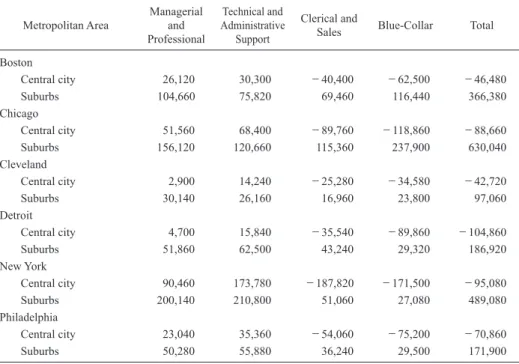
One of the possible reasons why the declining condition of African-Americans intensified after the 1970s was the suburbanization of work. Since the 1970s almost all metropolitan areas lost great numbers of jobs in fields that had traditionally employed African-Americans. You will see the extreme fluctuations of employment in the Northern Metropolitan areas on Table 3. It is an easy task to find the occupation that gained numbers in the “Central city” in all six cities― they were “Managerial and Professional,” and “Technical and Administrative Support,” occupations which require higher education. In contrast, the occupations that decreased in “Central city” were “Clerical and Sales” and “Blue Collar,” occupations which do not necessarily require higher skill-sets. In contrast, “Clerical and Sales” and “Blue Collar” in the “Suburbs” sharply increased. In the case of Chicago, the number of jobs in “Clerical and Sales” fell by 89,760 in the “Central City”, but increased by 115,360 in the “Suburbs”; the number of “Blue-Collar” jobs decreased by 118,860 in the “Central City” but increased by 237,900 in the “Suburbs” between 1970 and 1980.
Extreme fluctuation in “Blue Collar” occurred in the “Central City” and
Table 3. Change in Number of Jobs in Selected Central Cities and Suburban Rings, by Occupational Sector, 1970―80 Metropolitan Area Managerial and Professional Technical and Administrative Support Clerical and
Sales Blue-Collar Total Boston Central city Suburbs Chicago Central city Suburbs Cleveland Central city Suburbs Detroit Central city Suburbs New York Central city Suburbs Philadelphia Central city Suburbs 26,120 104,660 51,560 156,120 2,900 30,140 4,700 51,860 90,460 200,140 23,040 50,280 30,300 75,820 68,400 120,660 14,240 26,160 15,840 62,500 173,780 210,800 35,360 55,880 −40,400 69,460 −89,760 115,360 −25,280 16,960 −35,540 43,240 −187,820 51,060 −54,060 36,240 −62,500 116,440 −118,860 237,900 −34,580 23,800 −89,860 29,320 −171,500 27,080 −75,200 29,500 −46,480 366,380 −88,660 630,040 −42,720 97,060 −104,860 186,920 −95,080 489,080 −70,860 171,900 Source: John Kasarda, “Urban Industrial Transition and the Underclass,” ANNALS, 501 (Januarary, 1989): 29.
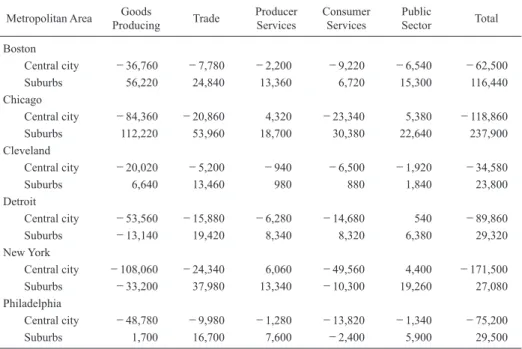
“Suburbs” between 1970 and 1980. On Table 4, there were several occupations that gained numbers in the “Central city.” These are “Producer Services” in Chicago and “Public Sector” in Detroit and New York. But the amount of increase of these occupations was small and did not compensate for the trend of suburbanization of “Blue Collar” jobs. In Chicago, “Goods Producing” decreased by 84,360 in the “Central city” but increased by 112,220 in the “Suburbs.” “Trade” decreased by 20,860 in the “Central city” but increased by 53,960 in the “Suburbs.” And “Consumer Services” decreased by 23,340 in the “Central city” but increased by 30,380 in the “Suburbs.”
Among occupations that grew in number were “Managerial and Professional” and “Technical and Administrative Support.” If African-Americans wanted to enter these occupations in the central city of Chicago however, they needed educational qualifications at least beyond high school. This requirement proved too high for many of the African-American in the ghetto. The expected educational level of jobs also changed precipitously between 1970 and 1980. In Chicago jobs that asked for “less than high school” education dropped by 211,400 (−41.8 percent), “high school only” decreased by 81,020 (−18.6 percent), “some college” increased by 91,320 (+43.9 percent), and “college graduate” increased
Table 4. Change in Number of Blue-Collar Jobs in Selected Central Cities and Suburban Rings, by Industrial Sector, 1970―80
Metropolitan Area ProducingGoods Trade Producer Services Consumer Services Public Sector Total Boston Central city Suburbs Chicago Central city Suburbs Cleveland Central city Suburbs Detroit Central city Suburbs New York Central city Suburbs Philadelphia Central city Suburbs −36,760 56,220 −84,360 112,220 −20,020 6,640 −53,560 −13,140 −108,060 −33,200 −48,780 1,700 −7,780 24,840 −20,860 53,960 −5,200 13,460 −15,880 19,420 −24,340 37,980 −9,980 16,700 −2,200 13,360 4,320 18,700 −940 980 −6,280 8,340 6,060 13,340 −1,280 7,600 −9,220 6,720 −23,340 30,380 −6,500 880 −14,680 8,320 −49,560 −10,300 −13,820 −2,400 −6,540 15,300 5,380 22,640 −1,920 1,840 540 6,380 4,400 19,260 −1,340 5,900 −62,500 116,440 −118,860 237,900 −34,580 23,800 −89,860 29,320 −171,500 27,080 −75,200 29,500 Source: John Kasarda, “Urban Industrial Transition and the Underclass,” ANNALS, 501 (Januarary, 1989): 30.
by 112,500 (+56.7). 18
As a result, intense maldistribution of unemployment occurred in Chicago communities between 1970 and 1980. Figure 1 shows “Unemployment rates in Chicago Community Areas, 1970 and 1980.” Comparing the figures for 1970 to 1980, it is too easy to confirm the increase in the number of areas with higher unemployment. In 1970, the unemployment rate was “15 ― 19%” in only one area. By 1980, however, the number of areas with an unemployment rate of “20% and over” had increased to ten.
These areas where the unemployment rate was “20% and over” almost duplicated the “Poverty areas” in Figure 2. The number of areas with “more than 40 percent households below poverty level” increased from one in 1970 to nine in 1980. Unfortunately these areas were “the historic heart of Chicago’s black ghetto.”19
It is significant to remember that this severe phenomenon was deeply related to 18. Table 3 in John Kasarda, “Urban Industrial Transition and Underclass,” ANNALS , 501 (January, 1989): 31.
19. Loc J.D. Wacquant and William Julius Wilson, “The Cost of Racial and Class Exclusion in the Inner City,” ANNALS , 501 (January 1989): 16.
Unemployment rates in Chicago Community Areas, 1970.
Unemployment rates in Chicago Community Areas, 1980.
Figure 1
Source: William Julius Wilson, The Truly Disadvantaged: The Inner City, the Underclass, and Public Policy (Chicago: The University of Chicago Press, 1987), 51, 52.
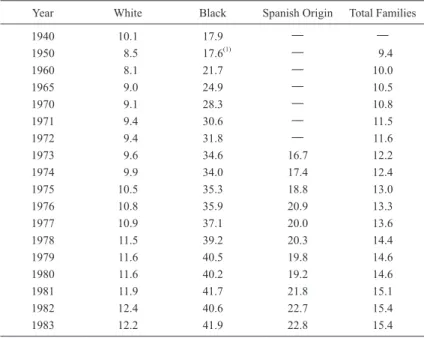
feminization of poverty. Table 5 shows that the percentage of female-headed African-American families increased from 30.6 percent in 1971 to 41.9 percent in 1983; in the case of whites it increased from 9.4 to 12.2 over the same period. In Chicago, as Table 6 shows, “Female-Headed Families” dramatically increased between 1970 and 1980 in both West Side and South Side; for example, the rate in the Near West Side jumped from 37 percent to 66 percent, and in Oakland from 48 percent to 79 percent. The feminization of poverty was synonymous with the povertization of African-American children.
Wacquant and Wilson said “these low-poverty areas can be considered as roughly representative of the average non-ghetto, non-middle-class, black neighborhood of Chicago. In point of fact, nearly all―97 percent―of the respondents in this category reside outside traditional ghetto areas.” These African-Americans used to live in the traditional ghetto areas and supported such basic institutions as African-American churches, schools, stores, and recreational facilities. But they no longer lived in “the historic heart of Chicago’s black ghetto.”20
This situation had considerable repercussions, particularly to the “the degree of isolation,” of the traditional African-American communities. Residents of these 20. Ibid.
Chicago Community Poverty Areas, 1970. Chicago Community Poverty Areas, 1980. Figure 2
Source: William Julius Wilson, The Truly Disadvantaged: The Inner City, the Underclass, and Public Policy (Chicago: The University of Chicago Press, 1987), 53, 54.
Table 5. Percentage of Female-Headed Families, No Husband Present, by Race and Spanish Origin, 1940―1983
Year White Black Spanish Origin Total Families
1940 10.1 17.9 ― ― 1950 8.5 17.6(1) ― 9.4 1960 8.1 21.7 ― 10.0 1965 9.0 24.9 ― 10.5 1970 9.1 28.3 ― 10.8 1971 9.4 30.6 ― 11.5 1972 9.4 31.8 ― 11.6 1973 9.6 34.6 16.7 12.2 1974 9.9 34.0 17.4 12.4 1975 10.5 35.3 18.8 13.0 1976 10.8 35.9 20.9 13.3 1977 10.9 37.1 20.0 13.6 1978 11.5 39.2 20.3 14.4 1979 11.6 40.5 19.8 14.6 1980 11.6 40.2 19.2 14.6 1981 11.9 41.7 21.8 15.1 1982 12.4 40.6 22.7 15.4 1983 12.2 41.9 22.8 15.4
(1) Black and other.
Source: William Julius Wilson, The Truly Disadvantaged: The Inner City, the Underclass,
and Public Policy (Chicago: The University of Chicago Press, 1987), 65.
Table 6. Selected Characteristics of Chicago’s Ghetto Neighborhood, 1970―80
Area Families below Poverty Line (percentage) Unemployed (percentage) Female-Headed Families (percentage) 1970 1980 1970 1980 1970 1980 West Side
Near West Side East Garfield Park North Lawndale West Garfield Park South Side
Oakland Grand Boulevard Washington Park Near South Side
35 32 30 25 44 37 28 37 47 40 40 37 61 51 43 43 8 8 9 8 13 10 8 7 16 21 20 21 30 24 21 20 37 34 33 29 48 40 35 41 66 61 61 58 79 76 70 76 Source: Loc J.D. Wacquant and William Julius Wilson, “The Cost of Racial and Class
Exclusion in the Inner City,” ANNALS, 501 (January, 1989): 12. Partly extracted by the author.
impoverished areas lacked contact or sustained interaction with individuals and institutions that usually represent mainstream society. “Even in those situations where job vacancies became available in an industry near or within an inner-city neighborhood,” they could not find the job, because they were “not tied into the job network.” 21
Underclass African-Americans had no social network. They had neither a current partner nor a person who would qualify as a best friend. They lacked “a block club or a community organization, a political party, a school related association, or a sports, fraternal, or other social group.” 22
The stratification of African-Americans broke up dynamic African-American communities; as a result, the underclass in the Chicago African-American ghetto was severed from mainstream society and at the same time contained into an African-American “hyper-ghetto.”
III: The Cellphone camera “Revolution”
Until the 1990s, white and/or upper-class society completely succeeded in segregating “the unwelcomed members” of the U.S. society into the African-American ghetto. During that period, they could forget it for a while. There was no real concern, for example, that, compared to the rate of African-American population in the United States (12.6 percent in 2010), the disparity in the rate of “Jail Inmates” by race is strikingly high (42.5 percent in 1990, 40.3 percent in 2000, and 39.16 percent in 2009). 23
Communities outside of the “hyper-ghetto” apparently did not care; as long as crime remained isolated in certain parts of the metropolitan area and its vicinity, or certain nonmetropolitan counties, it could be ignored.
Recently, however, seams of “hyper-ghetto” have popped open here and there. Almost simultaneously, on November 24, 2014 and December 3, 2014, two grand juries decided not to indict policemen who killed an African-American.24
The first 21. William Julius Wilson, The Truly Disadvantaged: The Inner City, the Underclass, and
Public Policy (Chicago: The University of Chicago Press, 1987), 65.
22. Loc J.D. Wacquant and William Julius Wilson, op. cit. : 23, 24.
23. U.S. Bureau of the Census, “Table 19. Resident Population by Race and State: 2010,” Statistical Abstracts of the United States, 2012, Population , 25, http://www.census.gov/ compendia/statab/cats/population.html (accessed August 19, 2015); Jail inmates rates are calculated by the author from “Table 349. Jail Inmates by Sex, Race and Hispanic Origin: 1990 to 2009,” Statistical Abstracts of the United States, 2012, Law Enforcement, Courts, and Prisons , 218, http://www.census.gov/compendia/statab/cats/population.html (accessed August 19, 2015).
24. Fox News. “Gunshot, looting after grand jury in Ferguson case does not indict officer in Michael Brown shooting .” http://www.foxnews.com/us/2014/11/25/ferguson-grand-jury-decision/ (accessed August 26, 2015); Lauren Gambino, “Eric Garner: grand jury declines to indict NYPD officer over chokehold death,” The Guardian,
http://www.theguardian.com/us-one was the shooting of Michel Brown in Ferguson, Missouri, a suburb of St. Louis on August 9, 2014. The second was the chokehold death of Eric Garner at Staten Island, New York, New York on July 17, 1914. Even before these grand jury decisions, on November 22, 2014, Tamir Rice, a 12-year-old unarmed African-American boy, was shot and killed by a Cleveland, Ohio, police officer, Timothy Loehmann.25
Just after the shooting of Michael Brown―an 18-year-old African-American man―by Darren Wilson, 28, a white Ferguson police officer, protests and civil unrest occurred and received considerable attention in the U.S. and abroad. Although even at that time everyone knew that shortly before he was shot to death, Brown stole cigarillos from a nearby convenience store, the most important fact, for protesters, was that he was unarmed. 26
Eric Garner, 43, died on July 17 just after New York police officer Daniel Pantaleo placed him in a chokehold while he and other officers attempted to take him into custody on suspicion of “selling untaxed cigarettes.” 27
Because Garner had been arrested more than 30 times since 1980, the police officer who found him inside of the police car, Daniel Pantaleo, knew him well. On the other hand, “Pantaleo was the subject of two civil rights lawsuits in 2013 where plaintiffs accused him of falsely arresting them and abusing them. In one of the cases, he and other officers allegedly ordered two African-American men to strip naked on the street for a search and the charges against the men were dismissed.”28
After Pantaleo removed his arm from Garner’s neck, he pushed Garner’s face into the ground. Garner repeated “I can’t breathe” eleven times while lying face down on the sidewalk. These final words became a rallying cry for a protest movement.
More than twenty years ago, a videotape that was shot by a neighbor became an instant sensation, and was aired numerous times. That videotape showed Rodney King being beaten repeatedly and obstinately by Los Angeles Police Department officers. In that case too, a jury acquitted four police officers. The acquittals are generally considered to have triggered the 1992 Los Angeles riots. When these officers went to trial, the videotape of the incident was used as news/2014/dec/03/eric-garner-grand-jury-declines-indict-nypd-chokehold-death (accessed August 20, 2015).
25. Richard Perez-Pena and Mitch Smith, “Cleveland Judge Finds Probable Cause to Charge Officers in Tamir Rice Death,” The New York Times, http://www.nytimes.com/2015/06/12/us/ judge-finds-probable-cause-to-charge-officers-in-tamir-rice-death.html?_r=0 (accessed June 17, 2015).
26. Wikipedia, “Shooting of Michael Brown,” https://en.wikipedia.org/wiki/Shooting_of_ Michael_Brown (accessed June 18, 2015).
27. Lauren Gambino, op. cit .
28. Wikipedia, “Death of Eric Garner,” https://en.wikipedia.org/wiki/Death_of_Eric_ Garner (accessed August 20, 2015).
important reference.29
In recent years, it is a commonplace to have a cellphone with a function of camera. Therefore anyone who has a cellphone available can very easily take a moving image, even with sound. And the ordinary residents who live in the “hyper-ghetto” can shoot events extremely easily. Everyone is able to access the internet to see the videotape or to contribute their own images. This means that authorities have less and less chance to hide what truly happened, in contrast to the way they used to do very often in the past.
In Rodney King’s case, videotape played a very important role in attracting the people who sought justice. In the Tamir Rice case, there was a videotape that every one could see on the internet at any time. In Michel Brown’s case in Ferguson, there was no videotape, but just after the incident, peaceful protests and civil disorders broke out anyway. On March 4, 2015, when the U.S. Department of Justice announced that the officer would not be charged in the shooting, not only domestic but also international reactions were seen on a variety of media in many countries. In the case of Eric Garner at New York, you could see a videotape on the internet, too. Domestic and foreign interest would not tolerate hiding the truth.
In the end, I need to discuss an additional event that happened on June 17, 2015 at the Emanuel African Methodist Episcopal Church in Charleston, South Carolina. A young white gunman, Dylann Roof, 21-years-old, opened fire at the church and killed nine people there; he was later indicted on federal hate crime charges. According to The New York Times, he “spat on and burned the American flag, but waved the Confederate.” In a “manifesto” on his website, Roof “criticized African-Americans as being inferior while lamenting the cowardice of flight.”30
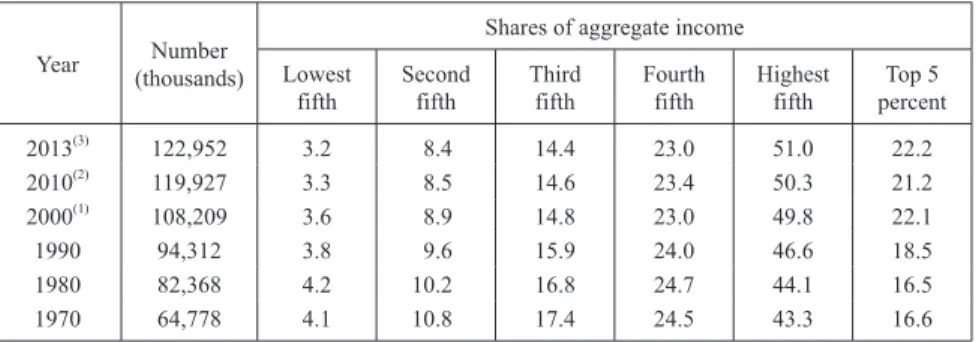
It is not enough to condemn the crime that the suspect, Roof, committed. It would not be useless to think about the economic distress and mental irritation of lower class whites. Roof, born in South Carolina, grew up a child of divorced parents and was said to have dropped out in the ninth grade. A little thought reminds us that this is almost the same situation that African-American kids experience in the “hyper-ghetto.” I discussed above only the inferior condition of African-Americans in the “hyper-ghetto.” Table 7 seems to show the distress in the lives of U.S. citizens becoming worse year by year regardless of race. The 29. Wikipedia, “Rodney King.” https://en.wikipedia.org/wiki/Rodney_King (accessed August 21, 2015).
30. Jason Horowitz, Nick Corasaniti and Ashley Southall, “Nine Killed in Shooting at Black Church in Charleston,” The New York Times, http://www.nytimes.com/2015/06/18/us/ church-attacked-in-charleston-south-carolina.html?_r=0 (accessed June 25, 2015); Frances Robles. Dylann Roof Photos and a Manifest Are Posted on Website. The New York Times, http://www.nytimes.com/2015/06/21/us/dylann -storm - roof-photos -website -charleston -church-shooting.html?_r=0#addendums (accessed June 25, 2015).
share of the wealth held by the top five percent of households increased dramatically from 16.6 percent in 1970 to 22.2 percent in 2013. The highest fifth’s share also increased, from 43.3 percent in 1970 to 51.0 percent in 2013. This indicates that the most wealthy 20 percent of people in the U.S. gained more than half of the wealth in the U.S. In 2013, the other 80 percent of the people in the U.S. had to share only 49 percent of wealth. On the other end of the scale, the lowest fifth, twenty percent of U.S. citizens, holds only 3.2 percent of the wealth in the U.S. In contemporary American society, the white attacker and the African-American attacked seem to stand on the same distressed base.
Table 7. Share of Aggregate Income Received by Each Fifth and Top 5 Percent of Households, All Races: 1970 to 2013 (Households as of March of following year)
Year (thousands)Number
Shares of aggregate income Lowest fifth Second fifth Third fifth Fourth fifth Highest fifth Top 5 percent 2013(3) 122,952 3.2 8.4 14.4 23.0 51.0 22.2 2010(2) 119,927 3.3 8.5 14.6 23.4 50.3 21.2 2000(1) 108,209 3.6 8.9 14.8 23.0 49.8 22.1 1990 94,312 3.8 9.6 15.9 24.0 46.6 18.5 1980 82,368 4.2 10.2 16.8 24.7 44.1 16.5 1970 64,778 4.1 10.8 17.4 24.5 43.3 16.6
Source: U.S. Census Bureau, Current Population Survey, Annual Social and Economic Supplements,
2013, Table H―2. https://www.census.gov/hhes/www/income/data/historial/household/ (accessed