Vegetable Production and Its Impact on Smallholder Farmers’ Livelihoods:
The Case of the Central Highlands of Madagascar
Zoniaina Ramahaimandimby
1and Takeshi Sakurai
1*Despite the increasing economic and nutritional importance of vegetables in Madagascar, empirical evidence remains largely scarce. The objective of this study is thus to examine the impact of vegetable production on smallholder farmers’ welfare and nutrition in the central highlands of Madagascar. Using yearly cross-sectional data, results reveal a positive association between market-oriented vegetable production and household’s welfare and dietary diversity, which indicates such vegetable production is income generating while allowing farmers to diversify their nutritional intake. However, no evidence is found for less market-oriented households. Policy recommendations should emphasize on commercial vegetable-related strategies, farmers’ skills and market access.
Key words: vegetable production, impact assessment, Madagascar 㻌
1. Introduction
Vegetable production can critically contribute to the welfare and the quality of diets of smallholder farmers in the central highlands of Madagascar (Minten, 2018). Particularly in rural areas, vegetable production provides high returns on land and labor, thus creates employment opportunities and incomes for rural smallholders. The demand for fresh vegetables has been increasing in recent years owing to increased urban and private companies’ demand whereas a shift to more labor-intensive crops is progressively taking place in the study zones because of relative land scarcity. There is a possibility that these trends would expand the consumption level of vegetables in Madagascar, which is reportedly one of the lowest in Sub-Saharan Africa while offering a solution to the high chronic undernourishment rate of the country due to the high content of vitamins and essential micronutrients found in vegetables.
However, questions are being raised about agricultural production’s contribution to nutrition. This link is less clear-cut than often assumed (Webb and Kennedy, 2014). In particular, agricultural production may affect the quality of the diets of rural smallholder farmers in two ways: (1) through the production of subsistence food crops households can consume directly, and (2) through the sale of agricultural goods that leads to increased income and hence food purchases and consumption (World Bank, 2007). This has led to a renewed interest in agricultural production and the need to show a more straightforward pathway from production to 1 The University of Tokyo
nutritional outcomes. Notwithstanding many studies on the links between agriculture and nutrition, empirical evidence of this relationship and the actual impact of vegetable production on income and nutritional security remain sparse (Webb and Kennedy, 2014; Yosef et al., 2014).
The primary objective of this study is to examine the impact of vegetable production on smallholder farmers’ welfare and nutritional wellbeing in the central highlands of Madagascar. To do so, we follow three steps. First, the study seeks to identify the determinants of vegetable production. Then, it estimates the impact of vegetable production on farmers’ revenue, income, expenditure, and dietary diversity. Last, vegetable producers are categorized as to their approaches to the market to demonstrate how vegetable production affects their nutrition outcomes. Propensity score matching (PSM) and the multivalued treatment effect inverse-probability-weighted regression adjustment (IPWRA) are used to pinpoint the effect of vegetable production on household income and food security, and to emphasize the possible pathways to impact nutrition outcomes, respectively.
The results show that vegetable production impacts the household’s income and nutritional wellbeing only when smallholder farmers are involved in selling a fraction or a totality of their products on the market.
This study makes a distinctive two-fold contribution to the literature. First, the actual impact of vegetable production on income and dietary diversity is examined. It has been widely *Corresponding author: [email protected]
pointed out that crop diversification tends to be effective in both generating income and improving dietary diversity of smallholders (Feliciano, 2019); however, few empirical studies have uniquely focused on the vegetable production (Thapa et al., 2018; Krause et al., 2019). Second, to give more insight into the plausible pathway through which vegetable production affects the quality of the diets of the households, the impact is further demonstrated by categorizing farmers in terms of their involvement in the market. This approach is a novel contribution to the agriculture-nutrition linkage literature.
2. Analytical Framework
In this study, a binary dummy variable for “vegetable growers” is used as the dependent variable: households cultivating at least one vegetable take the value of 1, whereas households who do not grow vegetables take the value of 0. Explanatory variables include household characteristics, geographical characteristics, land endowment, plot characteristics, and district dummies. Also, a multinomial logistic model is utilized where the dependent variable takes three categories: non-vegetable grower, less market-oriented vegetable grower, and market-oriented vegetable grower. The value of 0, 1, and 2 are assigned to each category of households, respectively. Specifically, market-oriented farmers are defined as farmers who are involved in commercializing a portion or the entire vegetable production to the market; while less market-oriented farmers are farmers who produce vegetables but consume the totality of their production instead of selling them.
In addition, considering the challenges of finding an instrumental variable that is both highly correlated with the vegetable production and uncorrelated with the error term of the outcome regression, propensity score matching (PSM) technique is used to estimate the impact of vegetable production on the household’s livelihoods in order to control for the self-selection bias in vegetable production. To examine the robustness of the estimates to unobserved confounding factors, the Rosenbaum bounds approach (Rosenbaum, 2002) is applied exclusively for statistically significant results (Hujer et al., 2004). In the case of three categorical choices mentioned above, a multivalued treatment effect model is adopted and the impact is estimated by inverse-probability-weighted regression adjustment (IPWRA) model. IPWRA is used for its potential to produce consistent estimates of the effects due to its double-robust
property. The outcome variables used in the regression are the natural logarithm of monthly total revenue, income, and expenditure per capita, and three indicators of dietary diversity: the Household Dietary Diversity Score (HDDS), the micro-nutrient sensitive HDDS (MsHDDS), and the Food Consumption Score (FCS).
3. Data and Descriptive Statistics
To show empirical evidence of the impact of vegetable production on the household’s livelihoods, 60 villages were randomly selected from 13 communes spread over 3 districts in the Vakinankaratra region of Madagascar. Ten households that grew lowland rice were randomly selected from each village for the survey. As a result, the number of sample households were 600. The data capture yearly agricultural activities from June 2018 to May 2019. Collected data include the household characteristics, agricultural practices, income from agricultural and non-agricultural activities, expenditure on food and non-food items, and food consumption respectively for the month and the week prior to the interview. With an attrition rate of 2% along with incomplete data, 570 households are retained for the analysis. Among the 570 households, 201 are considered as “vegetable growers” and 369 are considered as “non-vegetable growers” for the binary setting. Among the 201 “vegetable growers”, 43 are less market-oriented and 158 are market-oriented.
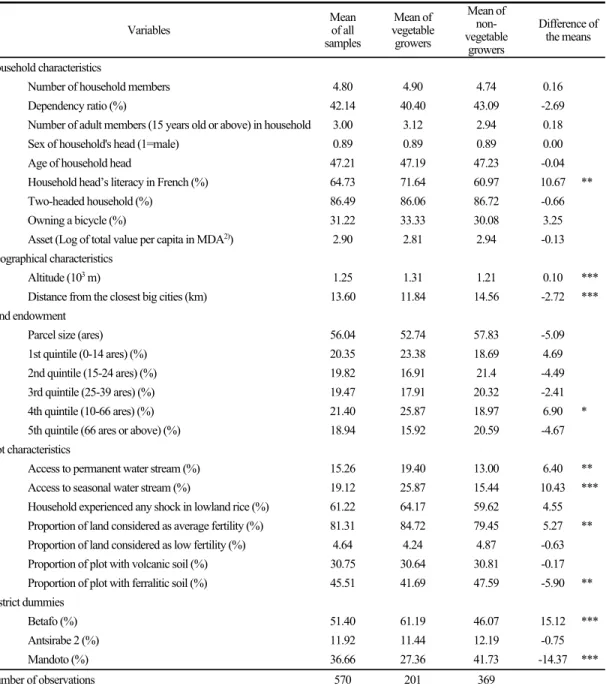
Table 1 summarizes the descriptive statistics comparing vegetable growers with non-vegetable growers at the household level. With regard to the household characteristics, the differences between vegetable growers and non-vegetable growers are not significant except for one variable, namely household head’s literacy in French. A significantly higher proportion of household heads with French literacy is observed among vegetable growers (71.64%) compared to non-vegetable growers (60.97%) at the 5% level of significance. On average, vegetable growers are located at a significantly higher altitude (1,310 m) than non-vegetable growers (1,210 m). Moreover, vegetable growers are significantly closer to big cities, with an average distance of 11.84 km, compared to their counterparts (14.56 km). In terms of land endowment characteristics, we divide the total parcel size owned by a household into quintiles. Among the quintile groups, only the 4th quintile (40-66 ares) shows a marginally significant difference between vegetable and non-vegetable growers. Concerning the plot characteristics, seven variables that are deemed important to influence the
Table 1. Descriptive statistics of vegetable growers and non-vegetable growers1)
Variables Mean of all
samples Mean of vegetable growers Mean of non-vegetable growers Difference of the means Household characteristics
Number of household members 4.80 4.90 4.74 0.16
Dependency ratio (%) 42.14 40.40 43.09 -2.69
Number of adult members (15 years old or above) in household 3.00 3.12 2.94 0.18
Sex of household's head (1=male) 0.89 0.89 0.89 0.00
Age of household head 47.21 47.19 47.23 -0.04
Household head’s literacy in French (%) 64.73 71.64 60.97 10.67 **
Two-headed household (%) 86.49 86.06 86.72 -0.66
Owning a bicycle (%) 31.22 33.33 30.08 3.25
Asset (Log of total value per capita in MDA2)) 2.90 2.81 2.94 -0.13
Geographical characteristics
Altitude (103 m) 1.25 1.31 1.21 0.10 ***
Distance from the closest big cities (km) 13.60 11.84 14.56 -2.72 ***
Land endowment
Parcel size (ares) 56.04 52.74 57.83 -5.09
1st quintile (0-14 ares) (%) 20.35 23.38 18.69 4.69
2nd quintile (15-24 ares) (%) 19.82 16.91 21.4 -4.49
3rd quintile (25-39 ares) (%) 19.47 17.91 20.32 -2.41
4th quintile (10-66 ares) (%) 21.40 25.87 18.97 6.90 *
5th quintile (66 ares or above) (%) 18.94 15.92 20.59 -4.67
Plot characteristics
Access to permanent water stream (%) 15.26 19.40 13.00 6.40 **
Access to seasonal water stream (%) 19.12 25.87 15.44 10.43 ***
Household experienced any shock in lowland rice (%) 61.22 64.17 59.62 4.55
Proportion of land considered as average fertility (%) 81.31 84.72 79.45 5.27 **
Proportion of land considered as low fertility (%) 4.64 4.24 4.87 -0.63
Proportion of plot with volcanic soil (%) 30.75 30.64 30.81 -0.17
Proportion of plot with ferralitic soil (%) 45.51 41.69 47.59 -5.90 **
District dummies
Betafo (%) 51.40 61.19 46.07 15.12 ***
Antsirabe 2 (%) 11.92 11.44 12.19 -0.75
Mandoto (%) 36.66 27.36 41.73 -14.37 ***
Number of observations 570 201 369
Notes: 1) *, **, and *** indicate that the means are different at the significance level of 10%, 5%, and 1%, respectively. 2) MDA stands for Malagasy Ariary. 1 USD = about 3,614 MDA in December 2019.
farmers’ decision to grow vegetables are selected. The access to permanent or seasonal water stream is significantly higher for vegetable growers compared to non-vegetable growers, respectively 19.40% compared to 13.00%, and 25.87 compared to 15.44%. Furthermore, the proportion of the land considered as average fertility is significantly higher for vegetable growers whereas the proportion of ferralitic soil is significantly lower. For district dummies, the district of
Betafo holds a relatively greater number of vegetable growers (61.19%) compared to the non-vegetable growers (46.07%), while in the district of Mandoto, the frequency of vegetable growers (27.36%) is significantly lower compared to that of non-vegetable growers (41.73%). Nonetheless, there is no significant difference between both groups for the district of Antsirabe 2.
4. Results
1) The determinants of vegetable production
The first part of Table 2 shows the estimation results of the probit model for growing vegetables at household level, considering vegetable growers as one group. It shows that both the age of household head and its squared term are significantly correlated with vegetable adoption, suggesting that young and very old farmers are less likely to grow vegetables due to a possible lack of experience and strength respectively. Likewise, the variable “altitude” is also linked to vegetable cultivation, which may reflect the important role of temperature, rainfall, or other environmental factors in the cultivation’s decision. It also displays that the distance from the closest big cities is negatively correlated with vegetable adoption. This result could be explained by the importance of market and the access to inputs.
The second part of Table 2 reports the multinomial logistic regression coefficients of the treatment model. The vegetable growing households are categorized into two: less market-oriented households (first group) and the market-market-oriented households (second group), in contrast with the control group of the non-vegetable growers.
Two variables are found to be closely associated with the first group. First, the household head’s literacy in French is negatively correlated with less market-oriented households, which may reflect that less-educated household head is more prone to produce vegetable solely for their consumption. Second, household having experienced a shock in their lowland rice is positively associated with that group. It might be that the shock in lowland rice has reduced the amount of rice supposed to sustain the household and thus constraining them to produce vegetables only for self-consumption.
As for market-oriented vegetable growers, there is an inverse U-shape relationship with age just like the probit regression result for vegetable production. Also, the household head’s ability in reading and writing French is positively associated with the group. This suggests the willingness of more educated household head to participate in the market. Moreover, there is a negative association between the distance from large cities and vegetables produced by market-oriented households. This implies the
1) In order to confirm the robustness of the PSM results, Rosenbaum sensitivity test is conducted. The results (the value of ī) are reported in Table 3. The value reflects the assumption about endogeneity in treatment assignment in terms of the odds ratio of differential treatment assignment due to unobserved covariates at
role played by the market and access to inputs in the decision of market-oriented vegetable production.
2) Impact of vegetable production
Table 3 shows the results after correcting for the selection bias by observable characteristics using the PSM approach. In our attempt to match the propensity score, the nearest-neighbor and the radius matching are used. Treating vegetable growers as a whole, the matchings yield comparatively similar results. Vegetable production significantly and positively influences total revenue from marketed crops per capita. In contrast, vegetable production has no significant impact on any other household economic welfare indicators. This lack of economic benefits from vegetables may be because the income from vegetable production equates with the income from other agricultural goods or other off-farm activities. On the other hand, vegetable production has a relatively strong correlation with the three indicators of the nutritional wellbeing of the household, namely HDDS, MsHDDS, and FCS. The results imply that vegetable production, considering vegetable producers as one group, improves household access to diverse foods with adequate macro and micronutrients.1)
The second part of Table 3 reports the results of the causal effects of our categorized vegetable production on our outcome variables. Less market-oriented vegetable growers are not much different from non-vegetable growers in terms of either income or nutrition except the significantly negative effect on total revenue from marketed crops. In contrast, market-oriented vegetable growers have significantly higher revenue from marketed crops, total agricultural and non-agricultural income, and total household income (per capita). Thus, market-oriented vegetable production has a significant economic impact on rural households. Concerning the dietary diversity, as shown in Table 3, all the three indicators are significantly positive and relatively larger than those obtained from the binary cases (PSM).
These results indicate (1) vegetable production improves the quality of diets, but does not enhance income compared with non-vegetable growers, and (2) the impact of vegetable production comes from cash revenue from crop sales in the market, not from vegetable production itself, implying that
10% level. With an average value of ī=1.5, it implies that the effects are relatively robust from hidden bias (Aakvik, 2001). Thus, all the results provide consistent evidence of the impact of vegetable production on the household’s nutritional wellbeing.
Table 2. Determinants of vegetable production1)
Probit model Multinomial logit model
Vegetable production Less market-oriented Market-oriented
Independent variables Coef. S.E. Coef. S.E. Coef. S.E.
Household characteristics
Number of household members -0.030 (0.068) -0.12 (0.19) -0.046 (0.14)
Dependency ratio 0.22 (0.39) 0.41 (0.87) 0.35 (0.82)
Number of adult members (15 years old) -0.0037 (0.085) -0.070 (0.19) 0.025 (0.17)
Sex of household head (1=male) 0.15 (0.28) 0.10 (0.74) 0.26 (0.49)
Age of household head 0.069** (0.027) 0.050 (0.063) 0.14*** (0.053)
Age squared of household head (103) -0.74*** (0.26) -0.51 (0.60) -1.50*** (0.52)
Household head’s literacy in French (1=yes) 0.13 (0.13) -0.67* (0.38) 0.55** (0.27)
Two-headed household -0.23 (0.27) 0.13 (0.66) -0.60 (0.45)
Owning a bicycle (1=yes) 0.15 (0.11) 0.30 (0.36) 0.19 (0.22)
Asset (Log of total value per capita in MDA2)) -0.041 (0.061) -0.075 (0.17) -0.081 (0.12)
Geographical characteristics
Altitude (km) 1.25* (0.72) 1.04 (1.33) 2.40 (1.59)
Distance from the closest big cities (km) -0.028*** (0.010) 0.020 (0.023) -0.061*** (0.022)
Land endowment
2nd quintile (15-24 ares) (1=yes) -0.27 (0.20) -0.98 (0.67) -0.24 (0.39)
3rd quintile (25-39 ares) (1=yes) -0.16 (0.21) -0.83 (0.56) 0.032 (0.43)
4th quintile (40-66 ares) (1=yes) 0.28 (0.21) 0.58 (0.51) 0.54 (0.42)
5th quintile (66 ares or above) (1=yes) 0.038 (0.25) -0.49 (0.51) 0.37 (0.56)
Plot characteristics
Access to permanent water stream 0.15 (0.19) -0.57 (0.71) 0.40 (0.33)
Access to seasonal water stream 0.16 (0.18) -0.73 (0.60) 0.42 (0.33)
Household experienced any shock in lowland rice 0.074 (0.11) 1.01*** (0.38) -0.16 (0.21)
Proportion of land considered as average fertility 0.37 (0.25) 0.64 (0.75) 0.53 (0.47)
Proportion of land considered as low fertility -0.22 (0.40) -0.62 (1.79) -0.29 (0.80)
Proportion of volcanic soil -0.32 (0.23) -0.69 (0.79) -0.50 (0.42)
Proportion of ferralitic soil -0.34 (0.24) -0.18 (0.59) -0.60 (0.46)
District dummies
Antsirabe 2 (1=yes) -0.68*** (0.26) 0.87 (0.63) -1.47*** (0.54)
Mandoto (1=yes) -0.20 (0.34) 0.62 (0.81) -0.46 (0.70)
Constant -2.90** (1.20) -4.97* (2.92) -5.88** (2.41)
Total number of observations 570 570
Notes: 1) *, **, and *** indicate that the means are different at the significance level of 10%, 5%, and 1%, respectively. 2) MDA stands for Malagasy Ariary. 1 USD = about 3,614 MDA in December 2019.
the revenue is used to buy diversified food items. 5. Conclusion
In this study, the impact of vegetable production on smallholder farmers’ welfare and nutritional wellbeing has been assessed. We find that the category of market-oriented households benefit economically and nutritionally from vegetable production by agriculture-nutrition linkage through income generation. The result of the sensitivity
analysis would seem to rule out unobserved factors which may influence the outcomes, suggesting that the findings are reasonably robust. Our findings also indicate the major role played by the closeness to the markets and experienced farmers.
In conclusion, more efforts are needed to diversify crops toward commercial vegetable production for its economic and nutritional importance while training farmers and addressing barriers constraining vegetable market access are
Table 3. Impact of vegetable production on household’s livelihoods by PSM, and Multivalued Treatment Effects1) Vegetable growers vs. Non-vegetable growers Comparison with non-growers Less market-oriented Market-oriented
Variables Unit2) (Nearest- PSM
neighbor) PSM (Radius caliper 0.1) Multivalued treatment effects IPWRA
Welfare indicators Coef. ī3) Coef. ī3) Coef. Coef.
Total revenue marketed crops 103 MDA/capita 1.58*** 1.6 1.97*** >2 -1.29** 2.93***
Total value self-consumed crops 103 MDA/capita 0.14 0.11 0.060 0.13
Total agricultural income 103 MDA/capita 0.11 0.20 -0.049 0.27*
Total non-agricultural income 103 MDA/capita 0.13 0.25 0.07 0.45*
Total household income 103 MDA/capita 0.17 0.21 0.12 0.31**
Total value of food items consumed in the last month 103 MDA/capita 0.13 0.076 0.043 -0.078
Total value of non-food items consumed in the last month 103 MDA/capita 0.12 0.095 0.17 -0.14
The aggregated value of items consumed in the last month 103 MDA/capita 0.12 0.075 0.093 -0.11
Dietary diversity
Household Dietary Diversity Score (HDDS) 0.43*** 1.6 0.36*** 1.7 -0.016 0.47**
Micro-nutrient sensitive HDDS (MsHDDS) 0.53*** 1.5 0.33* 1.4 -0.39 0.46**
Food Consumption Score (FCS) 0.51 2.21* 1.1 1.24 3.01*
Notes: 1) *p<0.10, **p<0.05, ***p<0.01.
2) Units are in 103 MDA (Malagasy Ariary) per capita. 1 USD is about 3,614 MDA as of December 2019.
3) Rosenbaum bounds: Value of ī under which results are still robust at the 10% level (only showed for statistically significant results). recommended.
To explore the role of vegetables to fight against micronutrient deficiencies, further research is required to investigate the impact of vegetable production on health status of each of household members, especially on children. Acknowledgment: This work was financially supported by the Science and Technology Research Partnership for Sustainable Development (SATREPS), Japan Science and Technology Agency (JST)/Japan International Cooperation Agency (JICA) (Grant No. JPMJSA1608).
References
Aakvik, A. (2001) Bounding a Matching Estimator: The Case of a Norwegian Training Program, Oxford Bulletin of Economics and Statistics 63(1): 115-143.
Feliciano, D. (2019) A Review on the Contribution of Crop Diversification to Sustainable Development Goal 1 “No Poverty” in Different World Regions, Sustainable Development 27(4): 795-808.
Hujer, R., M. Caliendo, and S. L. Thomsen (2004) New Evidence on the Effects of Job Creation Schemes in Germany—
A Matching Approach with Threefold Heterogeneity, Research in Economics 58(4): 257-302.
Krause, H., A. Faße, and U. Grote (2019) Welfare and Food Security Effects of Commercializing African Indigenous Vegetables in Kenya, Cogent Food & Agriculture 5(1): 1700031.
Minten, B., ed. (2018) Beyond Market Liberalization: Welfare, Income Generation and Environmental Sustainability in Rural Madagascar, Routledge.
Rosenbaum, P. R. (2002) Overt Bias in Observational Studies, in Observational Studies, Springer, 71-104.
Thapa, G., A. Kumar, D. Roy, and P. K. Josh (2018) Impact of Crop Diversification on Rural Poverty in Nepal, Canadian Journal of Agricultural Economics 66(26): 379-413.
Webb, P. and E. Kennedy (2014) Impacts of Agriculture on Nutrition: Nature of the Evidence and Research Gaps, Food and Nutrition Bulletin 35(1): 126-132.
World Bank (2007) From Agriculture to Nutrition: Pathways, Synergies, and Outcomes, Agriculture and Rural Development Department, World Bank.
Yosef, S., A. D. Jones, B. Chakraborty, and S. Gillespie (2015) Agriculture and Nutrition in Bangladesh: Mapping Evidence to Pathways, Food and Nutrition Bulletin 36(4): 387-404.