IRUCAA@TDC : Correlation between facial patterns and function of the masticatory muscles in girls and women
10
0
0
全文
(2) 51. Bull. Tokyo dent. Coll., Vol. 43, No. 2, pp. 51⬃59, May, 2002. Original Article. CORRELATION BETWEEN FACIAL PATTERNS AND FUNCTION OF THE MASTICATORY MUSCLES IN GIRLS AND WOMEN KENJI NAKAKAWAJI, KENJI KODACHI, TERUO SAKAMOTO, MORIHIRO HARAZAKI and YASUSHIGE ISSHIKI Department of Orthodontics, Tokyo Dental College, 1-2-2 Masago, Mihama-ku, Chiba 261-8502, Japan. Received 25 January, 2002/Accepted for Publication 6 March, 2002. Abstract The relationship between maxillo-facial patterns and function of the masticatory muscles was evaluated using electromyography, in 16 women with functional normal occlusion and 16 girls with chronological normal occlusion half of them had the dolico facial pattern and the others had the brachyo facial pattern by Ricketts analysis. For the electromyography, loads of 1, 2, 3, 4, and 5 kg were applied to the mandible, and muscular activity waves were obtained from the masseter muscle and the anterior belly of the temporal muscle during isometric contraction by surface electrode induction. The median frequency value (MFV) in a frequency curve obtained by high-speed Fourier transform of the electromyographic waves was set to the evaluation index. The MFV at each applied load was higher in the adult brachyo facial pattern group than in the adult dolico facial pattern group in both the masseter and temporal muscles, whereas the differences in the MFV were slight in the child group at a 5% significance level. The child group showed approximately half the incidence of significant correlation coefficients in comparison with the adult group and a large standard deviation without marked differences in the facial patterns due to their individual differences in growth with a 5% significant level. The adult brachyo facial pattern group showed a high regression coefficient of the MFV in the masseter muscle according to the increase in the amount of the applied load. Although differences in the cooperative contraction patterns similar to those in the adult group were observed in both the child dolico and brachyo facial pattern groups, no marked significant differences were observed in the child group, who had large individual differences due to their immature growth. Key words:. Electromyography analysis— Median frequency —Facial pattern— Function of the masticatory. INTRODUCTION. tion is an important issue in orthodontic treatment. Evaluation of the relationship between morphology and function by quantitatively analyzing the correlation between the. Understanding the relationship between maxillo-facial patterns and masticatory func51.
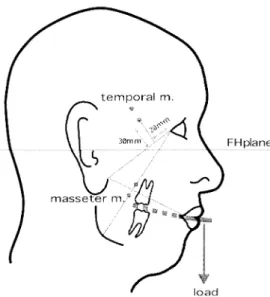
(3) 52. K. NAKAKAWAJI et al.. two factors will be significantly useful for adequate diagnosis and treatment evaluation. Electromyography is an appropriate method for evaluating the function of the masticatory muscles, because the system can be observed without surgical invasion. Frequency analysis of electromyographic waves is a quantitative method for evaluating function that also perments qualitative evaluation of the discharge of the muscles. This analytical method has been frequently reported in the field of kinetics, and the application of this method to the quantitative evaluation of the masticatory muscle has also been reported due to the recent development of electrical apparatus with an important measurement method21). The relationships between the frequency analysis of electromyograms, maxillofacial morphology and function, and clinical applications have not yet been established. Ricketts et al.16) classified facial features into brachyo, mesio, and dolico facial patterns. These patterns, including factors of growth, have been applied for the prediction of growth in each facial pattern and for the establishment of treatment goals. Furthermore, because facial feature can be easily classified into short, intermediate, and long types by these classification items, they have been generally used as the index of skeletal malocclusion and facial morphology. In this study, the degree of correlation between the facial patterns and the function of the masticatory muscles was quantitatively analyzed using the cephalometric analysis by Ricketts et al.16) and frequency analysis of the electromyograms of the masticatory muscles.. SUBJECTS AND METHODS 1. Subjects As the adult group, 16 women with functional normal occlusion and a mean age of 23.7 years (20–38 years), 8 with brachyo facial pattern and 8 with dolico facial pattern, were selected from the volunteer staff members and students at Tokyo Dental College by cephalometric analysis.. As the child group, 16 girls with chronologically normal occlusion, a mean age of 9.8 years (7–14 years), and a dental age of IIIA– IVA, including of 8 with brachyo facial pattern and 8 with dolico facial pattern, were selected from the patients who consulted the Department of Orthodontics at Tokyo Dental College Chiba Hospital. The measurements in the adult and child groups were evaluated. Informed consent from the subjects was obtained in advance. 2. Record and analysis of electromyograms To record electromyograms, 8 channel polygraph system (S1516 BioAmp. & Recticorder W1608G, Nihon Kohden Co., Tokyo) was used. Electromyograms in the bilateral masseter muscles and the anterior belly of the temporal muscle were measured by the induction method with 4 channel simultaneous surface electrodes. With regard to the surface electrodes, two electrodes were fixed with resin to maintain a constant distance between the two electrodes. To standardize the application areas of the electrodes, they were placed along the central muscular belly of each muscle according to the method of Sakamoto17). To establish isometric contraction, a mouthpiece with a shaft for the traction by heavy weights was placed in the subject is oral cavity according to the method of Kodachi 5), and load was applied to the mandible via the mouthpiece. Loads of 1, 2, 3, 4, and 5 kg were applied for 20 seconds. To eliminate the influence of muscular fatigue, subjects rested between each application of the load. The subjects sat on a dental chair with good posture and their limbs relaxed, and the measurement was taken keeping the intermaxillary distance constant. The electromyograms obtained were recorded by a data recorder (XR-510, Teac Co.) as illustrated in Fig. 1. Power frequency analysis of the recorded original electromyographic waves was performed under the conditions of a 3 second sampling time using an electromyogram analysis apparatus (ATAC 450, Nihon Kohden Co.) to obtain the median frequency value.
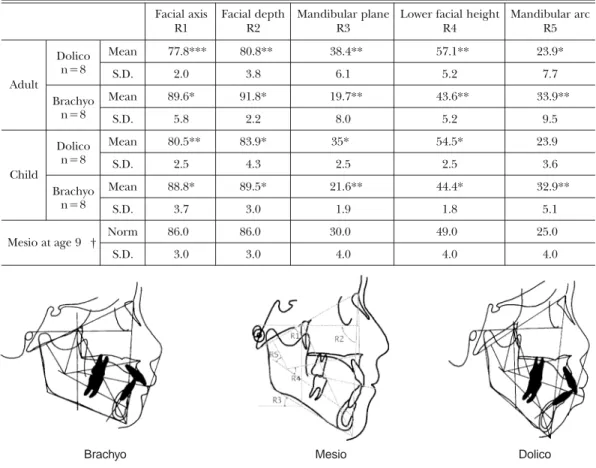
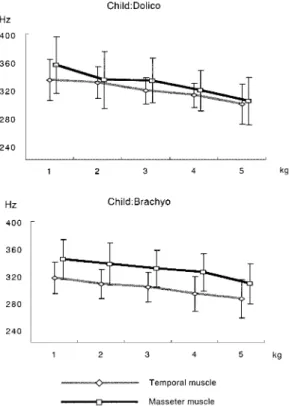
(4) CORRELATION BETWEEN FACIAL PATTERNS AND FUNCTION. 53. frequency values in the bilateral masticatory muscles were added and were set to the MFV. 3. Morphological analysis by lateral Roentgenographic cephalograms According to the analysis by Ricketts et al.16), 5 facial pattern items were measured, and classified the subjects were into brachyo and dolico facial patterns.. RESULTS. Fig. 1 Induction areas for electromyography. (MFV), which was the median in this frequency band, of each applied load. The sampling EMG was obtained from the intermediate area of the recorded original waves showing stable contraction, which was 10 seconds after applying the load. To evaluate the relationship between the function of the masticatory muscles and changes in the amount of the applied load, the MFV was compared, and the number of cases showing significant correlation was calculated assuming that correlation was significant when the correlation coefficient (r)⬎0.88. Furthermore, the regression coefficient (␣) was calculated using the single regression equation of the load and MFV. Significant differences in the MFV, r, and ␣ between facial pattern groups and among the masticatory muscles were calculated using t-test. From the preliminary evaluation, although the balance among the 4 bilateral muscles was slightly inclined toward the temporal muscle in the long facial type subjects, the 4 muscles almost evenly supported the applied load, showing no bilateral differences. Therefore, to focus on the differences between the adult and child groups and between the temporal and masseter muscles, avoiding duplication of data, both the median. 1. Changes in the MFV according to the increase in the amount of the applied load in the adults and children with dolico and brachyo facial pattern Measurement data of 5 facial pattern items and the classification are summarized in Table 1. Mean values of the MFV according to the increase in the amount of the applied load in the dolico and brachyo facial pattern groups of adults and children are summarized in Table 2. In the adult group, the MFV was high in both the temporal and masseter muscles showing no differences in the dolico facial pattern group, whereas it was low showing no differences in the brachyo facial pattern group. Muscular activity shifted toward lower frequency bands according to the increase in the amount of the applied load. In the child group, the MFV was high in the temporal muscle in the dolico facial pattern group, and it was low in the temporal muscle in the brachyo facial pattern group similarly to the pattern in the adult group. The MFV in the masseter muscle was high showing no differences between the dolico and brachyo facial pattern groups in the children groups. Furthermore, the MFV in the child group decreased according to the increase in the amount of the applied load similarly to the pattern in the adult group as shown in Figs. 2, 3, 4. 2. Relationship between the amount of the applied load and the correlation coefficient (r) or regression coefficient (␣) in the MFV In the adult brachyo facial pattern group,.
(5) 54. K. NAKAKAWAJI et al. Table 1 Ricketts analysis in the adult and child groups Facial axis R1. Mandibular plane Lower facial height Mandibular arc R3 R4 R5. Dolico n⳱8. Mean S.D.. Brachyo n⳱8. Mean S.D.. 5.8. 2.2. 8.0. 5.2. 9.5. Dolico n⳱8. Mean. 80.5**. 83.9*. 35*. 54.5*. 23.9. S.D.. 2.5. 4.3. 2.5. 2.5. 3.6. Brachyo n⳱8. Mean. 88.8*. 89.5*. 21.6**. 44.4*. 32.9**. Adult. Child. Mesio at age 9 †. 77.8***. Facial depth R2 80.8**. 38.4**. 57.1**. 23.9*. 2.0. 3.8. 6.1. 5.2. 7.7. 89.6*. 91.8*. 19.7**. 43.6**. 33.9**. S.D.. 3.7. 3.0. 1.9. 1.8. 5.1. Norm. 86.0. 86.0. 30.0. 49.0. 25.0. S.D.. 3.0. 3.0. 4.0. 4.0. 4.0. Brachyo. Mesio. Dolico. * Degree exceeding 1 S.D. is shown † Japanese standard values by Nezu et al.12). Table 2. Mean values of the MFV according to the increase in the amount of the applied load in the dolico and brachyo facial pattern groups in adults and children Temporal muscle. Masseter muscle. 1 kg. 2 kg. 3 kg. 4 kg. 5 kg. 1 kg. 2 kg. 3 kg. 4 kg. 5 kg. Adult Dolico. Mean. 350.4. 342.8. 336.6. 330.6. 321.3. 361.5. 349.1. 337.3. 329.3. 314.8. S.D.. 41.0. 41.5. 40.5. 41.3. 40.6. 45.4. 48.5. 50.6. 52.7. 49.1. Adult Brachyo. Mean. 303.3. 297.5. 291.0. 283.0. 276.8. 309.5. 302.6. 294.1. 284.0. 276.5. S.D.. 35.0. 38.2. 34.4. 36.4. 37.1. 24.2. 25.6. 25.3. 25.5. 24.2. Child Dolico. Mean. 334.3. 330.5. 318.5. 312.0. 298.9. 355.6. 334.1. 333.0. 318.5. 303.4. S.D.. 29.2. 23.0. 19.1. 17.4. 28.6. 40.6. 41.0. 32.2. 28.8. 33.8. Child Brachyo. Mean. 316.9. 308.0. 302.8. 292.8. 285.5. 344.1. 336.9. 330.0. 324.3. 307.4. S.D.. 23.1. 21.5. 21.9. 25.8. 28.7. 29.2. 30.9. 27.2. 27.0. 29.8 (Hz).
(6) CORRELATION BETWEEN FACIAL PATTERNS AND FUNCTION. 55. a significant correlation was observed in 6 of 8 cases in the temporal muscle and in 7 of 8 cases in the masseter muscle. In the adult dolico facial pattern group, a significant correlation was observed in 6 of 8 cases in the temporal muscle and in 6 of 8 cases in the masseter muscle. In the child brachyo facial pattern group, a significant correlation was observed in 4 of 8 cases in the temporal muscle and in 4 of 8 cases in the masseter muscle, showing approximately half the incidence of significant correlation. The correlation coefficient (r) between the changes in the MFV and the increase in the amount of the applied load in each subject was higher in the adult group than in the child group in both the temporal and masseter muscles and in both the dolico and brachyo facial pattern groups. The Fig. 2 Classification by the temporal and masseter muscles. Changes in the MFV according to the increase in the amount of the applied load in the dolico and brachyo facial pattern adult and child groups.. Fig. 3 Classification by the adult dolico and brachyo facial pattern groups. Changes in the MFV according to the increase in the amount of the applied load in the temporal and masseter muscles.. Fig. 4 Classification by the child dolico and brachyo facial pattern groups. Changes in the MFV according to the increase in the amount of the applied load in the temporal and masseter muscles..
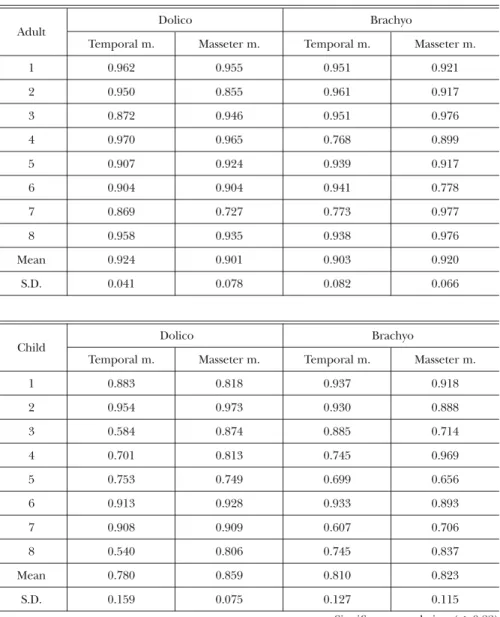
(7) 56. K. NAKAKAWAJI et al. Table 3. Correlations between the changes in the MFV and the increase in the amount of the applied load in each subject Dolico. Brachyo. Adult Temporal m.. Masseter m.. Temporal m.. Masseter m.. 1. 0.962. 0.955. 0.951. 0.921. 2. 0.950. 0.855. 0.961. 0.917. 3. 0.872. 0.946. 0.951. 0.976. 4. 0.970. 0.965. 0.768. 0.899. 5. 0.907. 0.924. 0.939. 0.917. 6. 0.904. 0.904. 0.941. 0.778. 7. 0.869. 0.727. 0.773. 0.977. 8. 0.958. 0.935. 0.938. 0.976. Mean. 0.924. 0.901. 0.903. 0.920. S.D.. 0.041. 0.078. 0.082. 0.066. Dolico. Brachyo. Child Temporal m.. Masseter m.. Temporal m.. Masseter m.. 1. 0.883. 0.818. 0.937. 0.918. 2. 0.954. 0.973. 0.930. 0.888. 3. 0.584. 0.874. 0.885. 0.714. 4. 0.701. 0.813. 0.745. 0.969. 5. 0.753. 0.749. 0.699. 0.656. 6. 0.913. 0.928. 0.933. 0.893. 7. 0.908. 0.909. 0.607. 0.706. 8. 0.540. 0.806. 0.745. 0.837. Mean. 0.780. 0.859. 0.810. 0.823. S.D.. 0.159. 0.075. 0.127. 0.115. Significant correlation (r⬎0.88). child group had a large standard deviation (Table 3). In the adult group, with regard to the comparisons between the temporal and masseter muscles, ␣ was significantly higher in the masseter muscle in the dolico facial pattern group, at a 1% significance level. Although it was high in the brachyo facial pattern group, no significant differences between the temporal and masseter muscles were observed. With. regard to the comparisons between the dolico and brachyo facial pattern groups, ␣ was significantly higher in the masseter muscle in the dolico facial pattern group, at a 5% significance level. No significant difference was observed in the temporal muscle. In the child group, with regard to the comparisons between the temporal and masseter muscles, ␣ was significantly higher in the masseter muscle in the dolico facial pattern.
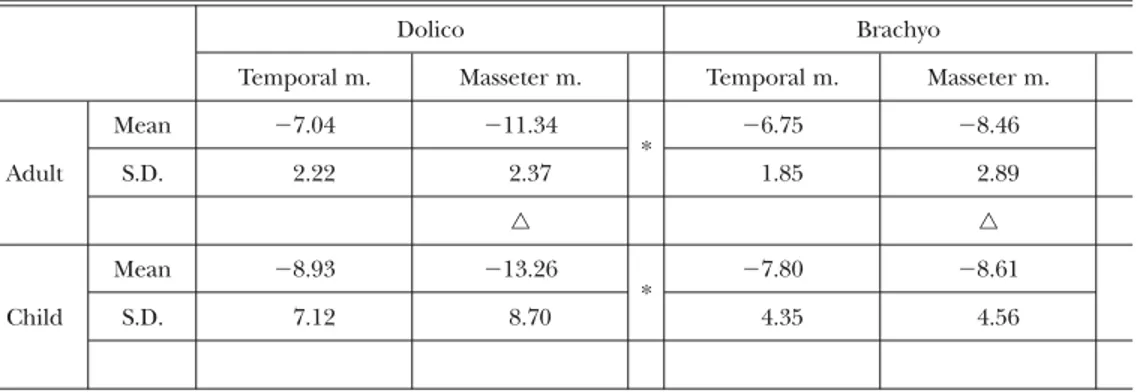
(8) 57. CORRELATION BETWEEN FACIAL PATTERNS AND FUNCTION. Table 4. Regression coefficients of the MFV according to the increase in the amount of the applied load and t -tests for significant differences Dolico. Mean Adult. S.D.. Brachyo. Temporal m.. Masseter m.. ⫺7.04. ⫺11.34. ⫺2.22. ⫺2.37. *. Temporal m.. Masseter m.. ⫺6.75. ⫺8.46. ⫺1.85. ⫺2.89. 왕 Mean Child. S.D.. ⫺8.93. ⫺13.26. ⫺7.12. ⫺8.70. 왕 *. ⫺7.80. ⫺8.61. ⫺4.35. ⫺4.56. Comparisons between the temporal and masseter muscles in each group. * Significant differences were observed at a 1% significance level. Comparisons between the dolico and brachyo facial type groups in the same muscle. 왕 Significant differences were observed at a 5% significance level. group, at a 1% significance level. No significant differences were observed in the brachyo facial pattern group. With regard to the comparisons between the dolico and brachyo facial pattern groups, no significant differences were observed in either the temporal and masseter muscles. We found that ␣ was significantly higher in the masseter muscle in the child group, at a 5% significance level. The child group showed a large standard deviation (Table 4).. DISCUSSION The subjects in the present study were limited to adult and child groups. This was because gender differences were observed in the relationship between facial height and biting force and women showed correlations, and because there have been reports that differences in the thickness of soft tissue between males and women influence frequency parameters 2). With regard to the classification of facial pattern, because the purpose of this study was treatment for orthodontic patients and functional stability of occlusion, pattern classification of lateral profiles by lateral Roentgenographic cephalogram angu-. lar measurement by Ricketts et al.16) was used in this study without using the conventional classification into long and short facial types based on the facial height in patients with skeletal growth abnormalities. For clinical examinations, surface electromyography is a reliable method generally used for the quantitative analysis of muscular function. This method, which was first used by Moyers11), was also used in this study. Biting force was used as an index of load in the report by Park14) in our department; however, considering that the subjects were young, load was applied to the mandible, and isometric contraction changing according to the increase in muscular tension was quantified. With regard to the quantitative analysis of electromyograms, electromyogram integral calculus values and Willson Turn Counter, which are indexes to show the degree of muscular tension and discharge8), have previously been used. The frequency analysis used in this study recorded the incidence of frequency bands accompanying muscular discharge which reflect the discharge of NMU and the differences in the function among each subjected muscle were obtained by frequency analysis. Furthermore, it has been reported that the frequency analysis was appropriate.
(9) 58. K. NAKAKAWAJI et al.. for clinical examinations in orthodontic treatment requiring a long-term observation due to its reproducibility of data in a report by Tamura19). Medians were used in this study because there have been many reports that medians were a most useful single index representing the whole curve and that comparisons among groups were useful in clinical examinations. With regard to the relationship between the MFV and muscular tension, Samejima18) and Kato4) reported that frequency bands shifted toward higher bands according to the increase in tension. Petrofsky and Lind15) observed no relationship between tension electromyograms and frequency distribution. In this study, similarly to the reports by Duxbury et al.3) and Palla and Ash13), the MFV shifted toward the lower frequency bands according to the increase in the amount of the applied load in both the dolico and brachyo facial pattern groups. This result was thought to be influenced by muscular tension by Palla and Ash13), muscular fatigue by Kroon et al.6), the number of participating NMU by Lindstöm et al.7), and the decrease in the conductive speed of action potentials by Tokunaga20). It is possible to that larger NMUs were mobilized according to the increase in muscular tension and that the frequency distribution shifted toward lower frequency bands because the mobilized NMUs were synchronized in the lower bands. Differences were observed between the dolico and brachyo facial pattern groups in both the temporal and masseter muscles, and the adult group showed a high correlation, whereas the child group showed a low correlation this was a clear difference. There has been a report that muscular tension was proportionate to integral calculus electromyograms under isometric contraction9). The report studied adults, but there have been no previous reports studying children. Because the cranio-superior facial growth period is early and inferior facial growth is late, as morphologically confirmed, there is a possibility that the masticatory muscles in children are undeveloped and that their function is undif-. ferentiated. Because the children in this study were 7–14 years old in the peak period of maxillo-oral growth, individual differences in the activity of the masticatory muscles were expected to be observed. Furthermore, in children, there is a possibility that an increase in the amount of the applied load was supported not only by the subject muscles, but also by other muscles unconsciously. With regard to the value of ␣, differences were observed between the dolico and brachyo facial pattern adult groups, showing different cooperative contraction patterns in the masseter muscle, in which shifting toward lower frequency bands according to the increase in the amount of the applied load was marked in the masseter muscle in the dolico facial pattern group. This was thought to be due to the differences in the synchronization phenomena of the NMU by Buchthal and Handsen1), and to the ratio of innervation by the muscles and components of kinetic NMU—tonic NMU by Moritani and Muro10). With regard to the functional differences between the temporal and masseter muscles, it has been reported that recovery from muscular fatigue was faster in the temporal muscle and that the masseter muscle was more influenced by muscular fatigue19). The differences between the dolico and brachyo facial pattern groups observed in the masseter muscle were thought to be caused by these complex factors. In both the dolico and brachyo facial pattern groups, differences in the cooperative contraction patterns similar to those in the adult group were observed. In the child masseter muscle, no difference was observed between the dolico and brachyo facial pattern groups, showing a high MFV, which may be due to their immaturity. Since individual differences were marked, no clearly significant differences were observed.. ACKNOWLEDGEMENTS I wish to thank Professor Hideharu Yamaguchi for his direction throughout this.
(10) CORRELATION BETWEEN FACIAL PATTERNS AND FUNCTION. study. This paper is part of a thesis submitted in January 2002 by K. Nakakawaji to the graduate school of Tokyo Dental College.. 12). 13) REFERENCES 1) Buchthal, F. and Handsen, A. (1950). Synchronous activity in normal and atrophic muscle. Electroencephalogr Clin Neurophysiol 2, 425–444. 2) Blinowska, K. and Piotrkiewicz, W. (1978). A study of surface electromyograms by means of digital simulation II. Spectral analysis of simulated and experimental. Electromyogr Clin Neurophysiol 18, 95–105. 3) Duxbury, A.J., Hughes, D.F. and Clark, D.E. (1976). Power spectral distribution of the masseter electromyogram from surface electrodes. J Oral Rehabil 3, 333–339. 4) Kato, H. (1975). An electromyographic study concerning to the exhibiting mode of masticatory force. Shigaku 38, 65–95. (in Japanese) 5) Kodachi, K. (1986). Electromyographic study masticatory dysfunction in patients with unilateral cleft lip and palate and reversed occlusion. The Shikwa Gakuho 89, 1801–1817. (in Japanese) 6) Kroon, G.W., Naeije, M. and Hansson, T.L. (1986). Electromyographic power spectrum changes during repeated fatiguing contractions of the human masseter muscle. Arch Oral Biol 31, 603–608. 7) Lindstöm, L. and Hellsing, G. (1983). Masseter muscle fatigue in man objectively quantified by analysis of myoelectric signals. Arch Oral Biol 28, 297–301. 8) Lippold, O.C.J. (1952). The relation between integrated action potential in human muscle and its isomeric tention. J Physiol 117, 492–499. 9) Moller, E. (1958). Methodological investigations concerning electromyographic analysis of muscle coordination. Eur Orthodont Soc Trans 34, 328–340. 10) Moritani, T. and Muro, M. (1987). Motor unit activity and surface electromyogram power spectrum during increasing force contraction. Eur J Appl Phys 56, 260–265. 11) Moyers, R.E. (1950). An electromyographic. 14). 15). 16). 17). 18). 19). 20). 21). 59. analysis of certain muscles involved in temporomandibular movement. Am J Orthod 36, 481-–515. Nezu, H., Nagata, K., Yoshida, Y., Kosaka, H. and Kikuchi, M. (1982). Cephalometric comparison of clinical norms between the Japanese and Caucasians. J Jpn Orthod 41, 450–465. Palla, S. and Ash, M.M., Jr. (1981). Power spectral analysis of the surface electromyogram of human jaw muscles during fatigue. Arch Oral Biol 26, 547–553. Park, I. (1991). A study of skeletal patterns and masticatory muscles— Frequency analysis of EMG induced clenching. The Shikwa Gakuho 91, 837–869. (in Japanese) Petrofsky, J.S. and Lind, A.R. (1980). Frequency analysis of the surface electromyogram during sustained isometric contraction. Eur J Appl Phys 43, 173–182. Ricketts, R.M., Bench, R.W., Gugino, C.F., Hilger, J.J. and Schulhof, R.J. (1979). Bioprogressive Therapy. 1st ed., pp.7–14, Rockymountain/Orthodontics, Denver. Sakamoto, T. (1987). A study on mandibular movement by electromyography in unilateral cleft lip and palatal patients. The Shikwa Gakuho 87, 1035–1057. (in Japanese) Samejima, M. (1971). Frequency analytical data processing of surface electromyogram and clinical application. Kitakanntou Igakushi 21, 292–319. (in Japanese) Tamura, H. (1988). Experimental study power spectoral analysis of the electromyogram of the masticatory muscles. Hirodaishishi 20, 125– 141. (in Japanese) Tokunaga, T. (1989). Muscle fiber conduction velocity and frequency parameters of surface EMG during fatigue of the human masseter muscle 2, Frequency parameters. J Jpn Prosthodont Soc 33, 804–817. (in Japanese) Yamada, Y., Suzuki, H. and Irie, M. (1982). Power spectral analysis of electromyogram: Jaw opening and closing muscle activities during isometric contraction. Proc Jpn Soc Stomatognath Funct 1, 69–74. (in Japanese). Reprint requests to: Dr. Kenji Nakakawaji Department of Orthodontics, Tokyon Dental College, 1-2-2 Masago, Mihama-ku, Chiba 261-8502, Japan.
(11)
図
+2
関連したドキュメント
H ernández , Positive and free boundary solutions to singular nonlinear elliptic problems with absorption; An overview and open problems, in: Proceedings of the Variational
In this, the first ever in-depth study of the econometric practice of nonaca- demic economists, I analyse the way economists in business and government currently approach
Keywords: Convex order ; Fréchet distribution ; Median ; Mittag-Leffler distribution ; Mittag- Leffler function ; Stable distribution ; Stochastic order.. AMS MSC 2010: Primary 60E05
The approach based on the strangeness index includes un- determined solution components but requires a number of constant rank conditions, whereas the approach based on
Inside this class, we identify a new subclass of Liouvillian integrable systems, under suitable conditions such Liouvillian integrable systems can have at most one limit cycle, and
Related to this, we examine the modular theory for positive projections from a von Neumann algebra onto a Jordan image of another von Neumann alge- bra, and use such projections
Then it follows immediately from a suitable version of “Hensel’s Lemma” [cf., e.g., the argument of [4], Lemma 2.1] that S may be obtained, as the notation suggests, as the m A
The proof uses a set up of Seiberg Witten theory that replaces generic metrics by the construction of a localised Euler class of an infinite dimensional bundle with a Fredholm
