IRUCAA@TDC : Stress distribution in maxillary alveolar ridge according to finite element analysis using micro-CT
9
0
0
全文
(2) 149. Bull Tokyo Dent Coll (2006) 47(4): 149–156. Original Article. Stress Distribution in Maxillary Alveolar Ridge According to Finite Element Analysis Using Micro-CT Syuntaro Nomoto, Satoru Matsunaga*, Yoshinobu Ide*, Shinichi Abe*, Toshiyuki Takahashi, Fumiaki Saito and Toru Sato Department of Crown & Bridge Prosthodontics, Tokyo Dental College, 1-2-2 Masago, Mihama-ku, Chiba 261-8502, Japan * Department of Anatomy, Tokyo Dental College, 1-2-2 Masago, Mihama-ku, Chiba 261-8502, Japan. Received 20 October, 2006/Accepted for publication 20 December, 2006. Abstract The purpose of the present study was to evaluate stress distribution by finite element analysis in an accurate model simulating trabecular bone using micro-CT. Dentulous and edentulous maxillary jaws of Japanese adult cadavers were used (5 sides each; total, 10 sides). Imaging was performed using a micro-CT, followed by reconstruction with 3-D images. Finite element analysis models were developed using the maxilla with average bone morphometry. A load corresponding to occlusal force was applied in different loading conditions, followed by evaluation of stress distribution. In dentulous maxillas, a load was applied in the dental axis direction to the first molar crown (LD). In edentulous maxillas, a load was applied directly to a circular area 4mm in diameter (LER0) to a cylinder 4 mm in diameter and 10mm in height (LER10) corresponding to the first molar area. Stress was concentrated in cortical bone around the first molar, trabecular bone and cortical bone at the maxillary sinus base in LD, cortical bone of the alveolar ridge in LER0, and trabecular bone around the cylinder and cortical bone at the maxillary sinus base in LER10. LER0 showed a stress distribution markedly different from that in LD. Compared with LER0, LER10 showed a stress distribution close to that in LD. A model simulating trabecular bone allows a more accurate evaluation of stress distribution. Key words:. Maxilla— Micro-CT—Finite element analysis— Stress distribution. Introduction Denture and implant therapies are widely performed as prosthetic methods for tooth missing. In implant therapy, there are many prognostic factors. One patient-associated. factor consists of the properties of the jaw bone5,17,19). Internal changes in the maxillary structure due to tooth loss were measured two-dimensionally by Kitta14). The internal structure of the maxilla is usually threedimensionally evaluated using a micro-focus. This paper was a thesis submitted by Dr. S. Nomoto to the Graduate School of Tokyo Dental College.. 149.
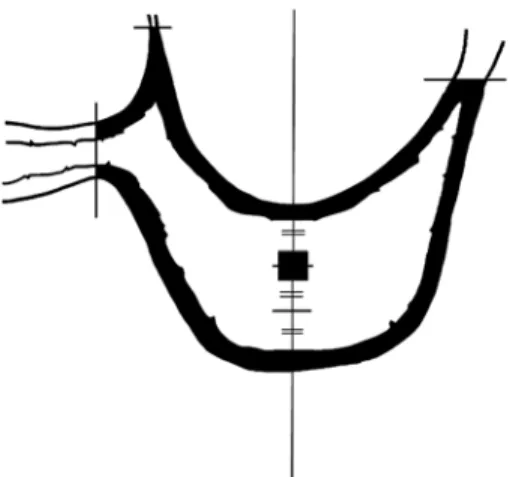
(3) 150. Nomoto S et al.. Table 1 Materials Dentulous. Edentulous. No.. Age. No.. Age. 1 2 3 4 5. 48 56 57 62 77. 1 2 3 4 5. 51 58 63 77 85. X-ray CT scanner (micro-CT hereafter). The obtained slice data are three-dimensionally reconstructed, and bone morphometry is performed18,20,21). Shibuya et al.18) had reported that 3-D reconstruction images obtained by microCT had less influence on distortion than raw data. Usami et al.20) performed 3-D quantitation of maxillary images using the same method as in that report. These reports12,14,16,20) suggest that tooth loss induces alveolar bone resorption and irregularity in the trabecular bone structure. Finite element analysis is used to evaluate stress distribution in jaw bone. However, there have been no reports on finite element analysis using a jaw model which reproduces the internal structure of the maxillary alveolar ridge. Ito et al.11) performed finite element analysis using images of the lumbar spine in rats by micro-CT. The analysis showed a correlation between the results obtained by a nondestructive compression test and the results of actual morphometry, suggesting the potential of the applicability of finite element analysis to a living body. Recent improvements in micro-CTs have allowed more detailed observation and precise measurement. The purpose of the present study was to evaluate stress distribution by finite element analysis in an accurate model simulating trabecular bone using micro-CT.. Materials and Methods 1. Materials Dentulous and edentulous maxillary jaws. of Japanese adult cadavers (5 sides each; total, 10 sides) stored in the Autopsy Department of Tokyo Dental College were used (Table 1). In the dentulous maxillary jaws, the molar dental arch remained, and occlusal contact was preserved. In the edentulous maxillary jaws, the entire molar dental arch was absent, and the entire alveolar ridge was covered with cortical bone. 2. Selection of maxilla for production of finite element analysis models The Frankfort plane (FH) of the maxilla of each jaw was established at right angles to the stage, and imaging was performed using a micro-CT HMX 225-ACTISⳭ4 (TESCO, Tokyo, Japan) with a minimum slice thickness of 50 m, at a tube voltage of 110 kV, tube current of 80 A, and an SID/SOD of 170/ 600 mm. As a filter, a 0.5-mm copper plate was used. Maxillary 3-D reconstruction images were produced from slice images using 3-D reconstruction software (VGStudio, Nihon Visual Science, Tokyo, Japan) by the volume rendering method. For these images, arbitrary crosssections can be set. The internal structure of the region of interest established in trabecular bone was observed (Figs. 1 and 2). For production of the average finite element models of the maxilla, the region of interest was established in the dentulous and edentulous jaws, and 3-D bone morphometry of the trabecular and cortical bones was performed. In the dentulous jaws, a plane crossing the FH plane at right angles and containing the interalveolar septum between the second premolar and first molar was established (Fig. 3). Next, on this plane, the line connecting the lowest point of the maxillary sinus and the alveolar ridge was divided into 3 portions, and a 2.5-mm cube centering on the upper 1/3 portion was established. In the edentulous jaws, a plane crossing the FH plane at right angles and at the mid-point between the plane containing the infraorbital foramen and the plane containing the subzygomatic crest was established. In this plane, the line connecting the lowest point of the.
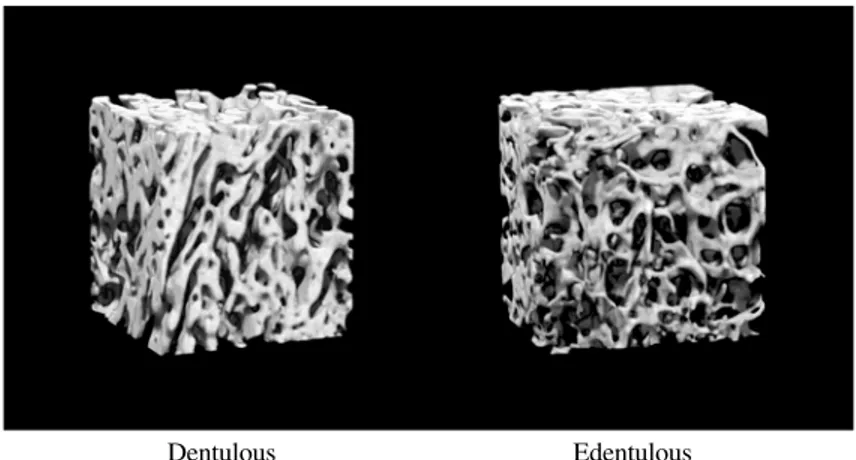
(4) Maxillary Stress Distribution by F.E.A with Micro-CT. Dentulous. 151. Edentulous. Fig. 1 3D-reconstruction images of maxillary alveolar process. Dentulous. Edentulous. Fig. 2 3D-reconstruction images of trabecular bone in maxillary alveolar process. maxillary sinus and the alveolar ridge was divided into 3 portions, and a 2.5-mm cube was established in the upper 1/3 portion. In cortical bone, the measurement region was alveolar cortical bone and cortical bone at the maxillary sinus base contained between the most stenotic site on the maxillary sinus side and the most stenotic site on the palatine process in an area within 2.5 mm from the established plane (Fig. 4). Subsequently, in the regions of interest in trabecular bone, measurements were performed using trabecular structure measure-. ment software (TRI 3D BON, Ratoc, Tokyo, Japan). The measurement items in trabecular bone were: bone volume (BV) measured by application of the parallel plate model to 3-D structural analysis, tissue volume (TV), bone volume density (BV/TV) obtained based on the bone surface (BS), trabecular thickness (Tb.Th), trabecular separation (Tb.Sp), trabecular bone number (Tb.N), and structural model index (SMI) as a morphological index. In cortical bone, mean cortical bone thickness (Ct) was measured. Three-dimensional bone morphometry.
(5) 152. Nomoto S et al.. A: Foramen infraorbitale part B: Subzygomatic crest. Fig. 3 Measurement region of outlook on flank side. Fig. 4 Measurement region of metopic plane. revealed the following results: bone volume density (BV/TV), 35.3Ⳳ8.2% in the dentulous jaws and 28.2Ⳳ5.2% in the edentulous jaws; trabecular bone thickness (Tb.Th), 0.23Ⳳ0.03 mm in the dentulous jaws and 0.18Ⳳ0.04 mm in the edentulous jaws (significant difference by t-test (p⬍0.05)); trabecular bone number (Tb.N), 1.54Ⳳ0.35/mm in the dentulous jaws and 1.62Ⳳ0.28/mm in the edentulous jaws; trabecular separation (Tb.Sp), 0.45Ⳳ0.14 mm in the dentulous jaws and 0.46Ⳳ0.09 mm in the edentulous jaws; mean Structure Model Index (SMI), 1.58 in the dentulous jaws and 1.91 in the edentulous jaws; mean thickness, 2.28Ⳳ0.40 mm in the dentulous jaws and 1.33Ⳳ0.59 mm in the edentulous jaws (significant difference by t-test (p⬍0.05)).. 3. Evaluation of stress distribution by finite element analysis Maxillas with a mean bone morphometric value were selected to develop finite element analysis models of the dentulous and edentulous jaws using finite element analysis software (TRI 3D FEM, Ratoc, Tokyo, Japan). The following loading sites were established in the finite element analysis models. In the dentulous model, load was applied in the tooth axis direction to the first molar crown (Load in corona of dentulous calyx: LD). In the edentulous model, load was applied in an area centering on the alveolar crest in the plane perpendicular to the FH plane, corresponding to the first molar and containing the infrazygomatic crest. In this model, a line was established at 83° to the FH plane in the sagittal direction as the direction corresponding to the tooth axis of the first molar and from the loading site to the lowest point of the maxillary sinus. In the edentulous model, analysis was performed using 2 loading conditions. In one condition, a 4-mm in diameter area was established centering on the alveolar crest, and the load was applied in the direction corresponding to the tooth axis (load in edentulous 0 mm rod: LER0). In the other condition, a cylinder (4 mm in diameter and 10 mm in height) was established so that its base could be positioned at the alveolar crest (load in edentulous 10 mm rod: LER10). The nodes in this superimposition were continuous. Constraint surfaces were established on the anterior,.
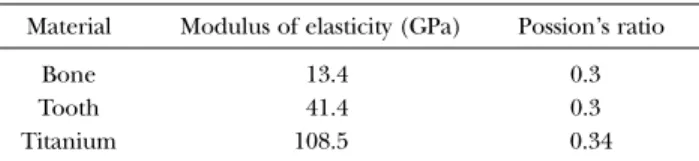
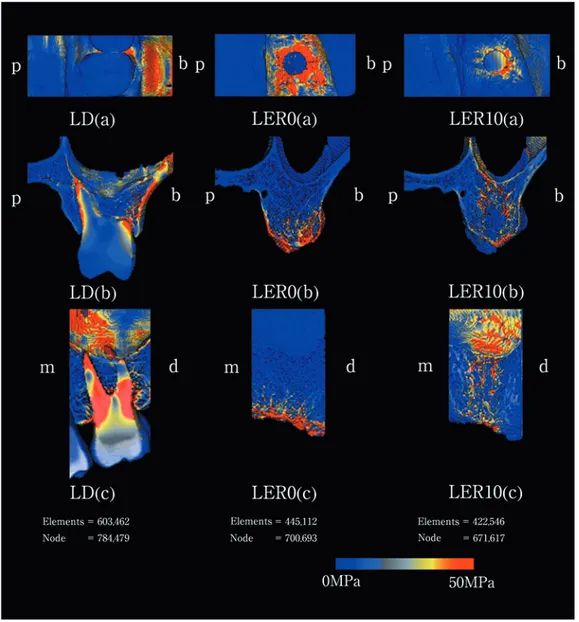
(6) Maxillary Stress Distribution by F.E.A with Micro-CT. 153. Table 2 Elastic properties of materials modeled Material. Modulus of elasticity (GPa). Possion’s ratio. Bone Tooth Titanium. 13.4 41.4 108.5. 0.3 0.3 0.34. posterior, bilateral and upper surfaces of the maxillary finite element model. Evaluation was performed using von Mises equivalent stress. The constituents were cortical bone, trabecular bone, teeth, and titanium, and their material constants are shown in Table 21–4). The load applied to the model was equivalent to occlusal force.. molar, stress distribution to the cortical bone in the alveolar process decreased compared to LER0. Stress was distributed to trabecular bone adjacent to the cylinder and cortical bone at the maxillary sinus base continuous with the trabecular bone.. Discussion Results Occlusal, frontal and lateral views of the finite element analysis are shown in Fig. 5. 1. LD After loading the first molar of the dentulous maxillary bone, stress was concentrated on cortical bone around the cervical area and on the buccal side of the alveolar ridge close to the tooth root, and was also distributed to cortical bone at the maxillary sinus base continuous with the trabecular bone around the tooth root. 2. LER0 After loading the cortical bone within a 4-mm diameter in the dental axis direction to the first molar crown, stress was concentrated on the cortical bone of the alveolar ridge, and was also distributed to internal trabecular bone on the alveolar ridge side. However, no stress distribution was observed in cortical bone at the maxillary sinus base continuous with the trabecular bone. 3. LER10 After loading a cylinder (4 mm in diameter and 10 mm in height) on the edentulous maxillary alveolar ridge corresponding to the first. The maxilla shows age- and growth-related changes in not only its external shape but also internal structure. In particular, tooth loss markedly affects the maxilla, inducing alveolar bone resorption and irregularity in the trabecular structure. Grote et al.8) reported change in plate-like trabecular structure to a rod-like structure due to an increase in spaces and loss of continuity. In their experiment, the preparation of slices caused deformation of various structures such as trabecular bone. In our present study, we used micro-CT to obtain deformation-free measurements. The methods we used allowed us to obtain higher precision images than normally possible with just micro-CT. There have been many studies on finite element analysis using jaw models with trabecular bone as a uniform mass for data inputting. Although Gabor et al.6) has performed finite element analysis using a complex maxillary model, this study regarded trabecular bone as a uniform mass. No investigations have been conducted on stress concentration in cortical bone at the maxillary sinus base via trabecular bone. Kitamura et al.13) reported differences in stress distribution in different morphologies of cortical bone around a cylinder using simplified finite element analysis models. However, each model.
(7) 154. Nomoto S et al.. Fig. 5 Distribution of stress LD, Load in corona of dentulous calyx; LER0, Load in edentulous 0mm rod; LER10, Load in edentulous 10 mm rod (a) Occlusal surface image, (b) Metopic section image, (c) Sagittal section image p: Palatal side, b: Buccal side, m: Mesial side, d: Distal side. showed a constant thickness of cortical bone, and did not simulate trabecular bone. Gurcan et al.9) has developed a finite element analysis model containing the upper structure of a cylinder and has evaluated stress distribution in cortical and trabecular bones under different loading conditions. This study, however, also regarded trabecular bone as a uniform. mass, but no stress concentration in trabecular bone was observed. In the observation of the frontal section of the maxillary alveolar ridge by 3-D image reconstruction, dentulous maxillary jaws showed interconnection and regular orientation of the trabecular bone. The morphology and direction of trabecular bone are believed.
(8) Maxillary Stress Distribution by F.E.A with Micro-CT. to reflect functional resistance to pressure10,20). Compared with the dentulous jaws, the trabecular bone of the edentulous jaws was irregularly arranged, showing a mixture of thin plate-like trabecular bone and fine rod-like trabecular bone. In the dentulous maxillary alveolar ridges, a radial arrangement of cancellous trabecular bone from the proper alveolar bone around the tooth root to the cortical bone of the adjacent alveolar ridge and cortical bone at the maxillary sinus base was observed. In contrast, the edentulous jaws showed thinner trabecular bone with irregular arrangement indicating a regressive change. Cortical bone was thinner in the edentulous jaw images than in the dentulous jaw images. Geng et al.7) reported the necessity of the simulation of trabecular bone as well as cortical bone in finite element analysis models obtained by CT and MRI. In the present study, morphological characteristics of the bone were incorporated into finite element analysis. Finite element analysis of three-dimensionally reconstructed images of the real maxilla allowed simulation of trabecular bone and observation of stress distribution close to that obtainable with in vivo conditions. Nishihara & Nakagiri15) investigated stress distribution of occlusal force in periodontal tissue by two dimensional finite element analysis. They found that in dentulous jaws, the trabecular bone was arranged in a radial pattern from the tooth root along the main stress line. Bone formation of the alveolar ridge occurred along the main stress line. Morphological change in the internal trabecular bone may result from changes in functional pressure distribution due to tooth loss. In this study, after loading the first molar in dentulous maxillary bone, marked stress distribution was observed in trabecular bone, which was arranged in a radial pattern from the mesial and distal tooth roots, cortical bone on the buccal side of the alveolar ridge and cortical bone at the maxillary sinus base. After loading the cortical bone within a 4-mm diameter in the tooth axis direction to the first molar crown, stress was distributed to. 155. cortical bone around the loading site and trabecular bone arranged along the loading direction. However, no stress distribution was observed in cortical bone at the maxillary sinus base. In contrast, after loading a cylinder (4 mm in diameter and 10 mm in height) placed on the edentulous maxillary alveolar ridge corresponding to the first molar, stress was distributed to trabecular bone adjacent to the cylinder, especially in trabecular bone connecting to the cylinder top and cortical bone at the maxillary sinus base. Stress distribution was observed in the cortical bone at the maxillary sinus base. Stress distribution in the model, in which a load was applied on the cylinder, was close to that in the dentulous jaws. In conclusion, our results suggest that functional stress distributed around the cylinder may inhibit bone morphological alteration regarded as regressive changes in trabecular bone.. Acknowledgements We are very grateful to Mr. Jeremy Williams for his assistance with the revision of the English language in this manuscript.. References 1) Arataki T, Adachi Y, Kishi M (1998) An experimental study on the influence of bridge design on stress distribution in bone tissue surrounding fixtures of osseointegrated implants in the lower molar region. Shikwa Gakuho 98:113–136. (in Japanese) 2) Borchers L, Reichat P (1983) Three-dimensional stress distribution around a dental implant at different stages of interface development. J Dent Res 62:155–159. 3) Carter DR, Spengler DM (1978) Mechanical properties and composition of cortical bone. Clin Orthop Relat Res 135:192–217. 4) Davy DT, Dilley GL, Krejci RF (1981) Determination of stress patterns in rootfilled teeth incorporating various dowel designs. J Dent Res 60:1303–1310..
(9) 156. Nomoto S et al.. 5) Ding M, Odgaad A, Havid I (1999) Accuracy of cancellous bone volume fraction measured by micro-CT scanning. J Biomech 32:323–326. 6) Gabor T, Robert H, Werner Z, Wolfgang K, Georg W (2001) Three-dimensional finite element analysis of implant stability in the atrophic posterior maxilla. A mathematical study of the sinus floor augmentation. Clin Oral Impl Res 13:657–665. 7) Geng JP, Tan KBC, Liu GR (2001) Application of finite element analysis in implant dentistry: A review of the literature. J Prosthet Dent 88:585–598. 8) Grote HJ, Amling M, Vogel M, Harn M, Pöl M, Delling G. (1995) Intervertebral variation in trabecular microarchitecture throughout the normal spine in relation to age. Bone 16: 301–308. 9) Gurcan E, Aslihan U, Mujde S, Emel S, Elif U (2004) The influence of occlusal loading location on stresses transferred to implantsupported prostheses and supporting bone: A three-dimensional finite element study. J Prosthet Dent 91:144–150. 10) Huiskes R, Weinans H, Grootenboer J, Dalstra M, Fudala B, Slooff TJ (1987) Adaptive boneremodeling theory applied to prostheticdesign analysis. J Biomech 20:1135–1150. 11) Ito M, Nisida A, Koga A, Ikeda S, Shiraishi A, Uetani M, Hayashi K, Nakamura T (2002) Contribution of trabecular and cortical components to the mechanical properties of bone and their regulating parameters. Bone 31: 351–358. 12) Kamura T (1968) Morphological changes occurring in the maxillary alveolar ridge after tooth extraction. J Jpn Prosthodont Soc 10: 1–36. (in Japanese) 13) Kitamura E, Stegaroiu R, Nomura S, Miyakawa O (2004) Biomechanical aspects of marginal bone resorption around osseointegrated implants: considerations based on a threedimensional finite element analysis. Clin Oral Impl Res 15:401–412. 14) Kitta H (1987) Studies on the internal structure of Japanese maxillary bone —Concerning adult dentulous ridge and edentulous. 15). 16) 17). 18). 19). 20). 21). ridge —. Shikwa Gakuho 87:1005–1033. (in Japanese) Nishihara K, Nakagiri S (1992) Studies on stress distribution around hydroxyapatite new type artificial root by means of finite element method. J Jpn Soc Biomaterials 10:182–192. (in Japanese) Nomura A (1982) Alveolar bone changes due to loss of masticatory stress. Jpn J Oral Biol 24:951–977. (in Japanese) Park YS, Yi KY, Lee IS, Jung YC (2005) Correlation between microtomography and histomorphometry for assessment of implant osseointegration. Clin Oral Impl Res 16:156– 160. Shibuya E, Matsubayashi T, Shida T (2000) Experimental study for the accuracy Micro-CT apparatus. Shikwa Gakuho 100:1221–1226. (in Japanese) Sugaya K (1990) Study on method for examining bone quality for dental implantrelationship between cutting force and bone mineral content. Shikwa Gakuho 90:607–633. (in Japanese) Usami A, Hara T, Ide Y (2003) Morphological changes of the internal structure of maxillae with tooth loss — Three-dimensional and mechanical analysis using Micro-CT and Finite Element Method —. J Jpn Soc Bone Morphom 13:33–42. (in Japanese) Van Rietbergen B, Muller R, Ulrich D, Rüegesegger P, Huiskes R (1999) Tissue stresses and strain in trabeculae of a canine proximal femur be quantified from computer reconstructions. J Biomech 32:165–173.. Reprint requests to: Dr. Syuntaro Nomoto Department of Crown & Bridge Prosthodontics, Tokyo Dental College, 1-2-2 Masago, Mihama-ku, Chiba 261-8502, Japan Tel: +81-43-270-3938 Fax: +81-43-270-3937 E-mail: nomotos@tdc.ac.jp.
(10)
図
関連したドキュメント
We also describe applications of this theorem in the study of the distribution of the signs in elliptic nets and generating elliptic nets using the denominators of the
In Section 3 the extended Rapcs´ ak system with curvature condition is considered in the n-dimensional generic case, when the eigenvalues of the Jacobi curvature tensor Φ are
We present sufficient conditions for the existence of solutions to Neu- mann and periodic boundary-value problems for some class of quasilinear ordinary differential equations.. We
In Section 13, we discuss flagged Schur polynomials, vexillary and dominant permutations, and give a simple formula for the polynomials D w , for 312-avoiding permutations.. In
Analogs of this theorem were proved by Roitberg for nonregular elliptic boundary- value problems and for general elliptic systems of differential equations, the mod- ified scale of
Then it follows immediately from a suitable version of “Hensel’s Lemma” [cf., e.g., the argument of [4], Lemma 2.1] that S may be obtained, as the notation suggests, as the m A
Correspondingly, the limiting sequence of metric spaces has a surpris- ingly simple description as a collection of random real trees (given below) in which certain pairs of
[Mag3] , Painlev´ e-type differential equations for the recurrence coefficients of semi- classical orthogonal polynomials, J. Zaslavsky , Asymptotic expansions of ratios of
