Dynamics of Tumor Suppressor p53 along DNA
Revealed by High-speed Single-molecule
Fluorescence Microscopy
著者
SUBEKTI Dwiky Rendra Graha
学位授与機関
Tohoku University
博⼠論⽂
Dynamics of Tumor Suppressor p53 along
DNA Revealed by High-speed
Single-molecule Fluorescence Microscopy
(⾼速単⼀分⼦蛍光顕微鏡法によるがん抑制タン
パク質 p53 の DNA 上におけるダイナミクス)
Dwiky Rendra Graha Subekti
Table of Content
Title i
Table of Content ii
1. General Introduction 1
1-1 DNA binding protein 1
1-2 Target search mechanism of DNA binding proteins 1
1-3 Tumor suppressing protein p53 4
1-4 Target search mechanism of p53 6
1-5 Purpose of this research 8
2. Role of IDR Linker in p53 Target Search 11
2-1 Introduction 11
2-2 Materials and methods 15
2-3 Results 24
2-4 Discussion 36
2-5 Conclusion 41
Appendices 42
3. Sub-millisecond Single-molecule Fluorescence Imaging of p53 48
3-1 Introduction 48
3-2 Materials and methods 52
3-3 Results 56 3-4 Discussion 80 3-5 Conclusion 86 4. Summary 87 4-1 Summary of results 87 4-2 Future perspective 88 References 90 Publication lists 102 Acknowledgement 103
Chapter I
General Introduction
1.1 DNA binding proteins
In living cells, DNA binding proteins are involved in various processes that are crucial in maintaining and regulating cellular functions such as transcription, packaging, rearrangement, replication, and repair. The biochemical reactions and signaling pathways involved in these processes are triggered and regulated by DNA binding proteins. One example is a transcriptional regulation, in which DNA binding proteins called transcription factors control the timing and the rate of transcription of genetic information from DNA to messenger RNA by binding to their respective target DNA sequences, thereby regulating the protein copy number in cells. Accordingly, DNA binding proteins are required to find and bind to their target sites among the enormous length of DNA with a high specificity of DNA sequence within a physiologically relevant time scale. Inhibition of DNA binding proteins to search for and bind to its target DNA sequence leads to an insufficient control of cell functions, which in turn results in the development of various diseases such as cancers, Alzheimer disease, and Parkinson diseases.
The typical size of the target sequence for many DNA binding proteins is 5~30 bp, while the typical size of genomic DNA is 106-109 bp. The search time for the target sequence of DNA binding
proteins is estimated to be within several tens of minutes in vivo1, 2. Assuming that a single DNA binding protein searches for its target by repeatedly associating and dissociating with random sites in the genome, the target search time is estimated to be one to two orders of magnitudes slower than the
in vivo response time1, 2. This gap, also known as “target search problem”, suggests that there may exist some mechanisms that allows the acceleration of the target search time for DNA binding proteins. In this thesis, I am trying to investigate the physical mechanisms involved in the target search of DNA binding proteins.
1.2 Target search mechanism of DNA binding proteins
Historically, the target search problem was first recognized in the study conducted on a transcription factor, Lac repressor. Lac repressor binds to its specific DNA sequences located in the
Lac promoter-operator region. In 1970, Rigs et al. have shown by in vitro measurements that the
association of the Lac repressor to its target site occurs with an association rate of ~1010 M-1 s-1, which
binding of the repressor to the target site, Riggs et al. proposed the “1D sliding” model (Fig. 1-1), in which the protein associates to a non-specific site of DNA and then slides along DNA until it finds the target site. Later, Bresloff and Crothers as well as Von Hippel proposed additionally that the protein bound to one segment of DNA can also translocate to different segments by the “direct transfer” 4-6. The transfer occurs when the protein binds two different DNA segments simultaneously and forms a bridged complex. The bridged protein will then dissociate from one of the DNA segments while remaining bound to the other. This mechanism is called the intersegmental transfer (Fig. 1-1). In addition to the aforementioned mechanisms, Berg et al suggested the dissociation-reassociation mechanism in 1978 7. In this mechanism, the dissociation process can be classified into two: macroscopic and microscopic dissociations. The macroscopic dissociation occurs when the protein fully dissociates from DNA and might be followed by free diffusion and random reassociation with different sites of DNA. The macroscopic dissociation from and reassociation to DNA is called the 3D diffusion (Fig. 1-1). In contrast, the microscopic dissociation occurs when the protein dissociates from DNA but remains close to DNA such that it can reassociate to the same or nearby site of DNA within a very short period of time. Due to this behavior, the microscopic dissociation is known as the “hopping” (Fig. 1-1). More recently, it has been suggested that some DNA binding proteins use the hopping to bypass other DNA binding proteins bound on DNA 8. Some researchers argued that the hopping is particularly important in living cells, where numerous DNA binding proteins are associated with DNA and may interfere the target binding process of other DNA binding proteins by restricting their sliding on the DNA 8, 9. Currently, it is considered that DNA binding proteins utilizes the combinations of above-mentioned mechanisms, commonly known as “facilitated diffusion”, to search for their target sites efficiently.
Fig. 1-1 The proposed search mechanisms of DNA binding proteins for the target site. Black line represents DNA, filled blue circles represent the protein, open blank circles represent the position of the protein before displacement, the yellow box represents the target DNA sequence.
By assuming that a DNA binding protein searches for its target in a long DNA primarily using the 1D sliding and the 3D diffusion, Slutsky and Mirny proposed a theoretical equation to evaluate the target search time tsearch as follows 10:
𝑡!"#$%& ='!"#×(*$!+*%!)
'& , (1-1),
where LDNA is the entire length of a genome DNA, LS is the slidinglength defined as the distance a
DNA binding protein can travel one-dimensionally during one binding event to DNA, and 𝑡-. and 𝑡/. denote the times in which a DNA binding protein performs one event of the 1D and 3D search, respectively. The 1D sliding length can be calculated as:
𝐿! = $2𝐷𝑡-., (1-2),
where D is the 1D sliding diffusion coefficient. In their study, Slutsky and Mirny showed that the most optimal search time can be achieved when 𝑡-. is equal to 𝑡/.. The optimal search time, 𝑡01*,
can then be calculated as:
𝑡01* = 2'!"#' *%!
& . (1-3)
If a certain DNA binding protein searches for its target exclusively using either of the 1D sliding or 3D diffusion, 𝑡 Target 1D Sliding Hopping/Jumping Intersegmental transfer 3D Diffusion
than 𝑡01* 11. These results suggest that the combination of different target search mechanisms, as
proposed in the facilitated diffusion, can accelerate the target search significantly.
1.3 Tumor suppressing protein p53
One of the most important and extensively studied DNA binding proteins is a tumor suppressing protein p53. p53 was first discovered in 1979 and hypothesized to be a target of SV40 virus, a strain of virus that induces development of tumors 12, 13. Since its discovery, the intensive studies revealed that p53 is a multi-functional transcription factor that plays a crucial role in maintaining genomic integrity by quickly and accurately binding to its target sites in DNA 11, 14-19.
Under normal condition, the number of p53 inside the cells are kept at low concentration through the ubiquitin-proteasome system 20, 21. The overexpression of p53 are triggered upon exposure of the cells
to various stresses such as DNA damage due to UV irradiation and expression of oncogenes 22, 23. The
expressed p53 are then transported into the nucleus and is activated by posttranslational modifications24, 25. Activation allows p53 to bind to its target DNA sequence with high specificity and
to trigger the expression of downstream genes responsible for the events such as DNA repair, cell cycle arrest and apoptosis, leading to tumor suppression15-17. These transcriptional response triggered
by p53 occurs within 1–2 h after the cells are exposed to the stress, revealing that p53 can rapidly search for its target 26. The importance of p53 is further highlighted by the fact that approximately
50% of human cancer cells contain mutations in the p53 gene 27, 28. The amino acid residues that are
mutated frequently in cancers are known as “hot spots”. An example of the well-known hot spot mutations is R248Q, which disables the target binding of p53 and prevents the expression of downstream genes used in the cancer suppression29.
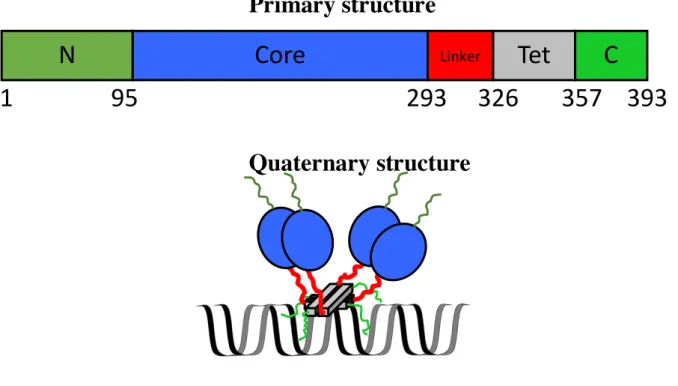
p53 monomer is 393-residue long, which is composed of disordered N-terminal (NT) domain (residues 1–95), structured core domain (residues 95–293), disordered flexible linker (residues 293– 326), structured tetramerization (Tet) domain (residues 326–357), and disordered C-terminal (CT) domain (residues 357–393) (Fig. 1-2) 14, 27, 30. The NT domain can be further divided into three parts,
transactivation domain (TAD) I, TAD II, and proline-rich region 27. p53 triggers the expression of
downstream genes by binding to cofactors such as transcriptional machinery components and chromatin modifiers through the TADs. The NT domain is also the binding site of MDM2, a ubiquitin ligase protein, that controls the number of p53 in cell27. The core domain is folded with an
structure, composed of a loop-sheet-helix motif and two loops. Loop L1 in the core domain is particularly important in the target binding and experience large conformational change during the target binding31, 32. The tetramerization domain is responsible for the formation of p53 tetramer, which
is the basic functional unit for p53 in vivo. The tetramerization domain is composed of a short β-sheet followed by an α-helix27. The tetramerization domain first form a primary dimer and two primary
dimers form a tetramer through the hydrophobic interactions between the α-helices27. The CT domain
is highly charged by positively charged residues and interacts with DNA nonspecifically 33, 34. The
CT domain is subject to many posttranslational modifications such as phosphorylation, acetylation, and ubiquitination 25. The linker domain connects the core domain with the tetramerization domain,
and contains one of the nuclear localization signals for the transfer of p53 from cytoplasm to nucleus35.
To investigate the target search mechanism of DNA binding proteins, I chose p53 as a model protein primarily due to two reasons. First, p53 has many features that are frequently found commonly in many DNA binding proteins, such as oligomerization, presence of disordered regions, and presence of multiple DNA binding domains. Second, p53 is arguably one of the most important DNA binding proteins in maintaining the integrity of genomes. Roughly 90% of the point mutations identified in p53 are localized in the core domain27, 29, 36, indicating the importance of successful target search and
binding of p53. These two reasons make p53 a great candidate as a model protein to be used for the investigation of the target search mechanisms of DNA binding proteins.
Fig. 1-2. Primary and quaternary structures of p53. Dark green, blue, red, grey, and light green represent the disordered N-terminal, core, disordered linker, tetramerization, and C-terminal domains, respectively. The numbers in the primary structure (above) denote the amino acid numbering. The lines in the quaternary structure (below) represent the disordered regions, whereas the circle and box indicate the folded region. The ribbon represents the double stranded DNA.
1.4 Target search mechanisms of p53
To explain the rapid binding of p53 to the target DNA, the facilitated diffusion hypothesis originally discussed for Lac repressors has been proposed 11, 19, in which the initial association of p53
to a non-specific DNA sequence and the subsequent 1D sliding along the DNA are assumed. The sliding p53 sometimes dissociates from and re-associates with DNA to conduct the 3D diffusion. The affinity of p53 to various specific and non-specific sequences was previously examined by titration measurements, which demonstrated that p53 has relatively higher affinity for non-specific DNA sequences compared to other DNA-binding proteins 33, 37-41. The 1D sliding of p53 was evaluated by
the ensemble and single-molecule measurements 40-49. Particularly, van Oijen and colleagues first
characterized the 1D sliding of p53 along DNA by single-molecule fluorescence microscopy 43. They
Primary structure
Quaternary structure
N
Core
LinkerTet
C
demonstrated that the CT domain promotes the 1D sliding of p5344. In contrast, the core domain
associates with the target sequence of DNA and retards the 1D sliding as it translocate along the DNA via the hopping mechanism 44.
After the pioneering experiments by van Oijen’s group, our group further investigated the detailed mechanism of the facilitated diffusion of p53. First, we reported that the presence divalent cations such as Mg2+ and Ca2+ accelerates the 1D sliding of p53 along DNA40. Second, we revealed
that as p53 slides along DNA, it exhibits a heterogeneous sliding that are composed of two modes having the fast and slow diffusion coefficients 40. We proposed that this heterogeneity in the 1D
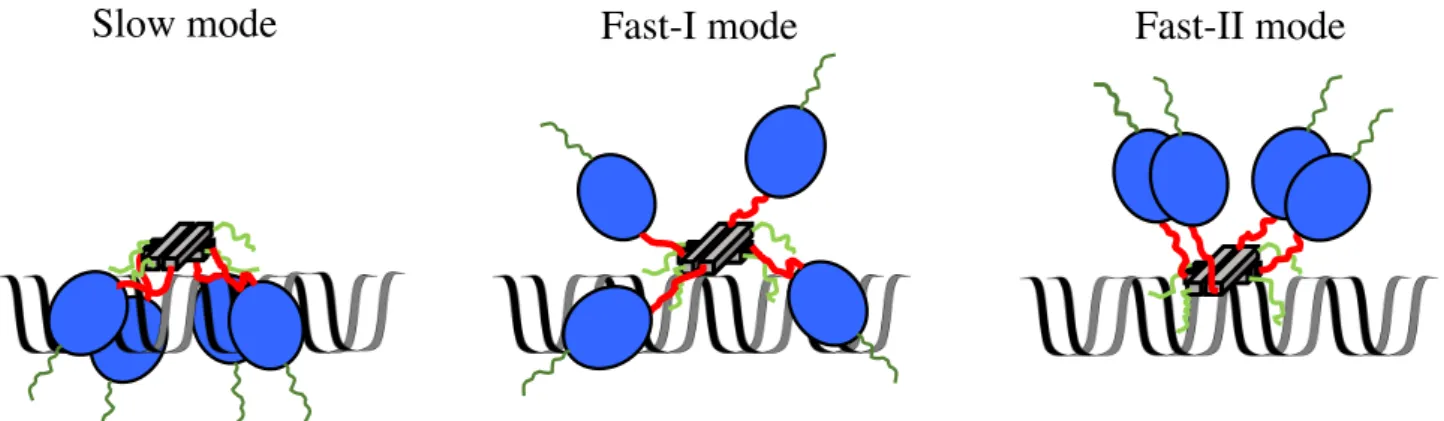
sliding comes from the different and heterogeneous conformations of the complex between p53 and DNA, where the CT domain of p53 promotes the sliding and the core domain suppresses the sliding. We suggested that the sliding is promoted as the contact interaction decreases, and that p53 possesses loose contacts of the core domains to DNA in the fast mode and tight contacts in the slow mode. In our subsequent study, we revealed that the fast sliding mode can be classified further into the fast-I and fast-II modes46 (Fig. 1-3). The difference between the two modes can be attributed to
the number of the core domain interacting with DNA during the 1D sliding, which is regulated by the CT domain. Third, we investigated the target recognition probability (TRP) of p53 which is sliding along a DNA containing the target site. The TRP is defined as the probability of p53 to recognizing and binding to the target upon encountering the target site during the target search. It has been frequently assumed that TRP of DNA binding proteins to their target sequence is 100%50, 51. However,
our single-molecule experiments revealed that p53 frequently passes over the target sequence and that the target recognition occurs at a relatively small ratio (7±2%). In fact, even a mutant that mimics the activated state of p53 having the enhanced affinity to the target site has TRP of only 18±2%. Finally, we also revealed that p53 can perform intersegmental transfer (IST) 41. The IST occurs rapidly
and is mainly driven by the electrostatic interaction of the CT-domain with two segments of DNA. These results suggest that p53 has different conformations during the search and binding processes as well as many different contacts between the DNA binding domains with DNA.
Fig. 1-3. Different sliding modes of p53. Dark green, blue, red, grey, and light green represent the disordered N-terminal, core, disordered linker, tetramerization, and C-terminal domain, respectively. In the slow mode, p53 possesses the maximal contacts of the core and CT domains to DNA and the interaction between the core domains (left). In the fast-I mode, p53 partially loses some of the tight contacts between the core domain and DNA (middle). In the fast-II mode, p53 is bound to DNA only through its CT domains.
1.5 Purpose of this research
Despite the extensive investigations I summarized above, I thought that the results from previous investigations strongly indicates that different dynamics exhibited by p53 are caused by the different conformation or structure it may assume during its interaction with DNA. I hypothesized that the unique and flexible structure of p53 is a major contributing factor that causes the heterogenous properties exhibited by p53. However, various important processes in the facilitated diffusion of p53 still require experimental clarifications. For an example, despite being highly conserved and possible contribution in p53’s flexible structure, the roles of the intrinsically disordered region (IDR) connecting the core and tetramerization domains as the linker (IDR linker) in the target search mechanisms are largely uninvestigated. Furthermore, it has been speculated that many transient events occur during the target search that are experimentally unobservable due to insufficient time resolution of the current experimental apparatus. A few examples of such events include hopping and/or jumping during the target search and encounter complex formed upon the diffusional collision of p53 to DNA. These events are very likely also caused by multiple different conformation p53 assumed during contact. Thus, in this thesis, I would like to; 1) Investigate how the linker affects p53 structure and its binding dynamics, and 2) Explore the currently unobservable target search events and the corresponding structures.
In chapter 2, I investigated whether the linker region of p53 has roles in the p53-DNA interaction and how it affects the target search. Based on the sequence of the linker region, I first hypothesized that the linker in p53 interacts directly with DNA and regulates the binding to specific and non-specific DNA sequences. Secondly, I also hypothesized that the length of the p53 linker is correlated with the efficiency of the 1D sliding and the target binding by promoting or restricting the movement of the core domain, e.g., elongating the linker may promote the 1D sliding of p53. To prove the hypotheses, I designed several p53 mutants with modulated linkers and analyzed them by using different techniques. To investigate the effect of the modulated linker on the binding to DNA, I determined the equilibrium dissociation constant by fluorescence anisotropy titration. To evaluate the effect of linker modulation on 1D sliding dynamics, I utilized single-molecule fluorescence microscopy coupled with the DNA array technique “DNA garden” 52 and determined the diffusion
coefficient for each mutant. I found that while the elongation of the linker decreases the equilibrium dissociation constant of p53 to the non-specific DNA, the 1D diffusion characteristics does not change. In contrast, the substitution of the charged amino acids in the linker to neutral one causes the increase in the equilibrium dissociation constant and the significant change in the 1D diffusion characteristics. The data suggest that the linker interacts directly to DNA and is involved in the 1D diffusion.
In chapter 3, I investigated the target search events of p53 that were hidden in the previous investigations due to the insufficient time resolution of typical single-molecule fluorescence microscope. I hypothesized that p53 should exhibit several target search events that occur in the time scales from microseconds to low milliseconds due to its unique structure. I developed a single-molecule fluorescence microscope with sub-millisecond time resolution and investigated the target search dynamics of p53 along DNA. Using the developed system, I observed new p53 dynamics such as the formation of the transient encounter complex, the jump motion along DNA, and the 1D diffusion at the physiological salt concentrations. I found that more than 90% of the binding events observed by the new single-molecule microscope are that of the transient encounter complex, suggesting that there is a large energy barrier between the transient encounter complex and the stably bound complex. The jumps were observed across the different salt concentrations. While the frequency of the jumps increased at the higher ionic strength, the average jump time that is the time between the dissociation and re-association of p53 to DNA was constant and was several milliseconds. I also observed that the 1D diffusion of coefficient of p53 increased along with the higher salt concentration to the extent correlated with the increase of the jump frequency. The data suggested that p53 in the physiological salt concentrations combines the 1D sliding and the hopping,
the current observation. These results showed that p53 exhibits many different events during its binding to and sliding along DNA that are attributed to the different conformations and structures assumed by p53 and the bound DNA.
Chapter II
Role of IDR Linker in p53 Target Search
2.1 Introduction
Since the discovery of p53, a numerous experimental investigations have been conducted to reveal the functions of each domain of p53 during its activity. The N-terminal domain of p53 was shown to be crucial in regulating the activation of p53 through the interaction with MDM2 20, 21. Other studies also showed that the N-terminal domain interacts with other proteins such as transcription factor IIH and CREB-binding protein CBP/p300 and that p53 is unable to function properly without the post-translational modification of the N-terminal domain 53-56. The core domain is the most extensively studied domain in p53 as the mutation “hotspot”. The importance of the core domain as the specific DNA binding domain was confirmed by various experimental studies 27, 32, 39, 57-62. Prior to
late 1990s, studies on the tetramerization domain were limited due to the low number of mutations of the domain found in cancer cells. However, the later investigations showed that the tetramerization domain is important for the function of p53 by enhancing the binding affinity to DNA, increasing DNA bending, facilitating the interaction of p53 with other proteins both directly and indirectly, and ensuring that the C-terminal domain is in correct conformation to interact with DNA nonspecifically
63. The C-terminal domain is responsible for the binding to non-specific DNA, and is involved in the
p53 activation, the inter-domain interaction with the core domain, and also possesses two sequences called nuclear localization signal (NLS) 64-68. In contrast, the least studied domain/region in p53 is the
linker region. Other than studies investigating the roles of NLS contained in the linker 35, 69, 70,
experimental studies investigating the function of the linker are scarce.
Conservation of the intrinsically disordered linker region in p53
In this study, I focused on the role of the linker of p53 on the target search. The length and sequence of the linker in p53 are conserved across different species and family members with splice variants, suggesting that the linker is important for p53 function 64, 71. However, these analyses were
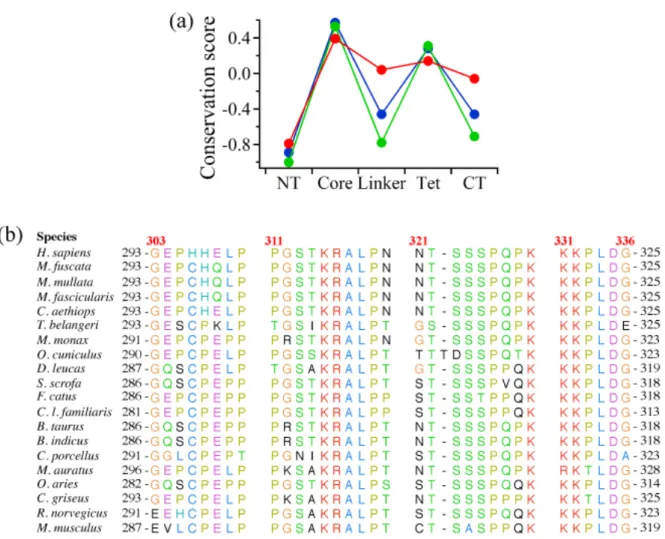
rather old and conducted using the limited data sets. To validate the conservation of the linker, my collaborator, Dr. Satoshi Fukuchi (Faculty of Engineering, Maebashi Institute of Technology), re-examined the sequence conservation of the linker as well as other regions of p53 by calculating the standardized conservation scores based on aligned sequences from broader range of species (Fig. 2-1).
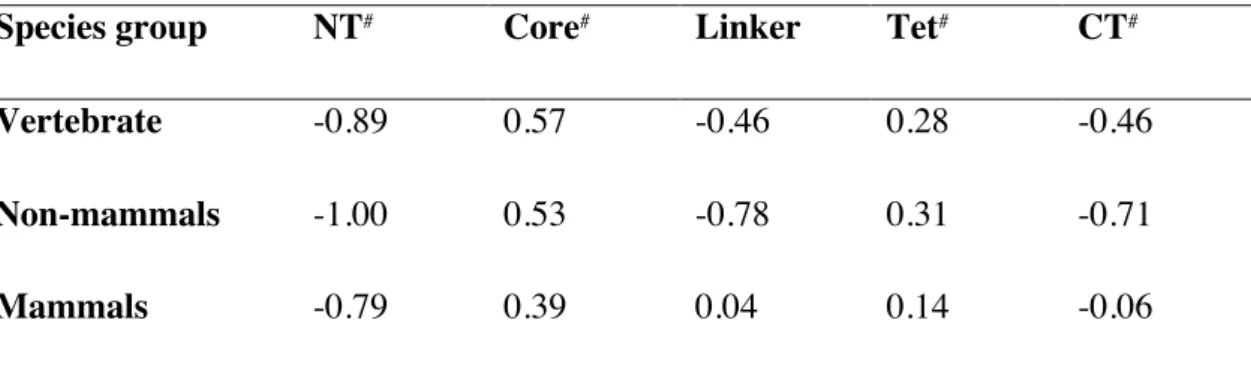
The standardized conservation scores averaged for each domain are plotted in Fig. 2-1 and listed in Table 1-1. While scores approximately 0 indicate moderate conservation, positive and negative scores indicate high conservation and no conservation, respectively. The standardized score averaged over the linker region for mammals was 0.04. While this value represents moderate conservation, the value was significantly larger than those of other intrinsically disordered NT and CT domains, suggesting the functional importance of the linker (Fig. 2-1 A). In contrast, the average scores of the linker were decreased to -0.46 for vertebrates and -0.78 for vertebrates except for mammals. Conservation of the linker sequence only among mammals indicates that the linker gained function after the evolutionary divergence of mammals. For comparison, the average scores of the structured core and tetramerization domains were between 0.14 and 0.53, confirming higher conservation of the structured domains among vertebrates (Fig. 2-1).
The conservation of the linker region of p53 further suggests the importance of the linker region in p53 function. As mentioned before, however, experimental studies to investigate the role of the linker in p53-DNA interaction or the role of the linker during target search of p53 are scarce. In fact, many researchers assume that the linker acts only as a passive linker, as will be discussed later.
Table 1-1. Standardized conservation score averaged for each domain of p53 from vertebrates, non-mammals, and mammals.
Species group NT# Core# Linker Tet# CT#
Vertebrate -0.89 0.57 -0.46 0.28 -0.46 Non-mammals -1.00 0.53 -0.78 0.31 -0.71
Mammals -0.79 0.39 0.04 0.14 -0.06
#NT, core, Tet, and CT represent N-terminal, core, tetramerization, and C-terminal domains,
Fig. 2-1. Sequence conservation in the linker region of p53. (A) Standardized conservation score averaged for each domain of p53 from mammals (red), vertebrates (blue), and non-mammals (green). NT, core, Tet, and CT represent N-terminal, core, tetramerization, and C-terminal domains, respectively. (B) Sequence comparison in the linker region of p53 among mammals. Red and black numbers represent the residue numbers used in multiple alignments and of each species, respectively. The color format of each residue is based on that of Clustal X. Data provided by Dr. Satoshi Fukuchi and used under his permission.
Function of the linker region in p53
In multi-domain DNA-binding proteins, different domains are frequently connected by a flexible linker region. Linkers are generally considered to enhance the affinity of these proteins for DNA by increasing the “effective concentration” of the secondary DNA-binding domain after binding of the primary domain 72-74, as well as to facilitate binding of spaced binding sites on proteins by
controlling the orientation and separation of different domains 75-78. Accordingly, the major function
of the flexible linker is to indirectly control the association between DNA-binding proteins and DNA. In contrast, some studies have observed direct interactions between the flexible linker and DNA 75, 77, 79, 80, suggesting that the linker plays a more “active” role in controlling the functions of DNA-binding
proteins.
For p53, previous study showed that deletion of the linker abolishes the ability of p53 to recognize four contiguous repeats in the target DNA 81, indicating that the linker is required to extend
the binding range of the core domain. In fact, the linker of p53 enables binding to the target sequence separated by a spacer from 0 to 13 base pairs 82, 83. Considering the suggested function of linkers in
other DNA binding proteins 76-78, 84, the linker may promote binding of p53 to the target site without
directly associating with DNA. In fact, it was previously suggested that the linker is just used to connect the different domains of p53 85. In contrast, recent molecular dynamics simulations suggested
that the linker of p53 is involved in 1D sliding along non-specific sequences of DNA and binding to the target site by restricting the motion of the core domain 83, 85, 86. Particularly, a simulation study by
Terakawa et al. suggested that the linker regulates 1D sliding of p53 by restricting hopping of the core domain 86. Notably, the linker sequence possesses 5 positively charged residues that may interact
favorably with the negatively charged phosphates in DNA, similar to the function suggested for the 9 positive charges in the CT domain 18, 87. It is known that the residues 305–322 in human p53
including all conserved positive charges are nuclear localization signals used to transport p53 from the cytoplasm to the nucleus 35, 64, 88-90. However, the conservation of the linker sequence in p53 also suggests that the linker may possess other crucial role in the function of p53 such as direct interaction with DNA mentioned above.
2.2 Materials and methods
Designed p53 mutants
I used human pseudo-WT p53 as the single linker mutant (SL-p53) with the mutations introduced for thermostabilization (C135V, C141V, W146Y, C182S, V203A, R209P, C229Y, H233Y, Y234F, N235K, Y236F, T253V, and N268D) 39 and for labeling with a fluorophore
constructed in our previous study (C124A, C275A, C277A, and K292C) 40. To examine the effect of
linker length, a double-linker mutant (DL-p53) and triple-linker mutant (TL-p53) were designed by duplicating the residues from 295 to 322 of SL-p53 once and twice, respectively. The genes for the three mutants were synthesized and incorporated into pGEX-6P-1 (Funakoshi, Tokyo, Japan). To investigate the effect of linker charge, a single-linker charge-neutralized mutant (SL-NC-p53) and double-linker charge-neutralized mutant (DL-NC-p53) were respectively constructed by introducing E294A, E298A, K305A, R306A, K319A, K320A, and K321A into SL-p53 and by introducing E294A, E298A, K305A, R306A, K319A, K320A, K321A, E326A, K333A, R334A, K347A, K348A, and K349A into DL-p53. The SL-NC-p53 gene was generated using a PrimeSTAR mutagenesis kit (TaKaRa, Shiga, Japan) and KOD-Plus mutagenesis kit (TOYOBO, Osaka, Japan). The DL-NC-p53 gene was generated based on the SL-NC-p53 gene with the In-Fusion cloning kit (TaKaRa).
Expression of p53 proteins
Agar Plate preparations. 32 g/L of LB agar solution was first autoclaved. After the
temperature of the solution became less than 60 oC, the ampicillin sodium at the final concentration
of 50 µg/mL and the ethanol solution of chloramphenicol at 34 µg/mL was added to the LB agar solution and mixed. The solution was then divided into petri dishes; each contains approximately 25 mL of the agar solution. The petri dishes were kept on the clean bench until the agar solution hardened.
Plasmid Transformation. BL21(DE3)pLysS E. coli was thawed on ice. After thawing,
pGEX-6P-1 plasmid containing the code for GST-tagged p53 was mixed and the solution was incubated on ice for 20 minutes. Next, the solution was heated on a heat block set to 42 oC for 45 seconds and then
incubated on ice for 2 minutes. The heating process allows the plasmid to enter the E. coli. The solution was transferred into 15 mL tube and was mixed with 900 µL of Super Optimal Broth (SOC) media. The resulting solution was incubated for 1 hour at 37 oC, and was diluted using SOC media
into three different concentrations with 1x, 10x and 100x dilution factors. The diluted solution was then spread on the previously prepared agar plate and incubated overnight at 37 oC. Single colony
Preparation of glycerol stock. 2 g/100 mL of LB solution and 80% glycerol solution were first
autoclaved. After cooling down, ampicillin sodium at the final concentration of 50 µg/mL and the ethanol solution of chloramphenicol at the final concentration of 34 µg/mL was added to LB agar solution and mixed. 2 mL of LB solution was then transferred into a 15 mL tube and the colony picked from agar plate was introduced into the solution using micropipette tip. The solution was then incubated at 37 oC overnight. After incubation, 1 mL of the solution was transferred into screw top
tube and 200 µL of 80% glycerol was added. The stock solution was stored at -80 oC.
Pre-culture. Into four 50 mL tubes, 10 mL of 2×YT media was transferred. 10 µL of 10
mg/mL of ampicillin sodium and 10 µL of glycerol stock were added into the tubes. The solution was incubated overnight at 37 oC.
Main culture. 4 liter of 2× YT media containing 16 g/L of bactotryptone, 10 g/L of bacto yeast
extract, 1g/L of NaCl, and 10 g/L of (D)-(+)-glucose was prepared. The solution was divided evenly into four 2-liter Erlenmeyer flasks and autoclaved. To each of 1 liter of 2× YT media in 2 L Erlenmeyer flasks, 10 mL of 10 mg/mL ampicillin and 10 mL of pre-culture were added. The media was incubated at 37 oC until the absorption at 600 nm was about 0.5. This normally took about 3 to 4
hours. To induce the expression of p53, IPTG and ZnCL2 were then added with the final concentration
of 100 µM for each. The media was incubated at 20 oC for 16 hours.
Collection of E. coli. After the incubation, the solution was centrifuged at 7000 rpm at 4 oC
for 10 minutes. The remaining pellet was re-suspended in 3 mL/mg of PBS(–) buffer that contained 150 mM NaCl, 2.7 mM KCl, 10 mM Na2HPO4, and 1.8 mM KH2PO4 adjusted at pH 7.4. The solution
was transferred into 50 mL tube and centrifuged at 4 oC for 10 minutes. The pellet was stored in -80 oC.
Ultrasonic disruption of E. coli. The pellet collected was re-suspended in PBS(+) buffer
containing 650 mM NaCl, 2.7 mM KCl, 10 mM Na2HPO4, and 1.8 mM KH2PO4 at pH 7.4. Three
tablets of complete mini, a protease inhibitor, DTT at the final concentration of 1 mM, 1mg/mL of lysozyme, MgCl2 at the final concentration 10 mM, and 10 unit/mL of DNase were added to the
solution. The solution was incubated on ice for 20 minutes and sonicated twice, each for 1 minute with 1 minute interval. 10% Triton X-100 at the ratio of 1.6 mL / 35 mL of the total solution was added and the mixed solution was incubated on ice for 30 minutes. After the incubation, the solution was centrifuged at 15,000 rpm with 4 oC for 30 minutes. Finally, the supernatant that contains
Purification of p53
GST column purification. A 1mL GST column was prepared and connected to the pump, and
was equilibrated with PBS(+) buffer. The equilibration volume was at least 5 times of the column volume. After equilibration, the supernatant was applied to the column by using the pump. The column was washed using 80 to 100 mL of wash buffer 1 containing 50 mM tris, 1 mM EDTA, 1 mM DTT, 1.5 M NaCl, 0.1% NP_40 and 10% glycerol at pH 7.5, followed by washing by 40 mL of wash buffer 2 containing 50 mM tris, 1 mM EDTA, 1 mM DTT and 650 mM NaCl at pH7.0. Sufficient washing in this step is important to remove any DNAs bound to p53. An insufficient washing would lead to suboptimal results in the heparin column purification. After washing, the column was equilibrated using pre-scission buffer containing 50 mM tris, 1 mM EDTA, 1 mM DTT, 150 mM NaCl at pH 7.0. A mixture solution of the PreScission protease and PreScission buffer at the volume of 80 µL and 920 µL, respectively, was then introduced into the column to cleave the GST tag from p53. The column was left at 4 oC for overnight. The following day, using PreScission buffer
3, fractions of 1 mL p53 sample was eluted from the column.
Heparin column purification. I used HiTrapTM HEPARIN HP column with AKTA prime.
First, the column was setup on the AKTA prime and equilibrated by using buffer B containing 25 mM HEPES and 10 mM DTT at pH7.5. The sample was applied to the column, and p53 was eluted using buffer B with salt gradient from 0 M to 1 M of KCl. The fraction showing absorption at 280 nm was then collected.
Determination of the concentration of p53. I determined the concentration of purified p53 by
using the absorbance of the protein at 280 nm measured by UV-Visible spectrophotometer (Hitachi U-2910). The absorbance at 280 nm is attributed to the absorption by tryptophan, tyrosine, and cysteine in p53. After the absorbance data is obtained, I approximated the concentration of p53 by using Beer-Lambert law:
𝐴 = 𝜀𝐶𝑏 (2-1),
where A is the absorbance at 280 nm, 𝜀 is the molar attenuation coefficient of p53, C is the concentration of p53, and b is the length of light traveled through the solution and was 1 cm. The coefficient 𝜀 was calculated as follows:
𝜀 = 5690𝑁Trp + 1280NTyr + 120NCys (2-2),
= 5690 × 3 + 1280 × 10 + 120 × 4 = 30350
where NTRP, NTYR and NCys represent the number of tryptophan, tyrosine and cysteine in p53,
respectively.
SDS-PAGE. First, I cleaned the glass plates by ethanol and sandwiched them together. Second, I prepared 7.5 % lower gel (resolving or separating gel) by mixing 4.5 mL of ultrapure water, 2.25 mL of lower gel buffer containing 1.5 M tris and 4g/L SDS at pH 8.8, and 2.25 mL of 30% acrylamide solution. The solution was mixed using stirring bar and degassed. To the mixed solution, 5 µL of TEMED and 35 µL of 10% APS solution were added. The solution was poured between the two glass plates immediately. On the top of the lower gel solution, ethanol solution was carefully added to ensure flat and even surface of the lower gel. After the lower gel is hardened, I prepared the upper gel (stacking gel). I first mixed 1.8 mL of ultrapure water, 0.75 mL of upper gel buffer containing 0.5 M tris, 4 g/mL SDS at pH 6.8, and 0.45 mL of 30% acrylamide solution. After degassing, 5 µL of TEMED and 35 µl of 10% APS were added and the solution was transferred to glass plates immediately. On the top of the upper gel, gel comb was added to form the wells. While waiting for the upper gel to harden, sample preparations can be conducted. To prepare the samples, 12 µL of sample buffer containing 62.5 mM tris, 23 g/L SDS, 8% glycerol at pH 8.8, p53 sample at the final concentration of 5 µM, 10% BPB containing 10 g BPB, 1 mL glycerol and 9 mL ultrapure water, and 1 µL of 2-merchaptoethanol were mixed in 1.5 mL tubes. After mixing, the tube was placed into a heat block and heated at 95 oC for 3 minutes. The p53 samples and markers were then
loaded onto the gel and the electrophoresis was conducted at a constant electric current of 20 mA. After the electrophoresis, the gel was removed from the glass plates and submerged in CBB staining solution for 30 minutes. After that, the gel was removed from CBB solution and washed with ultrapure water and then kept immersed in ultrapure water until desired background level is obtained.
Observation of p53 tetramer by SDS-PAGE crosslinked by glutaraldehyde. Because the
addition of the SDS-PAGE sample buffer will quench the crosslinking process of glutaraldehyde to p53 oligomer, I first allow the 5 µL of sample solution adjusted at the final concentration of 5 µM
and glutaraldehyde adjusted at the final concentration 0.025% to react for 3 minutes before adding 12 µL of the SDS-PAGE sample buffer, 2 µL of 10% BPB solution, and 1 µL of 2-merchaptoethanol. The samples was heated at 95 oC for 3 minutes and loaded along with marker into the wells.
Electrophoresis was conducted at 20 mA and the gel was stained with CBB.
Blue Native-PAGE for determining the oligomeric state of p53. To 1.5 mL tubes, 2.5 µL of
NativePAGE sample buffer (4×), samples whose volume depends on the concentration, and ultrapure water were mixed to a total volume of 10 µL. The gel was either 3-12% gels or 4-16% gels. The comb was first removed and the well was washed with ultrapure water. After setting up the gel onto electrophoresis chamber, the well was washed with 1X NativePAGE™ Dark Blue Cathode buffer followed by sample loading to the wells. The cathode chamber was filled with the dark blue cathode buffer while the anode chamber was filled with anode buffer. The electrophoresis was conducted at constant voltage of 150 V. The dark blue cathode buffer already contains CBB-G250 (Coommasie Briliant Blue) stain. Accordingly, after the run no extra staining was conducted. The de-staining process was as follows. First, the gel was placed in 100 mL Fix solution containing 40% methanol and 10% acetic acid, and microwaved for 45 seconds. Second, the gel was shaken on an orbital shaker for 15 minutes at room temperature. Third, 100 mL of destaining solution containing 8% acetic acid was added and microwaved on high for 45 seconds. Last, the gel was shaken on an orbital shaker at room temperature until the desired background was obtained.
Fluorescent labeling of p53. The fluorescent dye I used is ATTO-532-maleimide
(ATTO-TEC, Siegen, Germany) that will react with the exposed cysteine at the core domain of p53. Because the buffer used in the purification process contained DTT, which will inhibit the labeling process, buffer exchange to a buffer containing 20 mM sodium phosphate and 150 mM NaCL at pH 7.0 was first conducted by using PD-10 column. The resulting solution was centrifuged to remove excess buffer solution and to concentrate p53. TCEP was added to the solution such that the final concentration of TCEP is 1 mM, followed by the addition of ATTO-532 at the concentration five times larger than that of p53. The tubes containing p53 sample was covered using aluminum foil to protect from the light and incubated for 2 hours. The labeled p53 sample was collected by using ion-exchange chromatography on AKTA prime system. I used HiTrap HP SP (GE Healthcare, Little Chalfont, UK), and eluted the sample using buffer containing 25 mM of HEPES, 5 mM of DTT, and the salt concentration gradient from 0 to 500 mM NaCl. Because the eluted sample was too dilute, I concentrated p53 by centrifuging the sample on Amicon Ultra-4 30 kDa at 7000 rpm, 4 oC, for 10-15
Equilibrium titration measurements.
To examine the equilibrium binding of the p53 mutants to specific and non-specific DNAs based on fluorescence anisotropy, I used a fluorescence spectrometer (JASCO FP-6500) with automatic titration (JASCO ATS-443) and custom-made rotating-polarizer units. I used 30-base pair DNAs conjugated to 6-FAM containing the p21 promotor sequence and a random sequence as specific and non-specific DNAs, respectively. The specific and non-specific sequences were
5’-6-FAM-ATCAGGAACATGTCCCAACATGTTGAGCTC-3’ and
5’-6-FAM-AATATGGTTTGAATAAAGAGTAAAGATTTG-3’, respectively. The excitation and emission wavelengths were 480 and 525 nm, respectively. The sample solution contained 20 mM HEPES, 0.5 mM EDTA, 1 mM DTT, 0.2 mg/mL BSA, 50 mM KCl, and 2 mM MgCl2 at pH 7.9. In some
measurements, I used the same buffer containing 150 mM KCl. In all the measurements, I titrated a solution containing 600 nM of p53 to 2 mL of a buffer solution containing 5 nM of 6FAM labeled to DNA. The titration curves of fluorescence anisotropy, robs, were analyzed using a two-state model, in
which one tetramer of p53 was assumed to bind to one DNA. The fitting equations were:
𝑟03! = 𝑟45%'6%% ('7 ' + 𝑟84 %(' %' (2-3), 𝑐84 =(%'+%(+9')6:(%'+%(+9') )6;%'%( 2 (2-4),
where rD, rpD, KD, cp, cD, and cpD denote the anisotropy of free DNA, anisotropy of the p53-DNA
complex, equilibrium dissociation constant, total concentration of the tetrameric p53 mutant, total concentration of DNA, and concentration of the p53-DNA complex, respectively.
Fig. 2-2. Experimental setup of fluorescence anisotropy titration measurements
Single-molecule Fluorescence Microscopy
Annealing of biotin-λDNA. The biotin-λDNA was prepared by mixing 100 times diluted
Oligo1, ultrapure water, and λDNA at a ratio of 3:7:10. The mixed solution was heated on the heat block at 65 oC for 10 minutes and slowly cooled until it reached room temperature.
Construction of DNA array in flow cell for single-molecule measurements. For
high-throughput analysis of the sliding dynamics of p53 along DNA, I used the DNA garden technique developed in our laboratory and constructed arrays of extended DNAs on the surface of a flow cell
52. First, I prepared coverslips (Matsunami Glass Ind., Ltd.) by washing them using a mixture of
H2O2, NH3 and ultrapure water at the volume ratio of 1:1:1. After immersion in the solution, the
coverslips were sonicated for 30 minutes. The coverslip was then washed with ultrapure water and dried, followed by coating using 2% 2-methacryloyloxyethyl phosphorylcholine polymer (Lipidure-CM5206E) in ethanol. Second, on a custom-made polydimethylsiloxane (PDMS) stamp with blocks 1–2 µm in width, 500 µm in length, and 1 µm in height placed at 14–18 µm intervals (Fluidware Technologies, Saitama, Japan), I dropped a mixture of Alexa Fluor 633 conjugated streptavidin (Thermo Fisher Scientific, Waltham, MA, USA) and neutravidin (1:20 mixture) and incubated the stamp under the cover of a plastic wrap for 45 minutes. After the incubation period was over, I washed the cover slip using ultrapure water and dried it using pressured gas. Third, I printed the streptavidin and neutravidin to the cover slip by putting the PDMS stamp on top of the cover slip and weighed it
using 300 g plate for 5 minutes. While waiting, the flow cell was prepared by pasting double-sided tape on a modified slide glass. After printing, the flow cell was assembled by stacking double-sided tape, the printed coverslip, and a slide glass. The width and height of the flow path were 4 and 0.1 mm, respectively. Fourth, 5% polyvinylpyrrolidone K15 (Tokyo Chemical Industry, Tokyo, Japan) and 0.2 mg/mL BSA (Sigma-Aldrich, St. Louis, MO, USA) in 10 mM phosphate buffer at pH 7.4 were incubated in the flow cell for 20 min. lDNA (New England Biolabs, Ipswich, MA, USA) annealed with 5’-AGGTCGCCGCCC-biotin-3’ (Sigma-Aldrich) was introduced at 0.75 nM in 10 mM phosphate buffer at pH 7.4 into the flow cell and was immobilized on neutravidin printed on the flow cell.
Single-molecule measurements of p53. 1D sliding of p53 mutants on the DNA arrays
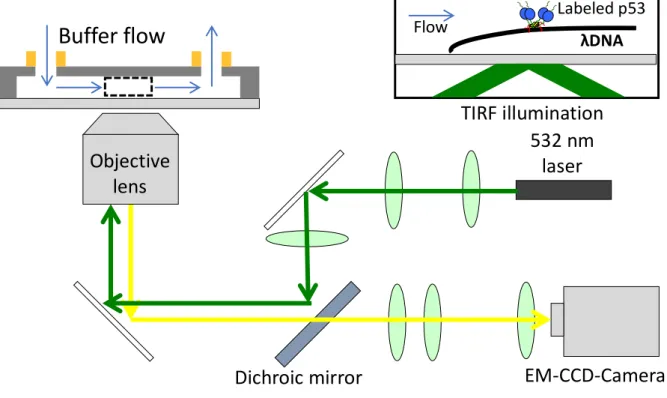
constructed in the flow cell was observed using a home-built total internal reflection fluorescence (TIRF) microscope. Briefly, I used green laser at 532 nm (CL532-050L, Crysta Laser®, NV, USA) to excite ATTO532 labeled to p53 that was bound to DNA. The laser was passed through spherical lens with focal length of 500 mm and focused into the flow cell by using objective lens (Plan Apo VC 100×/ 1.40 Oil, N.A. = 1.4, Nikon JAPAN, Tokyo, Japan). The resulting fluorescence light from the label on p53 and excitation light was then reflected back and passed through a dichroic mirror (D101-R405/488/532/635-25×36, Sermock Inc., NY, USA) to remove the excitation light. The fluorescence light was passed through two spherical lenses with focal lengths of 200 mm and 70 mm. The fluorescence was passed through an optical filter (BLP01/532R-25, Sermock Inc., NY, USA) followed by another spherical lens with focal length of 70 mm. The fluorescence light was captured by TDI-EM-CCD camera (C9100-03, Hamamatsu Photonics K. K., Hamamatsu, Japan). The final enlargement of the image captured by the camera was 100 times. Using a syringe pump (Chemyx, Stafford, TX, USA), I introduced a solution containing 1–2 nM p53, 20 mM HEPES, 0.5 mM EDTA, 1 mM DTT, 0.2 mg/mL BSA, 2 mM Trolox, 50 mM KCl, and 2 mM MgCl2 at pH 7.9.
Single-molecule images were recorded at 33-ms intervals at a flow rate of 500 µL/min at 22°C. The imaging was conducted with laser intensity of 5 mW, camera sensitivity of 100, and exposure time of 30 ms. Single-molecule data were analyzed by using Particle Track Analysis (PTA) program in the ImageJ software. This program allowed the tracking of individual p53 along DNA. The collected data were processed with a macro program developed by Agato Murata Ph.D to remove unneeded data such as immobile particles, particles that do not show movement on horizontal axis (particle adsorbed on glass surface), and particles that slide less than 10 frames (1 frame = 33 ms). The program also automatically calculated mean square displacement (MSD). Fitting of the MSD curve with the following equation allowed us to calculate the averaged MSD of a given number of particles:
𝑀𝑆𝐷 = 2𝐷𝑡 + (𝑣𝑡)2 + A (2-5).
In the equation above, D is diffusion coefficient, t is time, v is drift velocity, and A is measurement accuracy. For distribution analysis, I used the fitting equation:
𝑃(δ𝑥) = ∑ =;>.<* *?* 2 @A- exp F− (?B+C*?*)) ;.*?* H (2-6),
where P(dx), dt, dx, Ai, vi, and Di are the occurrence of dx, time interval, displacement in the time
interval, amplitude of the ith mode, drift velocity of the ith mode, and diffusion coefficient of the ith
mode, respectively.
Fig. 2-3. Experimental setup of single-molecule fluorescence microscopy
Buffer flow
532 nm
laser
Dichroic mirror
EM-CCD-Camera
Objective
lens
TIRF illumination
Labeled p53 λDNA Flow2.3 Results
Construction of p53 mutants with elongated and/or charge-neutralized linkers
In this study, I prepared all of p53 mutant samples used except for the single linker p53 (pWT-p53/SL-p53) that was prepared by Saori Kanbayashi. p53 with a doubled linker length (DL-p53) and tripled linker length (TL-p53) were obtained by replicating the linker, corresponding to residues 295– 322, once and twice, respectively. I also constructed charge-neutralized linker mutants by replacing all charged residues in the linker with alanine. The mutant with a single and neutral linker (SL-NC-p53), constructed based on SL-p53, contained E294A, E298A, K305A, R306A, K319A, K320A, and K321A. The mutant with a doubled and neutral linker (DL-NC-p53) was obtained by replicating the neutral-charged linker once. All p53 mutants were expressed with a GST tag in E. coli and purified by cleaving the GST tag with PreScission Protesase. The samples were then further purified using Heparin column. The purified samples were applied to SDS-PAGE to check the purity (Fig. 2-4).
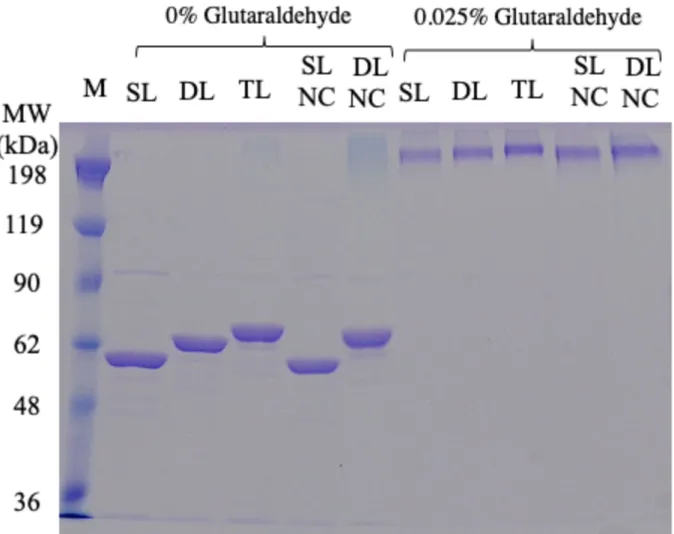
To examine the oligomeric state of the p53 samples used in this study, I conducted SDS-PAGE analysis with a cross-linking agent, glutaraldehyde, as described in materials and methods. (Fig. 2-4). In the absence of glutaraldehyde, bands for p53 samples were observed at approximately 62 kDa, which is consistent with the monomeric form of the mutants. For SL-p53, the molecular weight was ~53 kDa (Fig. 2-4). As expected, the molecular size increased upon linker elongation. In the presence of glutaraldehyde, single bands above 198 kDa were observed for all the samples. The observed molecular weight after crosslinking suggests that the oligomeric state of all p53 samples was homogeneous and tetrameric.
Fig. 2-4 SDS-PAGE analysis of p53 samples in the absence (0%) and presence of 0.025% glutaraldehyde. M denotes molecular weight markers. The concentration of p53 was 5 µM per monomer.
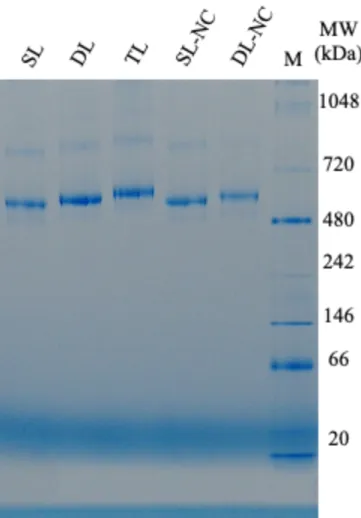
To further confirm the tetrameric form of the p53 samples, I conducted blue native PAGE analysis. Dense bands were observed above 480 kDa for all p53 samples (Fig. 2-5). As expected, the molecular size was increased upon the linker elongation. The observed molecular weights were larger than the value predicted for the tetramer observed in SDS-PAGE with the cross-linking agent. However, an apparent discrepancy in the native PAGE analysis for p53 compared to the folded maker proteins 91, 92 was reported previously and attributed to the intrinsically disordered regions in p53.
Thus, the data confirmed that the p53 samples were tetramers. Accordingly, the two electrophoresis experiments demonstrated that all p53 mutants used in this study formed tetramers. For single-molecule measurements, all mutants were labeled with the fluorescent dye ATTO-532 at a labeling efficiency of 0.8–1.4 dyes per monomer.
Fig. 2-5. Blue native-PAGE analysis of p53 samples. M denotes molecular weight markers
Effect of linker mutations of p53 on DNA binding
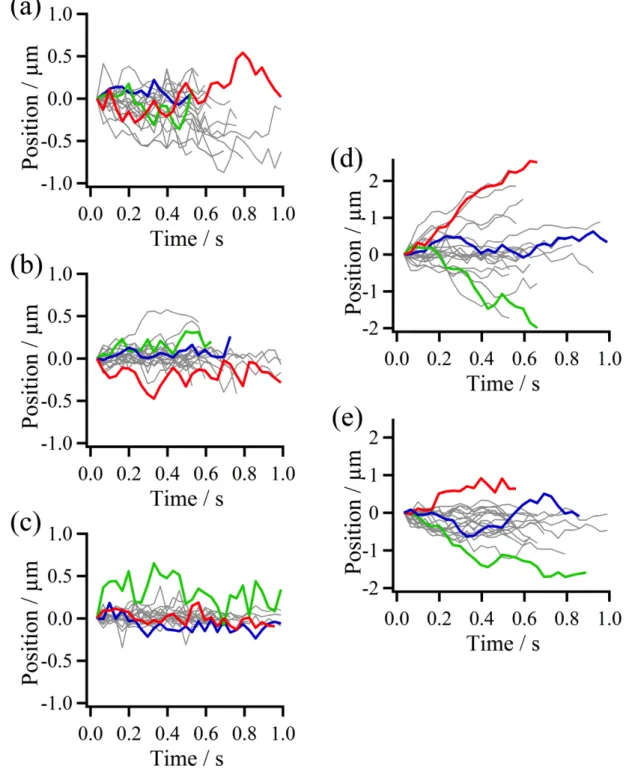
To examine DNA-binding ability, I conducted fluorescence anisotropy titration of the p53 mutants into a solution containing nonspecific DNA (nspDNA) or specific DNA (spDNA) labeled with the fluorescent dye 6-FAM. The titration curves were well-fitted using a two-state model, where one p53 tetramer was assumed to bind to one DNA with an equilibrium dissociation constant KDsp or KDnsp (Eqs. 2-3 and 2-4, Fig. 2-6). While fluorescent anisotropy was modulated by the binding of p53
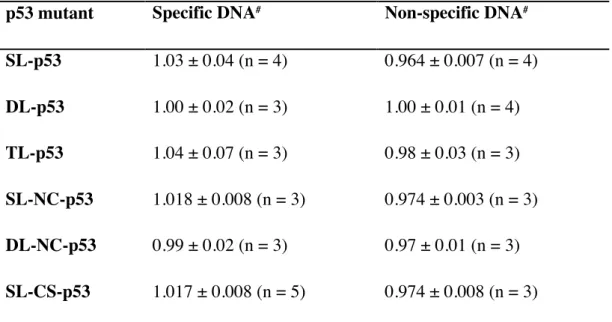
mutants to DNA, total fluorescence intensity was not altered by titration (Table 2-2). These results demonstrate that the photophysical properties of 6-FAM were not affected by the binding of p53 mutants, supporting the equilibrium binding data without considering the changes in the fluorescence quantum yield of 6-FAM.
Table 2-2. Total fluorescence intensity of DNA labeled with 6-FAM and bound to p53 mutants relative to fluorescence intensity of free DNA obtained in buffer containing 50 mM KCl. p53 mutant Specific DNA# Non-specific DNA#
SL-p53 1.03 ± 0.04 (n = 4) 0.964 ± 0.007 (n = 4) DL-p53 1.00 ± 0.02 (n = 3) 1.00 ± 0.01 (n = 4) TL-p53 1.04 ± 0.07 (n = 3) 0.98 ± 0.03 (n = 3) SL-NC-p53 1.018 ± 0.008 (n = 3) 0.974 ± 0.003 (n = 3) DL-NC-p53 0.99 ± 0.02 (n = 3) 0.97 ± 0.01 (n = 3) SL-CS-p53 1.017 ± 0.008 (n = 5) 0.974 ± 0.008 (n = 3)
#Error bars represent the standard error obtained from at least 3 independent measurements for p53
mutants. Number of measurements is listed in the parenthesis next to each result as (n = X).
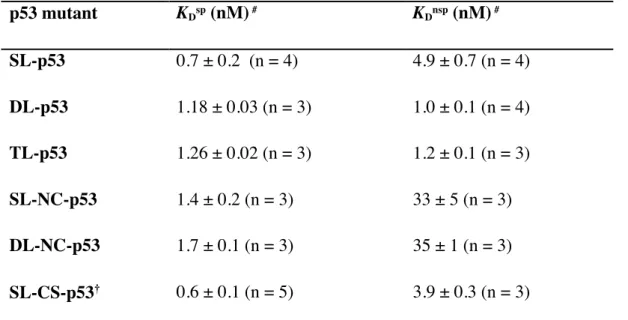
The dissociation constants of all p53 mutants for spDNA, KDsp, were similar, demonstrating
that all mutants could recognize and bind tightly to the target sequence of p53 (Fig. 2-7). In contrast, the dissociation constants for nspDNA, KDnsp, significantly differed among the p53 mutants. The KDnsp
values of DL-p53 and TL-p53 were 4.9- and 4.1-fold lower than that of SL-p53 (Fig. 2-7). In contrast, the KDnsp of SL-NC-p53 was 6.7-fold higher than that of SL-p53 and the KDnsp of DL-NC-p53 was
35-fold higher than the KDnsp of DL-p53 (Fig. 2-7). These results demonstrate that removal of charged
residues from the linker, rather than elongation of the linker, significantly weakened non-specific binding of p53 to DNA. The obtained KD values are listed in Table 2-3. Thus, the results showed that
Fig. 2-6. Fluorescence anisotropy titration curves. (a) p53, (b) DL-p53, (c) TL-p53, (d) SL-NC-p53, and (e) DL-NC-p53 against spDNA and nspDNA at 50 mM KCl. Red circles and blue triangles represent data for spDNA and nspDNA, respectively. Solid curves are the best-fitted curves obtained using Eqs. (2-1) and (2-2).
Fig. 2-7. Equilibrium dissociation constants, KD, for p53 mutants from fluorescence labeled
DNA. (a) KDsp, obtained by fluorescence-anisotropy titration measurements of p53 mutants against
spDNA. (b) Equilibrium dissociation constants, KDnsp, obtained by fluorescence-anisotropy titration
measurements of p53 mutants against nspDNA. The error bars represent the standard error obtained from at least 3 independent measurements for each mutant.
(WT)
Table 2-3. KD values for p53 mutants from specific and non-specific DNAs in buffer containing 50 mM KCl. p53 mutant KDsp (nM) # KDnsp (nM) # SL-p53 0.7 ± 0.2 (n = 4) 4.9 ± 0.7 (n = 4) DL-p53 1.18 ± 0.03 (n = 3) 1.0 ± 0.1 (n = 4) TL-p53 1.26 ± 0.02 (n = 3) 1.2 ± 0.1 (n = 3) SL-NC-p53 1.4 ± 0.2 (n = 3) 33 ± 5 (n = 3) DL-NC-p53 1.7 ± 0.1 (n = 3) 35 ± 1 (n = 3) SL-CS-p53† 0.6 ± 0.1 (n = 5) 3.9 ± 0.3 (n = 3)
#Error bars represent standard error obtained from at least 3 independent measurements for p53
mutants. Number of measurements is listed next to each result as (n = X). †Single-linker charge-shuffled mutant explained in Appendix A.
Effect of linker mutations in p53 on 1D sliding along DNA
To examine the 1D-sliding dynamics of the p53 mutants along DNA, I used TIRF microscopy and the DNA garden technique. The DNA garden method enables high-throughput analysis of the sliding dynamics of p53 along DNA by constructing arrays of tethered DNAs in a flow cell 40. I
introduced fluorescent-labeled p53 mutants into the flow cell, in which many λDNAs were tethered. Because λDNA does not contain target sites of p53, 1D sliding of p53 along nonspecific DNA sequences was observed. Continuous fluorescence spots were recorded using TDI-EM-CCD with a time resolution of 33 ms. The fluorescence spots were tracked and many trajectories ranging from 97 to 537 for different p53 mutants were obtained (Fig. 2-8).
For quantitative analysis, I calculated the averaged mean square displacement (MSD) of each p53 mutant from the trajectories. The MSD plots versus time for all p53 mutants exhibited a linear relationship, suggesting diffusive motion of the mutants along DNA (Fig. 2-9). The averaged diffusion coefficient, D, was obtained by fitting the slope of the MSD plot within 165 ms (Fig. 2-9). The averaged D values for DL-p53 and TL-p53 were respectively 0.120 ± 0.002 and 0.117 ± 0.003 µm2s-1, which were nearly identical to that of SL-p53 (0.128 ± 0.004 µm2s-1). This suggests that the
SL-NC-p53 and DL-SL-NC-p53 were respectively 0.228 ± 0.006 and 0.275 ± 0.007 µm2s-1, which were
significantly higher than those of SL-p53, DL-p53, and TL-p53. These results indicate that neutralization of the linker charge of p53 promotes 1D sliding along DNA.
Fig. 2-8. Single molecule trajectories of p53 samples obtained using single-molecule fluorescence microscopy imaging. (a) SL-p53, (b) DL-p53, (c) TL-p53, (d) SL-NC-p53, and (e) DL-NC-p53 moving along non-specific DNA. Three trajectories are randomly selected and shown in different color for clear visualization.
Fig. 2-9. MSD plot and averaged diffusion coefficient (D). (a) Time courses of averaged mean square displacement (MSD) of SL-p53 (blue), DL-p53 (red), TL-p53 (green), SL-NC-p53 (cyan), and DL-NC-p53 (purple). The errors are standard errors. (b) Averaged diffusion coefficients of p53 mutants estimated from the slope of the MSD plots. The errors are fitting errors.
In general, the mutants with larger KDnsp values have larger D values. However, this
relationship does not always hold. For example, the averaged D value of SL-p53 remained constant at different concentrations of a monovalent cation (K+), while the number of molecules on DNA
different concentrations of a divalent cation (Mg2+) was not related to average K
Dnsp40, 46. Similarly,
SL-p53, DL-p53, and TL-p53 showed similar values for D but 5-fold different KDnsp values. The
affinity of p53 to DNA is determined by the free energy difference between the DNA-bound state and dissociated state. In contrast, the diffusion coefficient is determined from the energy barrier between adjacent binding sites of p53 along DNA, which are regulated by the size and structure of the quaternary complex between p53 and DNA and microscopic association/dissociation of multiple DNA-binding domains regulated by the linker.
Charge neutralization of p53 linker simplifies heterogeneity in 1D sliding
To examine how p53 mutations affect the two sliding modes observed for SL-p53 reported by Agato Murata 40, I analyzed the displacement distribution at a time interval of 165 ms (Fig. 2-10).
As observed for SL-p53, the displacement distributions of DL-p53 and TL-p53 were well-fitted by the sum of two Gaussian functions (Fig. 2-10), corresponding to fast and slow modes in the diffusive dynamics of p53. However, there were small differences in the fractions and D values of the two modes among the three mutants (Table 2-4). As linker length increased, the fraction of the slow mode slightly increased. These results revealed no significant changes in the average D values of SL-p53, DL-p53, and TL-p53 (Fig. 2-9). Thus, linker elongation does not significantly affect the two sliding modes of p53.
Fig. 2-10. Displacement distribution of the sliding dynamics of SL-p53 (blue), DL-p53 (red), TL-p53 (green), SL-NC-p53 (cyan), and DL-NC-p53 (purple) at a time interval of 165 ms. Black curves are the best-fitted curves based on the sum of two Gaussian functions (SL-p53, DL-p53, and TL-p53) and single Gaussian function (SL-NC-p53 and DL-NC-p53). The dashed curves represent the distributions of each sliding mode.
Table 2-4. Fraction and diffusion coefficient of each sliding mode of the p53 mutants.
p53 mutant
Fraction (%) D of each mode (µm2/s)#
Averaged D (µm2/s)$
Fast Slow Fast Slow
SL-p53 43 ± 2 57 ± 2 0.23 ± 0.02 0.035 ± 0.003 0.128 ± 0.004 DL-p53 35 ± 3 65 ± 3 0.24 ± 0.02 0.026 ± 0.002 0.120 ± 0.002 TL-p53 32 ± 1 68 ± 2 0.27 ± 0.01 0.017 ± 0.001 0.117 ± 0.003 SL-NC-p53 100 – 0.230 ± 0.006 – 0.228 ± 0.006 DL-NC-p53 100 – 0.236 ± 0.006 – 0.275 ± 0.007 SL-CS-p53† 65 ± 4 35 ± 3 0.28 ± 0.01 0.039 ± 0.004 0.195 ± 0.003
#D value of each mode was determined by fitting the displacement distribution. $Averaged D values
were determined by MSD plots of all trajectories. †Single-linker charge-shuffled mutant explained in Appendix A.
In contrast, the displacement distributions of SL-NC-p53 and DL-NC-p53 were well-fitted to a single Gaussian function. The D values were 0.230 ± 0.006 and 0.236 ± 0.006 µm2/s for
SL-NC-p53 and DL-NC-SL-NC-p53, respectively. The D values for SL-NC-SL-NC-p53 and DL-NC-SL-NC-p53 were identical to that of the fast mode of SL-p53 (0.23 ± 0.02 µm2/s), indicating that the slow sliding mode was not
observed in neutralized charge linker mutants. The fraction of the slow mode decreased to 0% when the net charge of the linker was 0 (Table 2-4). The higher average D values obtained from the MSD plot for the neutral-charge linker mutants resulted from the loss of the slow mode in these mutants. In fact, the D values obtained from the displacement distribution for SL-NC-p53 and DL-NC-p53 were consistent with the values obtained from the respective MSD plot (Fig. 2-9). Accordingly, charge neutralization of the linker, but not elongation of the linker, simplifies the heterogeneous sliding behavior of p53 along DNA.
2.4 Discussions
In this study, I tested two hypotheses to determine the function of the flexible linker of p53. The first hypothesis was that p53 linker interacts directly with DNA and regulates the binding to and sliding along DNA. The second hypothesis was that the length of the p53 linker affects the efficiency of 1D sliding and target binding by regulating the movement of the core domain. To test these two hypotheses, I examined the effect of elongation and/or charge neutralization of the p53 linker. I found that elongation of the linker did not significantly affect the binding ability to DNA and 1D sliding of p53. In contrast, neutralization of the charges in the linker significantly affected binding ability and sliding. In this section, I discuss the quaternary structure of p53 bound to DNA and molecular mechanism by which the linker of p53 regulates the affinity to and sliding along DNA.
Structural insights into p53 in complex with specific and non-specific DNA
The observed equilibrium dissociation constants, KDsp, of the p53 mutants can be explained
based on the proposed structure of p53 bound to the target DNA. Using X-ray crystallography, the structure of the contact interface between the core domain and target sites were revealed, demonstrating the importance of the core domain in specific binding 31, 32, 39, 59, 93-96. However, all
crystallography studies were conducted using p53 with most of its disordered regions deleted, including the linker. Electron density data obtained by electron microscopy of the full-length p53 bound to the target DNA or a part of the target DNA suggested that the p53 tetramer adopts a closed conformation 60, 61, 97, 98, in which the core domains contact the DNA and the Tet domain is detached
from the DNA with elongated linkers connecting the core and Tet domains. NMR studies suggested that the structure of the p53-DNA complex was consistent with the electron microscopy model with linkers and the Tet domain separated from DNA 62. These previous studies suggested tight contact of
the core domains to the target site and detachment of the linkers from the DNA. In this study, I found that the equilibrium dissociation constants from spDNA were similar for the five mutants used (Fig. 2-7), indicating that p53 recognizes the target site via the core domains and that the linkers do not directly contact the spDNA.
In contrast to the structure of p53 bound to the target DNA, the current data demonstrate direct involvement of the linker in association with non-specific sequences of DNA. Evidence for direct contact includes a significant increase in KDnsp values upon neutralization of the charged residues in
SL-p53 and DL-p53. Furthermore, doubling the charged linker reduced KDnsp (Fig. 2-7). These data
strongly suggest direct contact of the linkers when bound to non-specific DNA. Structural information for p53 contact with non-specific DNA is limited except for electron microscopy studies of the