Three-dimensional lithium mapping of graphite
anode using laser-induced breakdown
spectroscopy
著者
Susumu Imashuku, Hiroyuki Taguchi, Shun
Fujieda, Shigeru Suzuki, Kazuaki Wagatsuma
journal or
publication title
Electrochimica Acta
volume
293
page range
78-83
year
2019-01-10
URL
http://hdl.handle.net/10097/00130255
doi: 10.1016/j.electacta.2018.10.013Three-dimensional lithium mapping of graphite anode using laser-induced breakdown spectroscopy
Susumu Imashukua, Hiroyuki Taguchia, Shun Fujiedab, Shigeru Suzukib, Kazuaki Wagatsumaa
a Institute for Materials Research, Tohoku University, 2-1-1 Katahira, Aoba-ku, Sendai
980-8577, Japan
b Institute of Multidisciplinary Research for Advanced Materials, Tohoku University,
Katahira, Aoba-ku, Sendai 980-8577, Japan Corresponding author: Susumu Imashuku E-mail: [email protected] Tel: +81-22-215-2132
Fax: +81-22-215-2131
ABSTRACT
Herein, a method has been described to rapidly obtain a semi-quantitative three-dimensional lithium distribution of a lithium-ion battery graphite anode using laser-induced breakdown spectroscopy (LIBS) measurements. LIBS measurements of the graphite anodes with a diameter of 10 mm were performed in an argon atmosphere of 1000 Pa until the depth of 150 μm using the Li emission line of 610.4 nm. The emission intensity was measured for the pitch of 500 μm in plane. Homogeneous and inhomogeneous lithium distributions were observed in the anodes after both charge and charge-discharge processes. The inhomogeneous lithium distribution after the charge process was attributed to the preferentially reacted area in the anode, while that after the charge-discharge process was likely related to the low desolvation reaction rate of lithium ions at the solid electrolyte interphase. These inhomogeneous lithium distributions were consistent with the results from the charge-discharge curves and the lithium ion transfer mechanism. Thus, it was proven that it is possible to acquire a three-dimensional lithium distribution of a graphite anode of a lithium-ion battery by LIBS measurements.
Keywords: Three-dimensional distribution, semi-quantitative lithium analysis, laser-induced
1. Introduction
Owing to their high power density and a relatively good cycle life, lithium-ion batteries have been the preferred energy source for small electronic devices such as laptop computers and smartphones. Recently, they have been applied to larger devices such as electric vehicles and stationary electric energy storage systems. Suppression of the degradation at high charge-discharge rates and under prolonged cycling is a key factor for lithium-ion batteries to be more widely applied in larger devices [1-5]. The degradation of lithium-ion batteries is characterized by capacity loss and an increase in impedance, which are caused by a macroscopic inhomogeneous reaction distribution in electrodes [6] resulting from microscopic factors such as electrode disintegration, material deterioration, loss of free lithium, surface layer formation, and contact deterioration [7,8]. The inhomogeneous reaction distribution in the electrodes is prominent in lithium-ion batteries that are used for large-scale devices at high charge-discharge rates owing to their size [9,10]. Therefore, visualizing the macroscopic inhomogeneous reaction distribution plays an important role in maintaining the performance and stability of large-scale lithium-ion batteries. However, there are fewer analytical methods available to visualize the macroscopic inhomogeneous reaction distribution in the electrode in contrast to techniques to investigate the microscopic inhomogeneous reaction distribution [7,11]. The analytical methods proposed for the visualization of the macroscopic inhomogeneous reaction distribution in the anode include Raman spectroscopy [12,13], X-ray tomography [14], neutron diffraction [15], laser triangulation measurement [16], spatially resolved X-ray diffraction [17], glow discharge optical emission spectroscopy [18], and lock-in thermography [6]. The lack of suitable analytical methods is due to the fact that the anode normally consists of only carbon (graphite) and lithium.
Several studies have previously focused on laser-induced breakdown spectroscopy (LIBS) as a technique for displaying inhomogeneous reaction distributions in electrodes in lithium-ion batteries [19-23]. This is because spatial resolution of a few hundred micrometers in plane and dozens of micrometers in depth can be attained by using the pulse laser in LIBS, whereas the other analytical techniques mentioned above, such as Raman spectroscopy, neutron diffraction, and X-ray diffraction, are limited to two-dimensional mapping. Additionally, LIBS can detect straightforward signals from lithium as light associated with the deexcitation of lithium atoms in a plasma that is produced using an intense laser pulse. We have recently proposed a method to obtain the quantitative two-dimensional lithium distribution of a lithium-ion battery cathode by performing LIBS measurements in an argon atmosphere of 1000 Pa and using standard samples with different lithium concentrations [23]. In this study, three-dimensional lithium distributions of a graphite anode were acquired by advancing the previously reported LIBS measurements. The formation of inhomogeneous lithium distributions of the graphite anode has been discussed in terms of their charge-discharge curves and the lithium ion transfer mechanism. Graphite and LiCoO2 were selected
as the active materials in the anode and cathode, respectively, because they are the most widely-used electrode materials in lithium-ion batteries. To our knowledge, this study is the first to confirm the validity of the three-dimensional lithium distributions of the anode obtained by LIBS measurements together with the electrochemical interpretation.
2. Experimental
Graphite sheet (The Nilaco Corporation, Tokyo, Japan) with a thickness of 150 (99% purity) or 300 μm (99.5% purity) was cut into a disk with a diameter of 10 mm and used as the anode. The graphite sheet mainly were consisted of particles with a size below 20 μm as shown in Fig. S1. We used the graphite sheet with a thickness of 300 μm to acquire as many
LIBS mappings in depth as possible even though the thickness of 300 μm is larger than that of a commercial lithium-ion battery anode (approximately 100 μm [24]). The cathode material was prepared by mixing LiCoO2 powder (99.8% purity, Sigma-Aldrich Co. LCC, MO, USA)
as the active material, acetylene black as the conductive additive, and polytetrafluoroethylene as the binder in a weight ratio of 14:5:1. The mixture was stretched into a sheet with a thickness of approximately 300 μm using an agate mortar. The cathode was cut into a disk with a diameter of 10 mm from the sheet and dried together with the anode at 353 K. A lithium-ion battery cell was assembled using the cathode, anode, polyethylene film as the
separator, and 1 mol dm−3 LiPF6 dissolved in a mixed solution of ethylene carbonate and
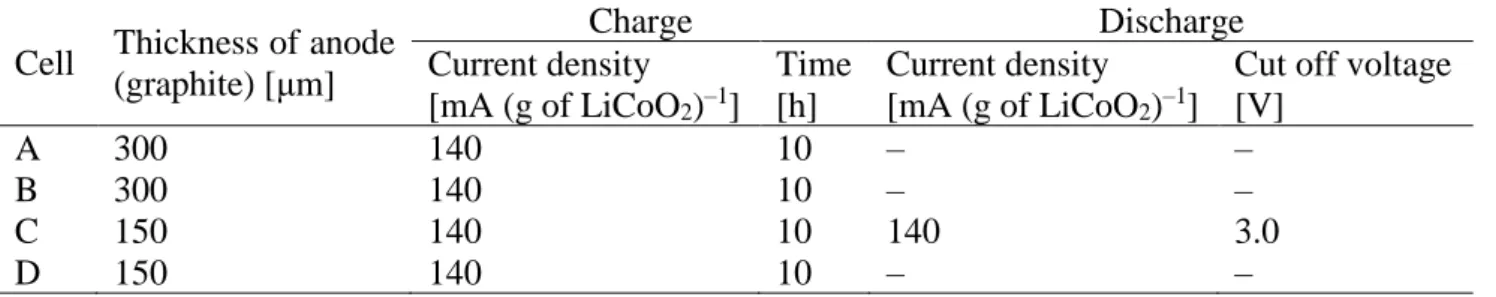
dimethyl carbonate (1:1, v/v) as the electrolyte (Fig. 1). The assembly process was carried out in an argon-filled glove box, where the dew point of water and the concentration of oxygen were controlled at less than –70 °C and 10 ppm, respectively. The assembled cells were charged and discharged under the four conditions listed in Table 1 using a battery charge-discharge system (HJ1001SD8, Hokuto Denko Corporation, Tokyo, Japan). The assembled cells were charged at 14 mA g–1 based on the LiCoO2 weight for 10 h (0.1 C) and discharged
at 14 mA g–1 until the voltage between the cathode and anode became 3.0 V. After the charge-discharge test, the cathode was washed in a mixed solution of ethylene carbonate and dimethyl carbonate (1:1, v/v).
LIBS measurements of the anodes were performed using a custom LIBS system, as reported previously [23]. In brief, a Q-switched Nd:YAG laser (LOTIS TII, LS-2137) with a wavelength of 532 nm was used. The energy and duration of the pulsed laser irradiated on the samples were 20 mJ/pulse and 16–18 ns, respectively. A single pulse was shot from the laser onto the samples for each measurement point. The pulsed laser was focused on the samples using a plano-convex lens with a focal length of 150 mm. The light emitted from the plasma was collected using a plano-convex lens with a focal length of 100 mm and diameter of 50
mm, through an optical fiber to a spectrometer system consisting of a Czerny-Turner spectrograph (MS 7504i, SOL Instruments Ltd., Minsk, Belarus) and an intensified charge-coupled device (ICCD) detector (DH334T-18F-03, Andor Technology Ltd., Belfast, UK). The gate of the ICCD detector was triggered by the laser and the relative delay was controlled by the digital delay generator integrated in the ICCD detector. The gate width and the relative delay were set to 20 μs and 800 ns, respectively. The anodes were placed in a chamber, which enabled the atmosphere to be controlled by introducing gas and the connection of a rotary pump. The analyzed positions of the sample in the x and y directions were controlled by placing the chamber on linear transition automatic stages. Similar to a previous report [19], the LIBS measurements were conducted in an argon atmosphere of 1000 Pa by measuring the intensities of the Li I 610.4 nm emission line because a self-absorption effect of lithium was buffered and the emission intensity of the Li I 610.4 nm line correlated with the lithium concentration under the measurement condition. A quarter area of the anodes was analyzed by irradiating a specified number of pulses from a pulse laser on the same point in sequence. Subsequently, the measured points were moved. The pitch of the measured points on the anodes was 500 μm. The intensities of the Li I 610.4 nm emission line were calibrated by measuring the intensity of the pristine cathode material before the LIBS measurement of each anode.
3. Results and discussion
Three-dimensional LIBS mappings of lithium for the graphite anodes were acquired by irradiating the single pulse laser several times on the same point of the sample. In this case, the volumes sputtered by the pulse laser were likely decreased with the increasing number of the pulses because of the defocusing of the laser. We first investigated the relationship between the sputtered volume and the number of the pulses by measuring the depths and
diameters of the dimples formed by each irradiation of the pulse using a digital microscope (VHX-1000, KEYENCE Corp., Osaka, Japan). The graphite sheet with a thickness of 300 μm was used for the measurement. We selected the graphite sheet instead of a composite graphite used for a conventional lithium-ion battery anode because the depth of a dimple formed by a single pulsed laser for the graphite sheet was smaller than that for the composite graphite owing to the hardness of the graphite sheet. Figure 2 shows the measured depth and diameter of the dimples for each irradiation of the pulse laser as a function of the number of the pulses. The depths of the dimples increased almost linearly with the increasing number of pulses until the ninth pulse, while those for the tenth and fifteenth pulse deviated from linearity. The tendency that the ablation rate of the graphite sheet decreased at higher depths is consistent with that previous papers [25,26]. It is reported in the paper that the reduction of the ablation rate is due to the solidification of the molten and redeposited material after laser-induced ablation at the bottom of the dimple [26]. In contrast, the diameters of the dimples were almost constant for every pulse. Therefore, it was speculated that the sampling volume of the LIBS measurements was constant until the ninth pulse. In the subsequent measurements, LIBS mappings were acquired from the surface up to a depth of 150 μm, where the ninth pulse of the laser reached in the graphite layer with a thickness of 300 μm.
The LIBS mappings of lithium for graphite anodes were acquired after the charge-discharge test under the four different conditions listed in Table 1. Figure 3 shows the charge and discharge curves of the cells under the specified conditions. We charged the cells until the specific capacity of LiCoO2 in the cathodes reached 140 mAh g–1, which is nearly the
maximum reversible specific capacity of LiCoO2 and below which the cells can be operated
without any appreciable capacity loss [27]. At the end points of the charging, the specific capacities of graphite in the anodes corresponded to 73, 73, 173, and 173 mAh g–1 for cells A, B, C, and D, respectively. These specific capacities were within the theoretical maximum
reversible specific capacities of graphite (372 mAh g–1) [28-30]. Additionally, the charge and discharge curves of all the cells were in good agreement with a typical charge and discharge curve of a LiCoO2/graphite cell [31]. It is also reported that a graphite sheet, whose particle
size is larger than that of the graphite sheet we used in the present study, works correctly as an anode of lithium-ion battery [32]. Therefore, the cells in the present study were correctly operated as a lithium-ion battery.
Figure 4 shows the three-dimensional mappings of lithium for the graphite anodes with a thickness of 300 μm after charging until 140 mAh g–1 of LiCoO2 (cell A and B). The
mappings were acquired from the surface of the graphite contacted with the separator (first layer) to the area with a depth of 150 μm (ninth layer). The distribution of intensities of the Li I 610.4 nm emission line for cell A was relatively homogeneous for all the measured depths. In contrast, the intensities of the Li I 610.4 nm emission line for cell B decreased with the increasing depth of graphite. Additionally, the intensities of the Li I 610.4 nm emission line seemed to be high around the edge and low near the center for almost all depths of cell B. It should be noted that the in-plane mappings represent macroscopic lithium distributions because of the sampling pitch of 500 μm. These inhomogeneous lithium distributions of cell B were similar to those of previously reported experimental [15-17,33] and simulation [34] results. In the reports, the inhomogeneous distribution of lithium was due to the geometric effect, leading to overpotential at the edge and surface of the anodes. As a result, the charge reaction of the anode preferentially occurred at the edge and the surface of the anode, and the overall anode resistance was increased. By comparing the charge curves of cells A and B (shown in Fig. 3(a)), it was rationalized that the inhomogeneous lithium distribution was linked to the increase in the anode resistance. This is because the voltage of cell B was higher than that of cell A at the end of the charge. Figure 3(a) indicates that the inhomogeneous lithium distribution in cell B was initiated at ~90 mAh g–1 of LiCoO2 because the charge
curve of cell B deviated from that of cell A at the capacity. However, the reason for the different lithium distributions at the same charging condition was not evident. Nevertheless, it was inferred that the inhomogeneous lithium distributions were related to the geometry of the cells. In the present study, the center of the anode of cell B might have been placed out of alignment with that of the cathode during cell assembling. In addition, the thickness of the anodes might be also related to the inhomogeneous lithium distributions because the thickness of the anodes were three times thicker than that of a commercial lithium-ion battery anode.
We also acquired three-dimensional lithium mappings for the graphite anode, whose thickness was close to that of the commercial lithium-ion battery anode, after discharging (cell C). The thickness of the graphite anode was 150 μm and the obtained LIBS mappings are shown in Fig. 5(a). Additional emission signals due to a base under the graphite anode were detected after the seventh pulse as shown in Fig. S2, which indicates that the laser reached the backside of the graphite anode. Therefore, we showed the LIBS mapping until the fifth layer which corresponded to approximately 100 μm in depth. Intensities of the Li I 610.4 nm
emission line for cell C were less than half compared to those for charged cells (cell A and B) at all depths. Intensities of the Li I 610.4 nm emission line for cell C decreased with the increasing depth of the graphite and were high around the edge of the anode. This inhomogeneous lithium distribution occurred during the discharge process. This is because a relatively homogeneous lithium distribution was observed for the charged cell (cell D) with the same charging condition as cell C (Table 1) and a quite similar charging curve to that of cell C (Fig. 3(b)), as shown in Fig. 5(b). Based on Fig. 3(b), it was suggested that a solid electrolyte interphase (SEI) was formed on the graphite anode of cell C because the loss of the specific capacity of cell C was observed after the discharge process. It is reported that the desolvation process of lithium ions at the SEI is the rate-determining step of lithium ion transfer at graphite [35], which indicates that it takes longer time for lithium ions to be
completely diffused out from the graphite anode during the discharge process than that during the first charge process. As a result, it is speculated that lithium ions deep inside the anode after the charge process may remain near the surface contacting with the separator and the edge of the anode after the discharge process. Hence, the surface contacting with the separator and the edge of the anode for cell C showed higher intensities of the Li I 610.4 nm emission line compared to those of other areas. It is worth noting that the LIBS measurements in the present study did not detect the SEI because the thickness of the SEI is on a nanometer scale [11,36,37] which is five orders of magnitude smaller than the diameter of dimples formed by the irradiation of the laser pulse.
Furthermore, the results obtained in the present study confirm that it is possible to obtain three-dimensional LIBS mappings of lithium for graphite anodes, which is consistent with the lithium distributions interpreted from the charge–discharge curves of the cells and lithium ion transfer mechanism in the graphite anode. Therefore, the LIBS measurements are a promising rapid and easily-handled procedure to trace the charge-discharge process occurring in lithium ion batteries.
4. Conclusions
In this study, it was demonstrated that we can semi-quantitatively acquire the three-dimensional lithium distribution for a graphite anode of a lithium-ion battery by performing LIBS measurements in an argon atmosphere of 1000 Pa and relating the obtained lithium distributions to the results of electrochemical measurements. The lithium distribution was obtained by measuring the intensities of the Li I 610.4 nm emission line until 150 μm in depth. The pitch of the measured point on the anodes was 500 μm in-plane. When LIBS measurements were conducted for anodes charged at 14 mA g–1 based on LiCoO2 weight for
with the lower and higher endpoint cell voltages, respectively. The inhomogeneity of the anode originated from preferential reaction areas, which led to larger resistances of the anode. When we performed LIBS measurements for the anode charged at 14 mA g–1 of LiCoO2 for
10 h and discharged at 14 mA g–1 of LiCoO2 until the cell voltage became 3.0 V, the lithium
distribution was inhomogeneous. This inhomogeneous lithium distribution might be related to the low reaction rate of the desolvation process of lithium ions at the SEI. The lithium distributions obtained by the LIBS measurements could be explained on the basis of the charge-discharge curves of the cells and lithium ion transfer in graphite anode. Therefore, LIBS can provide a semi-quantitative three-dimensional lithium distribution of the graphite anode in sub millimeter scale in plane and dozens of micrometer scale in depth. Further studies are now continuing to convert the semi-quantitative mapping of lithium into the quantitative spatial distribution when the calibration is performed using stoichiometric compounds such as LiC6, LiC12, or LiC18.
Acknowledgements
Financial support for the present study was provided by JSPS KAKENHI Grant No. 16K14444.
References
[1] S. Huang, Z. Wen, X. Yang, Z. Gu, X. Xu, Improvement of the high-rate discharge properties of LiCoO2 with the Ag additives, J. Power Sources 148 (2005) 72.
[2] M. Okubo, E. Hosono, J. Kim, M. Enomoto, N. Kojima, T. Kudo, H. Zhou, I. Honma, Nanosize effect on high-rate Li-ion intercalation in LiCoO2, J. Am. Chem. Soc. 129
(2007) 7444.
[3] J. W. Fergus, Recent developments in cathode materials for lithium ion batteries, J. Power Sources 195 (2010) 939.
[4] V. Etacheri, R. Marom, R. Elzari, G. Salitra, D. Aurbach, Challenges in the development of advanced Li-ion batteries: A review, Energy Environ. Sci. (2011) 3243. [5] T. Nakamura, T. Watanabe, K. Amezawa, H. Tanida, K. Ohara, Y. Uchimoto, Z. Ogumi,
Evaluation of the effective reaction zone in a composite cathode for lithium ion batteries, Solid State Ionics 262 (2014) 66.
[6] P. Michalowski, A. Gräfenstein, M. Knipper, T. Plaggenborg, J. Schwenzei, J. Parisi, Examining inhomogeneous degradation of graphite/carbon black composite electrodes in Li-ion batteries by lock-in thermography, J. Electrochem. Soc. 164 (2017) A2251. [7] R. Hausbrand, G. Cherkashinin, H. Ehrenberg, M. Gröting, K. Albe, C. Hess, W.
Jaegermann, Fundamental degradation mechanisms of layered oxide Li-ion battery cathode materials: Methodology, insights and novel approaches, Mater. Sci. Eng. B-Solid State Mater. Adv. Technol. 192 (2015) 3.
[8] J. Vetter, P. Novák, M. R. Wagner, C. Veit, K. C. Möller, J. O. Besenhard, M. Winter, M. Wohlfahrt-Mehrens, C. Vogler, A. Hammouche, Ageing mechanisms in lithium-ion batteries, J. Power Sources 147 (2005) 269.
[9] L. Lu, X. Han, J. Li, J. Hua, M. Ouyang, A review on the key issues for lithium-ion battery management in electric vehicles, J. Power Sources 226 (2013) 272.
[10] S. Taminato, M. Yonemura, S. Shiotani, T. Kamiyama, S. Torii, M. Nagao, Y. Ishikawa, K. Mori, T. Fukunaga, Y. Onodera, T. Naka, M. Morishima, Y. Ukyo, D. S. Adipranoto, H. Arai, Y. Uchimoto, Z. Ogumi, K. Suzuki, M. Hirayama, R. Kanno, Real-time observation of lithium battery reactions–operando neutron diffraction analysis during practical operation, Sci. Rep. 6 (2016) 28843.
[11] P. Verma, P. Marire, P. Novák, A review of the features and analyses of the solid electrolyte interphase in Li-ion batteries, Electrochim. Acta 55 (2010) 6332.
[12] J-C. Panitz, P. Novák, Raman microscopy as a quality control tool for electrodes of lithium-ion batteries, J. Power Sources 97-98 (2001) 174.
[13] V. A. Sethuraman, L. J. Hardwick, V. Srinivasan, R. Kostecki, Surface structural disordering in graphite upon lithium intercalation/deintercalation, J. Power Sources 195 (2010) 3655.
[14] D. Kehrwald, P. R. Shearing, N. P. Brandon, P. K. Sinha, S. J. Harris, Local tortuosity inhomogeneities in a lithium battery composite electrode, J. Electrochem. Soc. 158 (2011) A1393.
[15] L. Cai, K. An, Z. Feng, C. Liang, S. J. Harris, In-situ observation of inhomogeneous degradation in large format Li-ion cells by neutron diffraction, J. Power Sources 236 (2013) 163.
[16] C. Birkenmaier, B. Bitzer, M. Harzheim, A. Hintennach, T. Schleid, Lithium plating on graphite negative electrodes: innovative qualitative and quantitative investigation methods, J. Electrochem. Soc. 162 (2015) A2646.
[17] D. Burow, K. Sergeeva, S. Calles, K. Schorb, A. Bröger, C. Roth, P. Heitjans, Inhomogeneous degradation of graphite anodes in automotive lithium ion batteries under low-temperature pulse cycling conditions, J. Power Sources 307 (2016) 806. [18] N. Ghanbari, T. Waldmann, M. Kasper, P. Axmann, M. Wohlfahrt-Mehrens,
Inhomogeneous degradation of graphite anodes in Li-ion cells: A postmortem study using glow discharge optical emission spectroscopy (GD-OES), J. Phys. Chem. C 120 (2016) 22225.
[19] V. Zorba, J. Syzdek, X. Mao, R.E. Russo, R. Kostecki, Ultrafast laser induced breakdown spectroscopy of electrode/electrolyte interfaces, App. Phys. Lett. 100 (2012) 234101.
[20] L. Cheng, J.S. Park, H. Hou, V. Zorba, G. Chen, T. Richardson, J. Cabana, R. Russo, M. Doeff, Effect of microstructure and surface impurity segregation on the electrical and electrochemical properties of dense Al-substituted Li7La3Zr2O12, J. Mater. Chem. A 2
(2014) 172.
[21] P. Smyrek, J. Pröll, H.J. Seifert, W. Pfleging, Laser-induced breakdown spectroscopy of laser-structured Li(NiMnCo)O2 electrodes for lithium-ion batteries, J. Electrochem. Soc.
163 (2016) A19.
[22] P. Gotcu, W. Pfleging, P. Smyrek, H.J. Seifert, Thermal behavior of LiMeO2 (Me = Co
[23] S. Imashuku, H. Taguchi, T. Kawamata, S. Fujieda, S. Kashiwakura, S. Suzuki, K. Wagatsuma, Quantitative lithium mapping of lithium-ion battery cathode using laser-induced breakdown spectroscopy, J. Power Sources 399 (2018) 186.
[24] J. S. Wang, P. Liu, E. Sherman, M. Verbrugge, H. Tataria, Formulation and characterization of ultra-thick electrodes for high energy lithium-ion batteries employing tailored metal forms, J. Power Sources 196 (2011) 8718.
[25] J. Agresti, I. Osticioli, A. A. Mencaglia, S. Siano, Laser induced plasma spectroscopy depth profile analysis: a contribution to authentication, Proc. SPIE 8790, Optics for Arts, Architecture, and Archaeology IV 879001 (2013). https://doi.org/10.1117/12.2020701 [26] J. Oelmann, N. Gierse, C. Li, S. Brezinsek, M. Zlobinski, B. Turan, S. Haas, Ch.
Linsmeier, Depth-resolved sample composition analysis using laser-induced ablation-quadrupole mass spectrometry and laser-induced breakdown spectrometry, Spectrochim. Acta Part B 144 (2018) 38.
[27] R. Koksbang, J. Barker, H. Shi, M. Y. Saidi, Cathode materials for lithium rocking chair batteries, Solid State Ion 84 (1996) 1.
[28] B. M. Way, J. R. Dahn, The effect of boron substitution in carbon on the intercalation of lithium in Lix(BZC1–Z)6, J. Electrochem. Soc. 141 (1994) 907.
[29] S. Flandrois, B. Simon, Carbon materials for lithium-ion rechargeable batteries, Carbon 37 (1999) 165.
[30] N. Kambe, M. S. Dresselhaus, Intercalate ordering in first stage graphite–lithium, Mater. Sci. Eng. 40 (1979) 1.
[31] T. Ohzuku, A. Ueda, M. Nagayama, Y. Iwakoshi, H. Komori, Comparative study of LiCoO2, LiNi1/2Co1/2O2 and LiNiO2 for 4 volt secondary lithium cells, Electrochim.
Acta 38 (1993) 1159.
[32] M. S. Yazici, D. Krassowski, J. Prakash, Flexible graphite as battery anode and current collector, J. Power Sources 141 (2005) 171.
[33] J. Sturm, F. B. Spingler, B. Rieger, A. Rheinfeld, A. Jossen, Non-destructive detection of local aging in lithium-ion pouch cells by multi-directional laser scanning, J. Electrochem. Soc. 164 (2017) A1342.
[34] M. Tang, P. Albertus, J. Newman, Two-dimensional modeling of lithium deposition during cell charging, J. Electrochem. Soc. 156 (2009) A390.
[35] T. Abe, H. Fukuda, Y. Iriyama, Z. Ogumi, Solvated Li-ion transfer at interface between graphite and electrolyte, J. Electrochem. Soc. 151 (2004) A1120.
[36] T. Yoshida, M. Takahashi, S. Morikawa, C. Ihara, H. Katsukawa, T. Shiratsuchi, J. Yamaki, Degradation mechanism and life prediction of lithium-ion batteries, J. Electrochem. Soc. 153 (2006) A576.
[37] K. Edström, M. Herstedt, D. P. Abraham, A new look at the solid electrolyte interphase on graphite anodes in Li-ion batteries, J. Power Sources 153 (2006) 380.
Table 1 Charge and discharge conditions of the assembled cells.
Cell Thickness of anode (graphite) [μm] Charge Discharge Current density [mA (g of LiCoO2)–1] Time [h] Current density [mA (g of LiCoO2)–1]
Cut off voltage [V]
A 300 140 10 – –
B 300 140 10 – –
C 150 140 10 140 3.0
Figure 1
Figure 2
Fig. 2. (a) Depth and (b) diameter of the dimples formed by irradiating the pulse laser as a
Figure 3
Figure 4
Fig. 4. LIBS mappings of the intensities of the Li I 610.4 nm emission line for the anode of cell (a) A and (b) B from
the surface to the area irradiated nine times by the pulse laser. The first layer corresponded to the surface in contact with the separator. The gray dots represent the unmeasured area.
Figure 5
Fig. 5. LIBS mappings of the intensities of the Li I 610.4 nm emission line for the anodes of
(a) cell C and (b) cell D from the surface to the backside obtained by irradiating the pulse laser five times. The first layer corresponded to the surface in contact with the separator. The gray dots represent the unmeasured area.
Figure S1
Figure S2
Fig. S1. LIBS spectra for the (a) first layer and (b) seventh layer of the anode of cell D at the