Introduction of data-driven approach into food industry
– a case study on fish sauce –
Contents
1 Introduction 3
2 Mining online activity data to understand food consumption behaviour: the case of
Asian fish sauce among Japanese consumers 9
2.1 Introduction 9
2.2 Materials and Methods 12
2.3 Results 14
2.4 Discussion 19
3 Electronic nose and chemical analyses of commercial fish sauce products show
country-specific preferences 28
3.1 Introduction 28
3.2 Materials and Methods 31
3.3 Results 33
3.4 Discussion 37
4 Clustering of commercial fish sauce products based on an e-panel technique and
4.1 Introduction 50
4.2 Materials and Methods 52
4.3 Results and discussion 56
5 Introduction of data-driven approach to food production: a case study of salmon
fish sauce
67
5.1 Introduction 67
5.2 Materials and Methods 71
5.3 Results 74
5.4 Discussion 78
Acknowledgement 91
References 92
Abstract (in Japanese) 101
1. Introduction
The most essential need for all living organisms is energy, which is usually obtained by
consuming food. But for human being, it is also a source of pleasure and comfort, and
reflects and conveys information relating to personal and cultural characteristics, social
status and relationships. In other words, the food affects all aspects of human life.
Humans are faced with several food choices each day and make decisions on what food
to eat based on several criteria. It can be considered as common knowledge that people
have different food preferences.
In the food industry filed, consumer research surveys and interviews are
performed to acquire the information regarding consumer preferences and acceptances
(Honkanen & Frewer 2009; Kearney et al. 2000; Milošević et al. 2012), to construct
concepts for new products. On the other hand, the consumer acceptance to the foods
may be assessed by the sensory evaluations using trained panels. In this “traditional”
approach for the product development, many human cooperators are needed for the
analyses, the quality of the analyses highly depends on the prepared questions and
capacity of interviewer (Krosnick and Presser, 2010; Bastian et al., 2015). Furthermore,
to gather good results from the sensory evaluations, the panels should be trained with
great time and efforts (Murray et al., 2001).
Information is needed for making decision in every situation containing
business. Data is a set of values of quantitative or quantitative variables. Pieces of data
are individual pieces of information. Making decision using data is not new concept.
For example, in Major League Baseball, data is presented for managers each season in
the Bill James Handbook. Bill James is the innovator of advances statistics and
SABR-metrics for baseball and an annual volume of informative statistics are still
printed each year after conclusion of season before the next season begins from 1977
(Paul et al., 2016).
Big data and its analysis are the center of modern science and business. These
data are generated from online transaction, emails, videos, audios, images, click streams,
logs, posts, search queries, health records, social networking, interactions, science data,
bytes) of data were created by human. In 2012, digital world of data was expanded to
2.72 zettabytes (1021 bytes).
Due to the development of information technology, various data related to
dairy life and business, containing online search records or measurement data using
sensors, are accumulated in some available databases. Judgment and decision making
utilizing these data are carried out, in many fields such as medical care, education and
sports. In the field of business, a "data-driven approach" is gathering the attention to
solve problems in product development and marketing by analyzing the complex
diversifying consumer demands, based on a wide variety of data. However, at the site of
the sixth sector industrialization aiming at regional activation, it would be
“product-driven performance” depending only on the products that can be manufactured
by the business operator, because the company size and products that can be produced
are limited. These problems make mismatch with customers’ demands and prevent
product differentiation. In this study, the author discussed an industry of fish sauce as an
example of such cases.
subsequently fermented in a natural environment. Recent investigation indicates that
interest in fish sauce produced in Japan has gradually declined among the Japanese
people. Despite the waning consumer demand, however, the production of fish sauce
has gained attention, and many local fish sauce products are being produced to revitalise
local communities that have the advantage of an abundant supply of inedible fish
material at low market value that can be used for the production. This situation indicates
a large gap between consumer demand and supply.
In this study, the author introduced the “data-driven approach” to the fish
sauce market analysis, and discussed market potential of the fish sauce in Japan. First,
the data related to consuming fish sauce was collected from the web site including
Google search and Cookpad to analyze consumer behavior. Next, the author analyzed
"smell" "taste" and "color" of 46 types of commercial fish sauce manufactured in Asian
countries by electronic panel (e-panel) analyses containing electronic tongue (e-tongue),
nose (e-nose) and eye (e-eye) sensory assessments. Along with the e-panel analysis, the
chemical properties of these fish sauces were also analyzed to characterize the fish
data, it became clear that the demand for Japanese fish sauce as a seasoning of nabe
cuisine is increasing only in winter. Furthermore, it suggests that the popularity of
shirako seafood is rising as an ingredient of nabe cuisine. Based on the results, the
author made a prototype fish sauce containing shirako and analyzed its smell, taste and
2. Mining online activity data to understand food consumption behaviour: the case
of Asian fish sauce among Japanese consumers
2.1. Introduction
Consumers choose food based on many factors, such as flavour, appearance, nutritional
value, function, and package label (Borgmeier & Wstenhoefer 2009). Further,
familiarity with the food is an important factor in consumer acceptance (Verneau et al.
2013). To understand consumer preference and acceptance, food researchers and
developers conduct consumer research surveys and interviews (Honkanen & Frewer
2009; Kearney et al. 2000; Milošević et al. 2012), and based on their consumer research,
they construct concepts for new products and produce pilot-scale products. This
traditional approach to product development requires many human respondents for the
questionnaires, interviews, and sensory evaluations. The quality of the questionnaire
capabilities (Bastian et al. 2015).
Today, information technology has enabled the accumulation of large amounts
of data from social websites and the simple extraction of such data using search engines.
Economists (Carrière-Swallow & Labbé 2013; Choi & Varian 2012; Vosen & Schmidt
2011), policy makers (Ripberger 2011), epidemiologists (Carneiro & Mylonakis 2009;
Seifter et al. 2010), and biologists (Mccallum & Bury 2013; Proulx et al. 2013)
increasingly use accumulated online data to understand markets, public opinion trends,
the spread of human infectious diseases, and conservation of creatures’ behaviours.
Recently, in addition to websites that provide general information, online recipe sites
such as Cookpad (https://cookpad.com) and Allrecipes (http://allrecipes.com) have
become popular among households for finding user-generated recipes and for planning
meals.
Meanwhile, fish sauce is a brown liquid seasoning widely consumed in most Southeast
Asian countries. The name for fish sauce varies across countries: nampla in Thailand,
nuoc mam in Vietnam, and shottsuru in Japan (Akita Prefecture). In general, fish sauce
microorganisms are often used as a starter to hasten the fermentation. During the
fermentation process, the proteins in the fish material are hydrolysed into amino acids
and peptides both by endogenous and microorganism proteases, which results in the
distinctive taste of the fish sauce (Lopetcharat et al. 2001; Taira et al. 2007). The
fermentation process also produces volatile compounds responsible for the
characteristic odor of the fish sauce (Yongsawatdigul et al. 2007; Zheng et al. 2017).
In Japan, fish sauce had been widely consumed as a substitute for soy sauce
and miso, especially in coastal areas. However, its consumption declined after the
emergence of industrial production and commercial availability of soy sauce brought by
the drastic change in Japanese society after the Meiji era (Ishige, 1986). Thereafter, the
production of fish sauce was seen only in limited areas (i.e. shottsuru in Akita
Prefecture and ishiru in Ishikawa Prefecture). Our recent investigation indicates that
interest in fish sauce produced in Japan has gradually declined among the Japanese
people (Nakano et al., in submission). Despite the waning consumer demand, however,
the production of fish sauce has gained attention, and many local fish sauce products are
supply of inedible fish material at low market value that can be used for the production.
This situation indicates a large gap between consumer demand and supply.
In this study, we employed Google Trends, which enables the plotting of
Google search queries related to a topic, to analyse consumption behaviours for fish
sauce in Japan. In addition, we employed Tabemiru, a tool provided by online recipe
repository Cookpad, which enables the analysis of the frequency of recipe use to
analyse household consumption of fish sauce. The combined data from Google Trends
and Tabemiru represent the household consumption behaviour for fish sauce in Japan.
2.2. Materials and methods
Collection of data from Google Trends
Temporal or regional trends in web searches for the terms of concern to this study were
downloaded from Google Trends (https://trends.google.com/trends/). Google Trends is a
public web facility of Alphabet Inc. (Mountain View, CA, USA) that shows how often
people search for a term relative to the total number of searches, in various countries
‘Japan’ and the time parameter to ‘2004-present’.
Collection of data through Tabemiru on Cookpad
Cookpad, Japan’s largest recipe site (http://www.cookpad.com), allows visitors to
upload and search for original recipes. Tabemiru is an analysis tool provided by
Cookpad Inc. (Tokyo, Japan) that allows visitors to analyse how often recipes, including
relevant search terms, are used by Cookpad visitors. The frequency is expressed as the
cook index (CI), in which Tabemiru counts a recipe that has been viewed continuously
for more than 10 minutes as ‘made or cooked by the visitor of the site’. The CI is
calculated using the following formula: number of times for which a recipe, including
relevant search terms, was used for cooking / total number of recipes that were made ×
1,000.
Statistical analysis
The correlation between Google Trends-based search volumes and household
plots and regression statistics using the coefficient of determination and Pearson’s
correlation coefficient. Additionally, the correlations between the search volumes for the
terms for fish sauce and for the names of dishes were assessed in the same manner. All
statistical analyses were performed using Microsoft Excel for Mac (version 15.31;
Redmond, WA, USA).
2.3. Results
Google search trends for fish sauce among Japanese consumers
We entered the set of terms ‘ナンプラー’ (nampla; Thai fish sauce), ‘ニョクマム’
(nuoc man; Vietnamese fish sauce), and ‘しょっつる’ (shottsuru; Japanese fish sauce)
on the Google Trends homepage on August 2017 to access search trends for these three
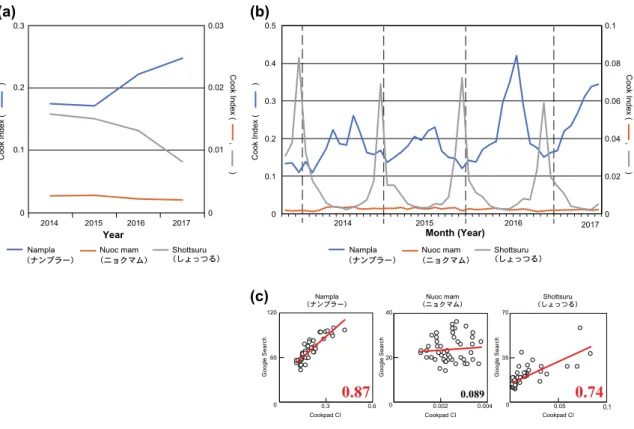
keywords. Fig. 1 (a) shows the Google Trends graph depicting the search frequency for
the three terms from January 2004 to August 2017. Among the three terms, the nampla
searches had the most traffic, nine times more than that for the nuoc mam searches and
three times more than that for the shottsuru searches on average. Interestingly, the
search trend for nampla reaches a peak in the summer and reaches a valley in the winter.
demonstrates a sharp peak in December. Such seasonal search trends were not observed
for nuoc mam. The search trends for the three terms for fish sauce on the Google
Shopping site were also analysed, as shown in Fig. 1 (b). Nampla searches occurred
every year after 2012, whereas shottsuru searches occurred only in the winter of 2011
and 2014. Nuoc mam searches were not observed for any year.
Google Trends also lists the prefectures with the highest search traffic for a given term.
As shown in Figure 2, for the shottsuru searches, 17 of 47 prefectures were listed, with
Akita Prefecture showing a remarkably high search traffic. On the other hand, the term
nampla was widely searched by all prefectures in Japan. The nuoc mam searches
occurred only in metropolitan areas with large populations, such as the Kanagawa,
Tokyo, Saitama, and Osaka prefectures’.
Household consumption behaviour for fish sauces in Japan
To clarify the household consumption behaviour for the three fish sauce types in Japan,
we analysed the frequency in the use of recipes that include nampla, nuoc mam, and
the analysis tool Tabemiru provided by Cookpad Inc., from 2014 to 2017. The
frequency was expressed as the cooking index (CI) in Tabemiru. As shown in Fig. 3 (a),
the frequency of the use of recipes that include nampla was ten times higher than that
for shottsuru and eighty times higher than that for nuoc mam in 2014. The frequency of
the use of recipes that include nampla increased every year after 2015, whereas that for
shottsuru decreased every year since 2014.
The monthly trends for the frequency of use of recipes that include the three
types of fish sauce were compared as shown in Fig. 3 (b). Similar to the Google search
trends, the frequency of use of recipes that include nampla demonstrated peaks in the
summer, while that include shottsuru exhibited sharp peaks in December. Since the
monthly Google search trends and the frequency of use of recipes show similar
behaviours, the correlation between these two sets of data was analysed using Pearson’s
correlation coefficient (Fig. 3 (c)). The results show high positive correlations for
nampla and shottsuru in the Google search frequency and frequency of use of recipes as
represented by the CI. For nampla, the Pearson’s correlation coefficient was 0.87.
interest and household consumption.
Next, we analysed foods that used nampla, nuoc mam, and shottsuru in the
recipes on Cookpad using Tabemiru. As shown in Table S1 (Appendix), shottsuru was
almost always used as a condiment in nabe, a Japanese stew, with konbu (kelp), and
hata-hata (Japanese sandfish). The stew, called shottsuru nabe, is a traditional dish in
Akita Prefecture (Ishige, 1986). The data also indicate that nuoc mam was used as a
dipping sauce for various foods or a condiment for fried chicken or other meat. On the
other hand, the data also indicate a drastic change in the use of nampla in households
since 2016. Fig. 4 indicates the CI of each food that used nampla. The CIs for meat,
fries, and soup showed constant values throughout 2014 to 2017, which means nampla
was used as a condiment for fried meat, fries, and soup. Further, the data demonstrated a
rapidly increasing interest in gapao and rice, referring to a new Thai dish called gapao
rice, which became trendy in Japan around 2015 to 2016. The upper panel of Fig. 6
indicates the Google Trends graph of the search frequencies for ナンプラー (nampla)
and ガパオ (gapao) from January 2004 to August 2017. This panel implies that the
popularity of these terms has been increasing since 2012. Additionally, the search
frequency for the term タイ料理 (Thai foods) increased from 2012. These results
indicate that Thai cuisine gradually became popular in Japanese society, especially with
the increasing popularity of gapao rice, which was also eaten in households in addition
to restaurants that specialise in Thai cuisine.
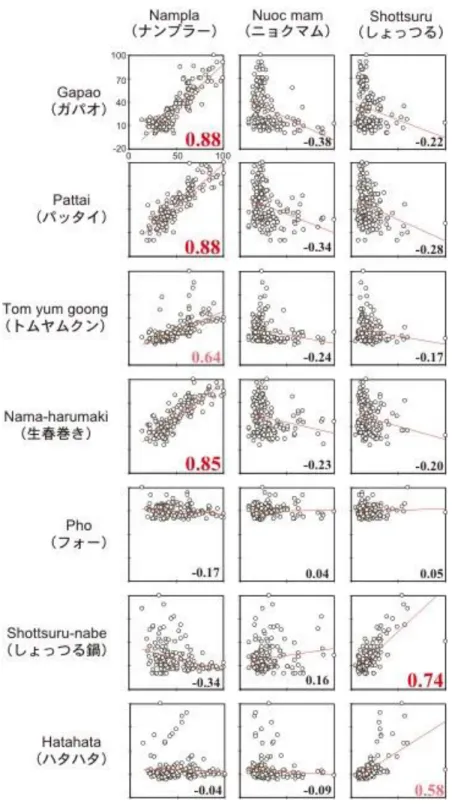
Increasing popularity of nampla as a condiment in Southeast Asian cuisine
As shown in Fig. 6, the search frequency for nampla is significantly related to those for
gapao, pattai, tom yum goong, and nama-harumaki, which suggests that the people’s
interest in nampla is related to these dishes. Indeed, some of the recipes for these dishes
on Cookpad list nampla as a condiment. Interestingly, nama-harumaki originated from
Vietnam, and it uses nampla in place of nuoc mam. The search frequency trends for
nuoc mam did not show relationships to any of the dish names analysed in this study,
including the Vietnamese dishes nama-harumaki and pho. The search trends for
shottsuru is related to shottsuru nabe and hata-hata.
A reason for the rapidly increasing popularity of Thai cuisine in Japan is the
from Thailand to Japan has been significantly increasing since 2013. On July 2013, the
Japanese government permitted people from Thailand to enter the country without a
visa. This increase in visitors from Thailand may have promoted cultural exchanges,
including with the cuisines.
2.4. Discussion
Fish sauce used to be popular among Japanese households as a substitute for soy sauce,
which is a condiment for traditional dishes or a dipping sauce (tare) for sashimi or raw
fish (Ishige 1986). However, owing to drastic changes in Japanese society, fish sauce
consumption has declined. Nevertheless, production of a wide variety of fish sauce
continued throughout Japan, as some local communities have an abundant supply of
fish and inedible fish material at low market value that can be used to make the product.
However, for the industry to succeed, strategies for sales and product development are
necessary. In this study, we performed data mining of internet activities (searches)
related to fish sauce consumption among the Japanese.
Japan, represented by shottsuru, has a very limited purpose as a condiment for
traditional nabe (Ishige, 1986; Nakano et al., in submission). This finding means that
currently, there is an excess supply of fish sauce relative to consumer demand. On the
other hand, Thai fish sauce, nampla, has become widely popular in Japan owing to the
rapidly increasing popularity of Thai cuisine in recent years, as represented by gapao
rice. The data mined from Cookpad indicate that Thai cuisine has now spread to
households, not only to restaurants that serve such cuisine. These findings may have
significant implications for the Japanese fish sauce industry. The increasing popularity
of gapao rice in Japanese society has led to the increasing consumption of nampla. On
the other hand, no dish has led to an increased consumption of Japanese fish sauce, and
therefore, the development of dishes that use this fish sauce is necessary. Additionally,
to sell unfamiliar food to people, suppliers must explain the food’s benefits to them or
their households. For instance, fish sauce can be very nutritious owing to its essential
amino acid content (Gildberg, 2004). Additionally, fish sauce promotes various
biological activities, including the angiotensin I-converting enzyme inhibitory activity
useful information to consumers would be a part of a good sales strategy for Japanese
fish sauce.
Fig. 1. (a) Interest in nampla, nuoc mam, and shottsuru and (b) in buying those fish
sauce types. This information is represented by the Google search volumes on the query
from 2004 to 2017.
the Google search volume index.
Fig. 3. (a) Annual and (b) monthly trends in use of Cookpad recipes including each fish
sauce type. This information is represented by the cook index (CI). The scatter plots and
regression statistics indicate a strong positive linear relationship between the Google
Fig. 4. Annual data on foods that use nampla from a combination search on Tabemiru
on Cookpad. The bottom panel indicates top 3 retrieved terms for dishes that use
Fig. 5. Interest in (a) nampla and gapao and (b) Thai food. This information is
represented by the Google search volumes on the query terms ナンプラー (nampla),
Fig. 6. Monthly Google search volume scatter plots per fish sauce type (x axis) and dish
(y axis). The correlations were assessed with regression lines and Pearson’s correlation
Fig. 7. Monthly data on visitors from Thailand and Vietnam to Japan. The line graph
was prepared based on data from the Japan National Tourism Organization
(https://www.jnto.go.jp). 2004 20 40 60 80 100 120 140 160 0 2005 2006 2007 2008 2009 2010 2011 2012 2013 2014 2015 2016 2017 Thailand Vietnam N u m b e r o f vi si to rs t o J a p an ( × 1 ,0 00 ) Month (Year)
3. Electronic nose and chemical analyses of commercial fish sauce products show
country-specific preferences
3.1. Introduction
Fish sauce, a clear fermented brownish liquid condiment, is popular in Southeast Asia.
In general, fish sauce is predominantly salty with umami taste, and has distinctive
flavors (Wichaphon et al., 2013). Traditional fish sauce is usually obtained by mixing
fish materials with salt, which are subsequently fermented in a natural environment
(Lopetcharat et al., 2001). During an extended fermentation, the protein of the raw
material is hydrolyzed into peptides and amino acids by endogenous fish proteases and
the enzyme produced by microorganism in the fish sauce materials (Taira et al., 2007;
Yongsawatdigul et al., 2007). The amino acids derived from the raw material provide
the umami taste of fish sauce, with the microorganisms in the fermentation process, also
contributing to its aroma and flavor (Zheng et al., 2017; Udomsil et al., 2017).
Fish sauce used to be produced in some seaside areas in Japan, such as in the
Akita and Ishikawa prefectures as Shottsuru and Ishiru, respectively, but their
available soy sauces, in a drastic change of Japanese society after the Meiji era (Ishige,
1986). Additionally, owing to its characteristic odor and flavor, fish sauce may be
unacceptable for Japanese consumption in the household (Utagawa, 2012). Recently,
however, fish sauce is becoming popular among consumers in Europe, North America,
and other continents, as well as in Japan, due to the widely accepted ethnic cuisine
(Zhao et al., 2017). Fish sauce production is also attracting attention as an effective
utilization of unused valuable fishery resources (Utagawa, 2012).
The unique flavor of fish sauce is composed of three predominant distinctive
notes, ammoniacal, cheesy, and meaty. It has been shown that the aroma of fish sauce
comprises several volatile compounds that are associated to the distinctive flavor of the
products (Shimoda et al., 1996). The ammoniacal note of fish sauce is attributed to
ammonia and several amines. Low-molecular-weight volatile fatty acids are associated
with the cheesy note, and volatile nitrogen-containing and aldehyde compounds are
responsible for the meaty note. Food preference and acceptance are influenced by
biological, physiological, psychological, and sociocultural factors (Mela, 2006; Köster,
country tend to have similar eating patterns, it is presumed that they share similar food
preferences and acceptance. For example, sensory evaluations in Japanese and Filipino
populations indicate that Japanese subjects favored fish sauces with low concentrations
of volatile acids, whereas Filipino subjects preferred sauce with high concentrations of
volatile acids (Sanceda et al., 2003). Further, individual diversity exists in flavor
responses to foods owing to different lifetime flavor experiences (Mennella and Trabulsi,
2012). However, flavor preferences have been rarely determined in market research for
identification of consumer clusters (Törnwall et al., 2014).
The electronic nose (e-nose) technique is designed to crudely mimic the
mammalian nose, in which electronic sensors non-selectively interact with volatile odor
molecules (Baldwin et al., 2011). This technique allows the classification of food and
agricultural products based on differences in the contents of volatile aroma compounds.
In the current study, we determined the flavor and chemical properties of fish sauces
produced in Japan, Thailand, Vietnam, China, the Philippines and Italy using e-nose
3.2. Materials and methods
Commercial fish sauce products
Forty-six fish sauces were purchased for this study (Appendix, Table S2). Thirty sauces
were produced in Japan (labeled J1 to J30), 11 in Thailand (T1 to T11), and two in
Vietnam (V1 and V2). The remaining three were produced in the Philippines (P1),
China (C1), and Italy (T1). Japanese soy sauce was used as internal standard. Products
were categorized into five groups: A, Japanese products made only from fish and salt; B,
non-Japanese products made only from fish and salt; C, non-Japanese products made
from fish, salt, and sugars; D, Japanese products made from fish, salt, and rice molt
(koji); and E, Japanese products seasoned with additional condiments.
Determination of dried solid contents
Total dried solid measurements were performed by evaporating approximately 2 g of
fish sauce at 130 °C for 20 minute with a moisture analyzer (MX-50, A&D, Japan).
Determination of salinity and pH
Salinity and pH were determined using a salt meter (B-721, HORIBA, Japan) or a pH
Determination of total acidity and amino nitrogen
Total acidity and amino nitrogen content were measured by titration methods. For total
acidity determination, 0.1 mol/L NaOH was used for the titration of organic acids,
whereas amino nitrogen content was assayed using the formol titration method
(Northrop, 1926). The peptide nitrogen (%) was stated as total nitrogen (%) – amino
nitrogen (%).
Determination of total nitrogen
Total nitrogen was measured according to an improved Dumas method (Nozawa et al.,
2007) with a combustion total nitrogen analyzer (Sumigraph NC-220F, Sumika
Chemical Analysis Services, Japan).
Determination of amino/total nitrogen ratio
Amino/total nitrogen ratio was calculated using the amino nitrogen and total nitrogen
content scores as follows.
𝐴𝑚𝑖𝑛𝑜/𝑡𝑜𝑡𝑎𝑙 𝑛𝑖𝑡𝑟𝑜𝑔𝑒𝑛 𝑟𝑎𝑡𝑖𝑜 (%) = 𝐴𝑚𝑖𝑛𝑜 𝑛𝑖𝑡𝑟𝑜𝑔𝑒𝑛 (%)
𝑇𝑜𝑡𝑎𝑙 𝑛𝑖𝑡𝑟𝑜𝑔𝑒𝑛 (%) × 100
E-nose analysis
M.O.S., French). The E-nose consists of a headspace autosampler HS100 with
numerous options, 18 metal oxide sensors each of which has different selectivity
patterns, a signal collecting unit and pattern recognition software applied via a computer.
Sensors in the e-nose system do not give information on sample composition, but rather
give a digital fingerprint through pattern recognition (Baldwin et al., 2011).
Aliquots of fish sauce (0.5 g) were added to 10 mL vails and placed on an auto-sampler.
Analyzing conditions were syringe at 50 °C, oven at 40 °C, and injection speed at 2
mL/sec.
Statistical analysis
Statistical analysis was performed using a spreadsheet software (Microsoft Excel,
Japan) with the Tukey-Kramer method. Principal component analysis (PCA) was
performed using a software AlphaSoft (Alpha M.O.S.) that attached to the e-nose
system.
3.3. Results
To compare the respective chemical characteristics of fish sauce from different sources
and with different ingredients, 46 products were assayed for dried solid content, salinity,
pH, total nitrogen, amino nitrogen, peptide nitrogen, and total acidity.
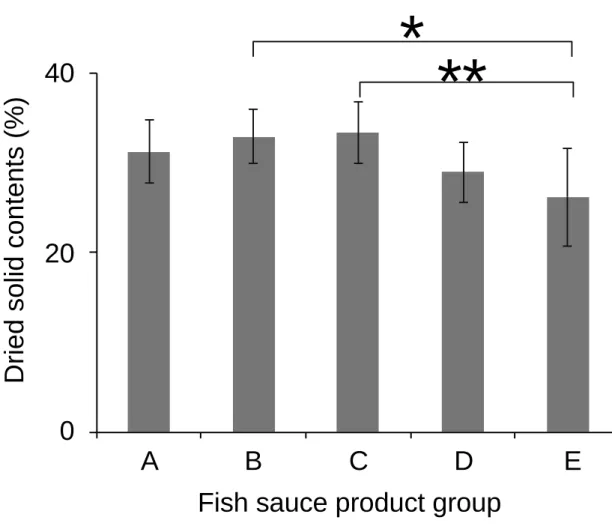
1) Dried solid contents
Figure 1 shows the dried solid contents of fish sauce products. The highest value was
37.90 % for T2 (group C), whereas the lowest value was 16.12 % for J9 (group E). Fish
sauce products in group E have relatively low dried solid values, probably owing to
dilution resulting from the addition of condiments.
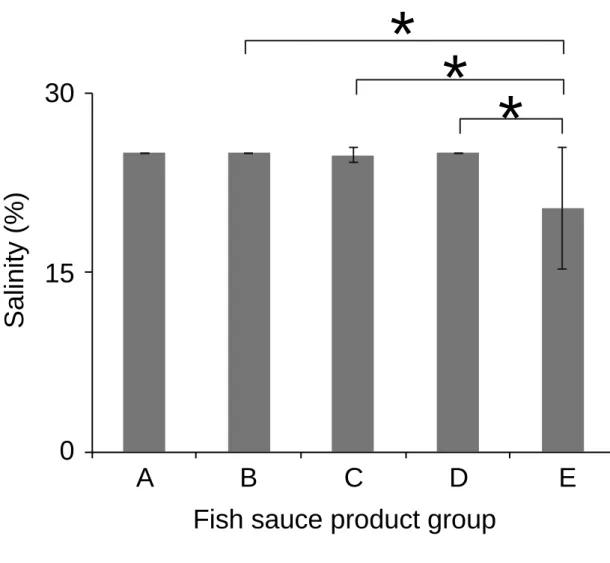
2) Salinity
Figure 2 shows the salinity of different fish sauce products. The degree of salinity
varied from 11 to 25 %. The degree of salinity of group E products, corresponding to
Japanese seasoned fish sauce products after the fermentation process, was significantly
lower than that of other products.
3) pH
The pH of the fish sauce products ranged from 4.5 to 6.0 (Fig. 3). Significant
fish sauce products.
4) Nitrogen
Total nitrogen content corresponds predominantly to protein, peptides, and amino acids
in raw fish (Fig. 4). Total nitrogen values varied, with the highest and lowest values
being 2.95 % for V2 (group B) and 0.28 % for J8 (group E), respectively. Japanese
seasoned fish sauce exhibited significantly lower values compared to other products.
This difference probably results from dilution of the fish sauce components with the
addition of condiments for seasoning.
Amino nitrogen content corresponds to amino acids in raw fish (Fig. 5).
Similar to total nitrogen content, fish sauce in group E showed significantly lower
amino nitrogen content than other products. Although the difference was not significant,
the values for group C were also lower than those of other products. This difference
probably results from reduction of the enzymatic activity due to decreasing of water
activity with addition of sugars, in addition to the dilution of the raw fish protein with
the addition of condiments or sugars.
Group E products showed significantly lower values than other products, which
probably results from dilution of peptides in the products with additives. On the other
hand, products in group A also showed lower values than other products, although the
difference was not significant. This may be reflected in the ratio of amino/total nitrogen
that represents the conversion rate from peptides to amino acids (Fig. 7).
5) Acidity
Figure 8 shows the acidity values for the fish sauce products. Among the five groups,
group D products had higher acidity value than other products probably due to the acids
from additional condiments.
E-nose analysis of fish sauce products
To characterize the flavor of fish sauce products, e-nose analyses were performed. For
variable reduction and separation into classes, principal component analysis (PCA) was
employed (Fig. 9), and the fish sauce products were classified into seven classes. The
three upper-right classes in the PCA plot predominantly correspond to groups A to C,
which contain sauce produced in a traditional manner. Most sauces from group D were
products from group D form two groups at the left side of the PCA plot. Only one of
Thailand products (T11) belongs to this group.
3.4. Discussion
Fish sauce, a condiment with a characteristic taste and flavor, is predominantly
produced in Southeast Asia, including Japan and China, and Italy. In this study, we
characterized the chemical and flavor properties of 46 commercially available fish sauce
products. Based on source and ingredients, the products were categorized into five
groups. Japanese products were divided into three groups: fish sauce made only from
fish and salt (group A), made with rice malt koji as additional fermentation starter
(group D), and seasoned with additional condiments such as soy sauce and rice wine
(group E). Thailand products were divided into two groups: fermented with (group C)
or without sugars (group B). Chinese product was categorized into group C. Fish sauce
products from other countries were categorized into group B.
Based on chemical characterization, the fish sauce products in group E were
clearly distinct from other groups, and were characterized as having low nitrogen and
ingredients by the addition of condiments. Additionally, the low salinity in group E
products may result from efforts of the Japanese Government to improve public health.
Before the salt reduction campaign that the Japanese Government initiated in the 1960s,
most Japanese consumed a much higher level of sodium than recommended by the
WHO (Asakura et al., 2016). After the campaign, the mean salt intake decreased from
14.5 g/day in 1972 to 10.6 g/day in 2010 (Hyseni et al., 2017). The low salinity in
Japanese seasoned fish sauce may therefore represent the preferences of Japanese
consumers to low-salt foods resulting from such campaigns.
Although the difference is not significant, traditional fish sauce products from
Japan (group A) showed a higher amino/total nitrogen rate than non-Japanese traditional
products (group B). This difference might be associated to differences in fermentation
processes between Japanese and non-Japanese products. For example, the fermentation
period ranges from 6 to 12 months for non-Japanese products and from 1 to 3 years for
Japanese products (Utagawa, 2012). Therefore, in group A fish sauce, a larger amount
of peptides may be degraded into amino acids during fermentation.
distinctive flavor compared to group A and B products, which are produced by a
traditional procedure. This is not surprising, because products in this group contain
additional condiments. However, the PCA plot (Fig. 9) shows that the fish sauce flavor
in group E was similar to that of Japanese soy sauce used as control. These results
indicate that Japanese consumers tend to choose fish sauce with soy sauce-like flavor
rather than that with traditional flavor. One of Thailand fish sauce products, T11, was
classified into same flavor group to group E. This product is also seasoned with
additional condiments probably so that the taste and flavor of the product meet Japanese
consumer needs. This tendency is also supported by the presence of group D products in
which koji is employed as a fermentation starter. The fish sauce in group D showed a
higher acidity than other products, as shown by chemical characterization. The koji is
known to produce the flavor of soy sauce by catalyzing the transformation of glutamine
into glutamate (Zhao et al., 2017; Liang et al., 2009). Anchovies (J29, I1, T2, T3, T5,
and C1) and sardines (T7, V2, T4, T9, and T10) are employed in several fish sauce
products from different counties. All products using these fish are included in
although there are slight differences in the odor of the products, same fish materials
produce similar odor of the fish sauce products.
As results in this study, we characterized the fish sauce products from several countries,
based on the chemical and e-nose analyses. The characters determined would reflect the
food preference and acceptance selected by consumers in each country. However, the
current study does not include the data such as sales of the products in the real market
and sensory test using human panelists. More precise investigations including such data
would be worthwhile to reveal the country-specific preferences and acceptance for the
fish sauce products.
The current study revealed slight producing country-specific preferences and
acceptance of fish sauce products owing to the different flavors. Recently, for a more
effective utilization of unused valuable resources in fisheries, some companies are
producing fish sauce using fish and shellfish dregs such as internal organs, bone, head,
and skin. However, preferences for flavors of fermented fish and shellfish may be
sharply divided, including the food neophobia. To create a new market for novel fish
and individual are necessary.
Fig. 1 Dried solid content of commercial fish sauce products. Data represents the mean
of all products in each group, and the error bars indicate the standard deviation. *,
p<0.05; **, p < 0.01.
0
D
ri
e
d
s
o
lid
c
o
n
te
n
ts
(
%
)
A
B
C
D
E
*
**
20
40
Fig. 2. Salinity in commercial fish sauce products. Data represents the mean of all
products in each group, and the error bars indicate the standard deviation. *, p<0.05; **,
p < 0.01.
A
B
C
D
E
Fish sauce product group
0
S
a
lin
it
y
(
%
)
15
30
*
*
*
Fig. 3. pH of commercial fish sauce products. Data represents the mean of all products
in each group, and the error bars indicate the standard deviation. **, p < 0.01.
**
A
B
C
D
E
Fish sauce product group
0
p
H
3
Fig. 4. Total nitrogen content of commercial fish sauce products. Data represents the
mean of all products in each group, and the error bars indicate the standard deviation. *,
p<0.05; **, p < 0.01.
A
B
C
D
E
Fish sauce product group
*
**
**
**
0
T
o
ta
l
n
it
ro
g
e
n
(
%
)
1.5
3.0
Fig. 5. Amino nitrogen content of commercial fish sauce products. Data represents the
mean of all products in each group, and the error bars indicate the standard deviation. *,
p<0.05; **, p < 0.01.
*
**
**
**
A
B
C
D
E
Fish sauce product group
0
A
m
in
o
n
it
ro
g
e
n
(
%
)
0.6
1.2
1.8
Fig. 6. Peptide nitrogen content of commercial fish sauce products. Data represents the
mean of all products in each group, and the error bars indicate the standard deviation. *,
p<0.05; **, p < 0.01.
A
B
C
D
E
Fish sauce product group
0
P
e
p
ti
d
e
n
it
ro
g
e
n
(
%
)
0.8
1.6
*
*
**
Fig. 7. Amino/total nitrogen ratio of commercial fish sauce products. Data represents
the mean of all products in each group, and the error bars indicate the standard deviation.
*, p<0.05; **, p < 0.01.
0
A
m
in
o
/t
o
ta
l
n
it
ro
g
e
n
r
a
ti
o
(
%
)
0.6
1.2
1.8
A
B
C
D
E
Fish sauce product group
*
**
**
**
Fig. 8. Acidity of commercial fish sauce products. Data represents the mean of all
products in each group, and the error bars indicate the standard deviation. *, p<0.05; **,
p < 0.01.
*
*
A
B
C
D
E
Fish sauce product group
0
A
c
id
it
y
(
m
L
/1
0
0
m
L
)
10
5
15
20
25
Fig. 9. Principal component analysis score plot of e-nose analysis results. Data were
classified into seven groups. Numbers of the samples classified into same group
indicated by red circle are indicated as “n=x”. PC1 and PC2 are corresponding to
distinct sensors, which are the most and secondary most contributed to discriminate the
fish sauce products. The ratio of the fish sauce products group in each flavor classes are
indicated by the pie graphs. Uppercase letters correspond to product groups as shown in
Table 1. n=2 D n=2 D n=7 D E n=6 A C n=11 A B C n=4 A E C n=15 D E C Discrimination index = -11
4. Clustering of commercial fish sauce products based on an e-panel technique and
chemical analysis
4.1. Introduction
The human olfactory system is by far the more complex and contains thousands of
receptors that bind odor molecules and can detect some odors at parts per trillion levels
and include between 10 and 100 million receptors. Apparently, some of the receptors in
the olfactory mucus can bind more than one odor molecule and in some cases one odor
molecule can bind more than one receptor. This results in a mind-boggling amount of
combinations that send unique signal patterns to the human brain. The brain then
interprets these signals and makes a judgment and/or classification to identify the
substance consumed, based in part, on previous experiences or neural network pattern
recognition (Baldwin et al., 2011).
Electronic noses (e-noses) and electronic tongue (e-tongues) crudely mimic
the human smell and taste sensors and their communication with the human brain. The
broad and partially overlapping selectivity towards compounds present in a sample. The
array of sensors is combined with computerized multivariate statistical data processing
tools. A number of works have been published that have used electronic noses for the
characterization and for the quality control of olive oils (Apetrei et al., 2010). In the
case of e-tongues, their capability to analyze and discriminate a variety of beverages
such as mineral waters, milks, wines or beers has already been established (Apetrei et
al., 2010). In addition, an e-eye was used to distinguish color components using
camera-equipped apparatus and computer-assisted analysis.
Fish sauce is produced from seafood of various types. Anchovy and sardine
appear to be widely used in fish sauce production in Thailand and featured in fish sauce
products from Vietnam, China, and Italy. A fish sauce product from the Philippines
contained mackerel. Flying fish, which is often used as dashi, a broth employed in
various dishes in Japan (especially in the Kyushu area), was found in several Japanese
fish sauce products. Bonito is also employed for dashi preparation throughout Japan,
and was also present in many of the fish sauce products tested from this country. In
oyster, shrimp, and squid were found to be used in the manufacture of fish sauce
products in Japan. As well as the fish materials, the climates and production procedures
effect on the taste, smell and colors. The factors would be also reflected by the cultures,
history and society of the country. In this study, the author analyzed "smell" "taste" and
"color" of 46 types of commercial fish sauce manufactured in Asian countries by
electronic panel (e-panel) analyses containing e-tongue, e-nose and electronic eye
(e-eye) sensory assessments. Along with the e-panel analysis, the chemical properties of
these fish sauces were also analyzed to characterize the fish sauce in each country.
4.2. Materials and Methods
Materials
All of the 46 fish sauce products were purchased at local markets in Tokyo, Fukuoka,
and Abashiri (Japan). The ingredients of each product as listed on their labels are
summarized in Table 1. For analysis, the products were assigned product IDs as follows:
J1–J30 for the Japanese products; T1–T11 for the Thai products; V1 and V2 for the
respectively.
Evaluation of smell with e-nose analysis
E-nose analysis was performed with the αFOX 4000 smell analysis system (Alpha
M.O.S., Toulouse, France), which has 18 metal oxide gas sensors for different
selectivity patterns. Fish sauce product samples (0.5 g) were collected in 10-ml vials,
placed in an autosampler, and analyzed under the following conditions: syringe
temperature, 50°C; oven temperature, 40°C; injection speed, 2 ml/s.
Evaluation of taste with e-tongue analysis
E-tongue analysis was performed with the αASTREE taste analysis system (Alpha
M.O.S.), which has seven liquid potentiometric sensors (SRS, GPS, STS, UMS, SPS,
SWS, and BRS) and a reference electrode (Ag/AgCl). Fish sauce products diluted
21-fold were collected in a beaker and placed in an autosampler. Each sensor was
immersed in the samples for 120 s at 20 -25 ˚C with agitation to elicit a sensor response.
Evaluation of color with e-eye analysis
E-eye analysis of fish sauce products was carried out using an IRIS VA300 visual
analyzer (Alpha M.O.S.) with a charge-coupled device camera. Five milliliters of fish
sauce product was collected in a transparent plastic dish and placed in the measurement
chamber. The color of the surface of each sample was measured three times. The
collected color data were represented by IRIS color codes, which encompass 4096
colors.
Statistical analysis
The datasets, comprising a series of sensor values from the e-nose, e-tongue, and e-eye
tests, were subjected to cluster analysis by Ward’s method using the program R-3.4.2
(http://www.R-project.org) (Ihaka and Gentleman, 1996).
Solid contents assay
sample was applied to a moisture analyzer (MX-50; A&D, Japan). The measurements
were conducted at 130 °C for 20 min, as described in reference of (Harnández-Herrero
and Frutos, 2014).
Salinity and pH measurements
The salinity and pH of the fish sauce products were determined using a salt meter
(B-721; HORIBA, Japan) and a pH meter (D-52; HORIBA), respectively.
Total acidity assay
Total acidity was determined by a titration assay. Briefly, 10 g of fish sauce samples
were diluted up to 100 mL with distilled water. Acid content in 10 mL of the diluted
sample was determined by titration with 0.1 M NaOH, with 1% (w/v) phenolphthalein
solution as a pH indicator.
Amino acid content determination
(Sumika Chemical Analysis Service, Japan) (Nozawa et al., 2007). Amino nitrogen
content was determined using the formol titration method (Northrop, 1926). Briefly, 5
mL of the fish sauce sample was diluted up to 250 mL with distilled water. For the first
titration, all of the diluted sample was titrated to pH 8.5 with 0.01 M NaOH. For the
second titration, 20 mL of formaldehyde solution (pH 8.5) was added to the diluted
sample, and then titrated to pH 8.5 with 0.1 M NaOH. The volume of base consumed in
the first and second titration was used for calculating the amino nitrogen content
(Northrop, 1926). The amino nitrogen to total nitrogen ratio, i.e., a value of amino
nitrogen divided by total nitrogen, was used as an index of protein-to-amino acid
conversion rate.
4.3. Results and discussion
Characterization of taste of Asian fish sauces by e-tongue
Forty-six types of fish sauces from various Asian countries were applied to e-tongue
analysis using αASTREE taste analysis system. Signal intensities from seven sensors
taste respectively, showed similar intensities to all fish sauces excepting for four
products from China, Italy, Philippines and Vietnam. it was shown that Japanese fish
sauce tended to have strong sour (AHS) and metallic (PKS) taste and weak umami
(NMS) and sweetness (ANS) compared with fish sauce of other countries. Meanwhile,
it was revealed that even Japanese fish sauces manufactured by traditional
manufacturing methods showed similar tendencies to those produced by overseas fish
sauces. All of sensor data were brought to cluster analysis as shown in Fig. 2. The
clustering indicates the clear difference in the taste of Japanese and non-Japanese fish
sauces. Comparing to soy sauce, most of the fish sauces exhibited the stronger
bitterness. This may be a factor that makes fish sauce difficult to use.
Characterization of smell of Asian fish sauces by e-nose
The Asian fish sauces were applied to e-nose analysis using αFOX 4000 smell analysis
system (Fig. 3). Of 18 sensors, thirteen sensors showed the stronger signal intensities
against Japanese fish sauces, otherwise five sensors exhibited the stronger intensities
shown in Fig. 4. The cluster clearly distinguishes the Japanese and non-Japanese
products, although the Japanese ones with traditional manufacturing method belonged
to same cluster with non-Japanese products. Broadly, the cluster indicates that the
Japanese fish sauce have similar smelling characters with soy sauce. Therefore,
Japanese fish sauce products tended to have suppressed smell unique to fish sauce, since
many of them show smelling characteristics close to soy sauce.
Characterization of colors of Asian fish sauces by e-eye
The Asian fish sauces were applied to e-nose analysis using IRIS VA300 visual analyzer.
The colors of the fish sauces were characterized as yellowish to brownish colors as
shown in Fig. 5. All of Thai fish sauces showed yellowish colors, otherwise fish sauces
from other countries including Japan showed wide variety of colors, yellowish to
brownish. All of sensor data were brought to cluster analysis as shown in Fig. 6. The
cluster indicates that color of the product was not influenced by the country, but it was
Characterization of chemical properties of Asian fish sauces
To characterize the chemical properties of commercial fish sauce products associated
with the fish sauce taste and flavor. All products were analyzed in triplicate. Dried solid
content was analyzed by moisture analyzer. Fish sauce salinity was determined by a salt
meter. pH was measured using a pH meter. The acidity was determined using a titration
assay. Amino nitrogen and total nitrogen were evaluated using a titration assay and
Combustion-type nitrogen analyzer, respectively. As a result (Fig, 7), the fish sauce
from Thailand tended to have a higher solid component content, indicating the
possibility that a relatively large amount of taste components is contained in the
products. On the other hand, there are many low-salt-concentration products in Japanese
fish sauces, and it would be related to the tendency to prefer the products with reduced
salt. In Vietnamese fish sauce, the total protein amount tended to be large, which would
Fig. 2. Clustering of fish sauce products based on the e-tongue analysis V 2 P 1 C 1 I1 J 2 1 J 2 6 J 2 4 J 2 5 J 2 2 J 2 3 T 4 T 1 T 2 T 3 T 6 T5 T7 T8 T 1 0 T 9 T 1 1 V 1 J7 J 1 1 J9 J8 J 1 0 J 1 2 J 1 9 J 1 4 J 1 6 J 1 3 J 1 7 J20 J6 J4 J5 51J J18 J1 J2 J3 J 2 8 J 2 9 J 2 7 C O N J 3 0 0 5 0 0 0 1 0 0 0 0 1 5 0 0 0 2 0 0 0 0 2 5 0 0 0 H e ig h t
Japanese products (Seasoned)
Thai products
Japanese products (Traditional)
Others
E-Toungue
Fig. 3. Results of e-nose analysis T7 T4 T5 T6 T10 T9 J18 V1 I1 T1 C1 J29 J19 P1 J15 V2 T8 J22 J17 J24 J21 T2 T3 J7 J27 J6 J20 J13 J26 J11 J2 J9 J28 J3 J30 J14 J5 J4 cont. J8 J25 J1 J10 T11 J23 J12 J16 0.2 0.4 0.6 0.8 TA.2 re o rd e r( ID , T A .2 ) T4 T7 T6 T10 T5 P1 T9 I1 J19 T1 V1 C1 V2 J29 J18 J15 T8 T2 T3 J22 J17 J24 J21 J20 J7 J27 J6 J26 J13 J11 J2 J9 J28 J3 J30 J5 J4 cont. J1 T11 J14 J25 J23 J8 J10 J16 J12 0.250.500.751.00 T70.2 re o rd e r( ID , T 7 0 .2 ) T7 T10 T4 T6 T5 T9 P1 I1 J19 J18 T1 V1 C1 V2 J29 J15 T8 J17 J22 T2 T3 J24 J21 J6 J7 J2 J20 J27 J13 J11 J3 J26 J9 J5 J4 J28 J1 J30 J14 cont. J10 J8 J25 T11 J23 J16 J12 0.2 0.4 0.6 0.8 T40.2 re o rd e r( ID , T 4 0 .2 ) T7 T4 T5 T6 T10 T9 J18 V1 C1 T1 J29 I1 J15 J19 P1 V2 T8 J22 J17 J24 J21 J7 J27 T2 T3 J6 J13 J26 J20 J11 J9 J2 J28 J3 J14 J30 J5 J4 cont. J8 J25 J10 J1 T11 J23 J12 J16 0.2 0.4 0.6 T40.1 re o rd e r( ID , T 4 0 .1 ) T7 T6 T4 T5 T10 T9 P1 I1 J19 T1 V1 C1 V2 J29 J18 J15 T8 T2 T3 J22 J17 J24 J20 J21 J7 J6 J27 J2 J13 J26 J11 J9 J28 J3 J5 J4 J30 J1 cont. J14 J25 T11 J23 J10 J8 J12 J16 0.250.500.751.00 T30.1 re o rd e r( ID , T 3 0 .1 ) T7 T6 T4 T5 T10 T9 P1 I1 J19 T1 V1 C1 V2 J29 J18 J15 T8 T2 T3 J22 J17 J20 J24 J21 J7 J27 J6 J26 J13 J2 J11 J28 J9 J3 J30 cont. J5 J1 J4 T11 J14 J25 J8 J10 J23 J12 J16 0.250.500.751.00 PA.2 re o rd e r( ID , P A .2 ) T7 T6 T4 T5 T10 T9 I1 J18 P1 V1 T1 J19 C1 J29 V2 J15 T8 J22 J17 T2 T3 J24 J21 J20 J7 J27 J6 J13 J26 J2 J11 J9 J28 J3 J5 J4 J30 J14 J1 cont. J25 J8 J10 T11 J23 J12 J16 0.25 0.50 0.75 P40.1 re o rd e r( ID , P 4 0 .1 ) T7 T6 T4 T5 T10 T9 P1 I1 J19 T1 V1 C1 V2 J18 J29 J15 T8 T2 J22 J17 T3 J24 J21 J7 J27 J20 J6 J13 J11 J26 J2 J9 J28 J3 J30 J5 J4 J14 J10 J8 cont. J23 J1 J25 T11 J16 J12 0.2 0.4 0.6 0.8 P40.2 re o rd e r( ID , P 4 0 .2 ) T7 T6 T4 T5 T10 J19 P1 I1 T9 T1 V1 C1 J29 V2 T8 J15 J18 T2 T3 J22 J17 J21 J24 J20 J7 J27 J13 J6 J11 J26 J9 J2 J28 J30 J3 cont. J14 J5 J10 J8 J4 J25 T11 J16 J23 J12 J1 0.250.500.751.00 P30.2 re o rd e r( ID , P 3 0 .2 ) Country China Italy Japan Philippine Soy souce Thailand Vietnam T7 T6 T4 T5 T10 J19 T9 P1 I1 T1 V1 C1 J29 V2 J15 J18 T8 T2 T3 J17 J22 J24 J20 J21 J7 J27 J13 J6 J11 J26 J9 J2 J28 J30 J14 J3 J5 J25 J10 J4 T11 J16 J12 J8 cont. J23 J1 0.250.500.751.00 P30.1 re o rd e r( ID , P 3 0 .1 ) T7 T6 T4 T10 T5 T9 J18 I1 P1 V1 T1 J19 C1 J29 V2 J15 T8 J22 J17 T2 T3 J24 J21 J6 J7 J27 J20 J2 J13 J26 J11 J9 J3 J28 J5 J4 J1 J30 J14 cont. J8 J10 J25 J23 J16 T11 J12 0.2 0.4 0.6 0.8 P10.2 re o rd e r( ID , P 1 0 .2 ) T7 T6 T4 T5 T10 T9 P1 I1 J19 T1 V1 J18 C1 V2 J29 J15 T8 J22 T2 T3 J17 J20 J24 J21 J7 J6 J27 J2 J13 J26 J11 J9 J28 J3 J5 J4 J1 J30 J14 cont. J25 J8 T11 J10 J23 J16 J12 0.250.500.751.00 P10.1 re o rd e r( ID , P 1 0 .1 ) T7 T6 T4 T5 P1 T10 J19 T9 T1 V1 J29 V2 C1 I1 J18 J15 T8 J17 T2 T3 J22 J24 J21 J20 J7 J27 J6 J13 J11 J26 J9 J2 J28 J3 J14 J5 J30 J4 J25 J10 T11 cont. J16 J8 J12 J23 J1 0.000.250.500.75 LY2.LG re o rd e r( ID , L Y 2 .L G ) J12 T11 J16 J1 J25 J23 J4 J14 cont. J10 J5 J8 J30 J3 J20 J2 J28 J9 J26 J11 J13 J6 J27 J7 J24 J21 J17 J22 T3 T2 J18 T8 J15 J29 V2 C1 V1 T1 J19 T9 I1 P1 T10 T5 T4 T6 T7 -3 -2 -1 0 LY2.GH re o rd e r( ID , L Y 2 .G H ) J12 J16 T11 J25 J1 J23 J14 J4 cont. J10 J5 J8 J30 J3 J20 J2 J28 J9 J26 J11 J13 J6 J27 J7 J24 J21 J17 J22 T3 T2 J18 T8 J15 J29 V2 V1 C1 T1 J19 T9 I1 P1 T10 T5 T4 T6 T7 -3-2-10 LY2.gCTL re o rd e r( ID , L Y 2 .g C T L ) J12 T11 J16 J1 J25 J4 J23 J14 cont. J5 J10 J8 J30 J3 J2 J20 J28 J9 J26 J11 J13 J6 J27 J7 J24 J21 J17 J22 T3 T2 J18 T8 J15 J29 V2 C1 T1 V1 J19 T9 I1 P1 T10 T5 T4 T6 T7 -3 -2 -1 0 LY2.gCT re o rd e r( ID , L Y 2 .g C T ) J12 J16 J25 T11 J1 J23 J14 J4 cont. J5 J10 J8 J30 J3 J20 J2 J28 J9 J26 J11 J13 J6 J27 J7 J24 J21 J17 J22 T3 T2 J18 T8 J15 J29 V2 V1 C1 T1 J19 T9 I1 P1 T10 T5 T4 T6 T7 -4 -3 -2 -1 0 LY2.G re o rd e r( ID , L Y 2 .G ) J12 J16 T11 J1 J25 J23 J14 J4 cont. J10 J5 J8 J30 J3 J20 J2 J28 J9 J26 J11 J13 J6 J27 J7 J24 J21 J17 J22 T3 T2 J18 T8 J15 J29 V2 C1 V1 T1 J19 T9 I1 P1 T10 T5 T4 T6 T7 -4 -3 -2 -1 0 LY2.AA re o rd e r( ID , L Y 2 .A A ) Country China Italy Japan Philippine Soy souce Thailand Vietnam
Fig. 4. Clustering of fish sauce products based on the e-nose analysis J 2 1 J 2 4 T 2 T 3 J 1 7 J 2 2 T 7 T 4 T 6 T 9 T 1 0 T 5 J 1 8 J 1 5 T 8 I1 J 1 9 P 1 J 2 9 T 1 V 1 C 1 V 2 J 2 7 J7 J 2 6 J9 J6 J 1 1 J 1 3 J 2 0 J 2 J 2 8 T 1 1 J1 J 2 5 J 1 2 J 1 6 J 1 4 J 2 3 C O N J4 J3 J 3 0 J8 J 1 0 J5 0 2 0 4 0 6 0 8 0 1 0 0 H e ig h t Japanese products (Seasoned) Japanese products (Seasoned, Similar to Soysause) Non-Japanese products
Japanese products (Traditional)
Fig. 6. Clustering of fish sauce products based on the e-eye analysis J 8 T 1 0 T 9 T 5 T 7 J 2 J 2 9 C 1 J 1 5 T 8 P 1 T 2 T 3 T 4 J 2 6 J6 J 1 1 J 1 3 J 1 7 V 2 J 5 T 1 J 2 5 T 6 J 1 4 J 3 0 I1 J7 J 1 J 1 6 J 2 8 J9 J 2 1 J 2 2 T 1 1 J 2 4 J 2 0 J4 J 2 3 J 1 8 J 1 9 V 1 J 1 0 J3 J 1 2 C O N J 2 7 0 1 0 0 2 0 0 3 0 0 4 0 0 H e ig h t
Japanese products dominant
Non-Japanese products dominant
E-Eye
Fig. 7. Results of chemical property analysis J9 J8 J7 J5 J4 J6 J25 J18 J16 J21 J13 J23 J14 J1 J11 C1 T11 J2 P1 J20 J30 I1 V1 J24 J26 J22 J15 J12 J27 J28 J3 T9 J19 T6 J29 T4 T3 T10 J10 V2 J17 T7 T1 T8 T5 T2 20 25 30 35
Dried solid contents
S a m p le s J5 J6 J4 J9 J1 J7 J3 J2 C1 J11 J13 J8 I1 J10 J12 J14 J15 J16 J17 J18 J19 J20 J21 J22 J23 J24 J25 J26 J27 J28 J29 J30 P1 T1 T10 T11 T2 T3 T4 T5 T6 T7 T8 T9 V1 V2 15 20 25 Salinity S a m p le s J1 J10 J27 J3 J2 J26 J14 J12 J11 J16 J13 J7 J20 J6 J30 T1 T3 V1 T4 I1 J28 J9 J17 J5 T6 V2 T2 T5 P1 T8 J29 T11 C1 T10 J24 T7 T9 J19 J25 J22 J15 J4 J8 J21 J23 J18 4.5 5.0 5.5 6.0 pH S a m p le s J8 J4 P1 J18 J5 J11 T9 J9 T10 J21 J13 T7 C1 T5 J15 J19 J22 J29 J2 T6 T2 T11 J7 J23 T8 T3 J17 T4 T1 J25 J16 J6 J10 J28 I1 J3 J14 J20 V2 J1 J12 J30 V1 J24 J27 J26 10 20 Acidity S a m p le s J8 J4 J9 J5 J11 J18 P1 J13 J7 J3 J2 J16 J10 J6 J14 J17 J1 J12 T11 T10 J15 J30 T5 C1 T7 T9 I1 J28 J21 J25 T4 T2 T6 J27 J19 J29 J20 J26 T3 J23 J22 T1 T8 J24 V1 V2 1 2 3 Total nitrogen S a m p le s J8 J4 J11 J9 J5 J13 J7 J3 J10 J12 J6 P1 J1 J16 J14 J18 J2 T11 T10 T5 T4 T6 J30 T7 J25 C1 I1 T2 J17 T9 J15 J26 T3 J19 J20 T8 J21 J24 J27 J28 J23 J29 T1 J22 V2 V1 0.0 0.5 1.0 1.5 2.0 Amino nitrogen S a m p le s J4 J8 J12 J3 J10 J1 J6 J11 J7 T11 T6 T4 J9 J14 J13 J5 J24 J16 T8 T10 T2 T7 J25 V2 T5 J26 T3 J30 I1 J2 C1 J20 T9 J19 T1 J27 P1 J15 J23 J22 J21 J29 V1 J17 J28 J18 25 50 75 100
Amino nitrogen/Total nitrogen
S a m p le s Country China Italy Japan Philippine Soy souce Thailand Vietnam
5. Introduction of data-driven approach to food production: a case study of salmon
fish sauce
5.1. Introduction
Fish sauce is a brown, liquid seasoning widely consumed in most Southeast Asian
countries. In general, fish sauce is produced by the fermentation of a mixture of fish
material and salt for more than 6 months at 30–35 ˚C (Fukami et al., 2004).
Microorganisms are often employed as a starter to hasten the fermentation. During this
period, the proteins in the fish material are hydrolyzed into amino acids and peptides
both by endogenous and microorganism proteases, which results in the distinctive taste
of fish sauces (Lopetcharat et al., 2001; Taira et al., 2007). The fermentation process
also produces volatile compounds responsible for the characteristic odor of fish sauce
(Yongsawatdigul et al., 2007; Zheng et al., 2017).
In Japan, fish sauce was widely used as a substitute for soy sauce and miso in
the past, especially in coastal areas. However, its consumption declined after the
the drastic change in Japanese society after the Meiji era (Ishige, 1986). Thereafter, the
production of fish sauce was seen in limited areas, i.e., Shottsuru in Akita prefecture and
Ishiru in Ishikawa prefecture. However, the production of fish sauce has recently gained
attention, and many local fish sauces are produced to revitalize local communities
throughout Japan. One reason that fish sauce production has gained attention is that
inedible fish materials and fish with low market values are usable to produce the
products.
From a nutritional perspective, fish sauce can be very nutritious due to the presence of
essential amino acids (Gildberg, 2004). Additionally, fermented fish sauce has various
biological activities, including angiotensin I-converting enzyme inhibitory activity and
insulin secretion-stimulating activity (Ichimaru et al., 2003). It has been clarified that
the peptides exhibiting such activities are generated by the hydrolysis of proteins in
salmon, sardines, and anchovies during fermentation. These findings suggest that fish
sauce could function to reduce the risk of hypertension and diabetes. Taking advantage
of the amino acid balance and bioactive functional peptides, there have been some
iron-deficient, anemic women in Southeast Asian countries such as Vietnam (Pham et
al., 2003). Therefore, fish sauce has great potential to be a functional food.
Consumers choose foods not only based on their function but also their tastes,
flavors, appearances, and package labels, among other things (Borgmeier and
Wstenhoefer, 2009). In addition to such factors, familiarity with the food is also an
important factor in consumer acceptance (Verneau et al., 2013). To understand
consumer preference and acceptance, researchers and developers employ consumer
research questionnaires and interviews (Kearney et al., 2000; Honkanen and Frewer,
2009; Milošević et al., 2012). Based on this consumer research, they construct concepts
for new products and produce pilot-scale products. Consumer acceptance of foods may
be assessed by sensory evaluations using trained panels and pilot-scale products. Pilot
products may be selected for production based on the results of such evaluations (upper
panel of Fig. 1). In this “traditional” approach to product development, many human
subjects are needed for the questionnaire, interview, and sensory evaluations. The
quality of the questionnaire and interview analyses highly depends on the prepared