Introduction
The hard-shelled mussel Mytilus coruscus is a Mytilidae bivalve.1) M. coruscus is distributed across East Asia and is cultivated commercially as a food in China and Korea. In Japan, M. coruscus inhabits the rocky bottom of intertidal zones from Hokkaido to Kyushu,1) and it is caught as a local specialty foodstuff. Because the animal is sold as a living bivalve, it is often exposed to air when handling in fishery and aquaculture production during transportation and sale. M. coruscus has been a subject of previous research in terms of the morphology of larvae,2) polymorphic microsatellite loci,3) microsatellite markers,4) biochemical response to heavy metal exposure,5) the effect of natural biofilm on the settlement mechanism,6) and the immune activities of hemocytes.7) In the field of respiratory physiology, M. coruscus in normoxic conditions has been studied to determine the hemolymph acid–base status.8) However, there are few reports on the respiratory physiology of air-exposed M. coruscus from the viewpoint of CO2 dynamic phase and acid–base balance. Therefore, we conducted three experiments in
order to evaluate the effect of air exposure: experimental animals were exposed to air for 24–48 h; immersion after exposure to air for 24 h; and non-exposed to air as the control. These results should be useful for understanding the hemolymph acid–base balance, the effect of air exposure, and the recovery process, and for the development of the method which reduces the effect of air exposure on M. coruscus.
Materials and Methods
Experimental animals and conditions
The experiments used 36 hard-shelled mussels M. coruscus (mean total wet weight: 186 g). The animals were collected from the coastal sea area of Tana marine biological laboratory of the National Fisheries University in the Seto Inland Sea, Yamaguchi Prefecture, Japan. After cleaning the shell valves, they were reared for 1 month at 24℃ in aerated seawater with added cultivated phytoplankton.9-11) Twenty-four hours before collecting hemolymph, the mussels were transferred to a respiratory chamber with flowing particle-free (>0.45 µm)
Effect of Air Exposure on Acid–Base Balance of
Hemolymph in Hard-shelled Mussel Mytilus coruscus
Takeshi Handa,
1†Akira Araki
1and Ken-ichi Yamamoto
1Abstract : We investigated the hemolymph acid–base status of the hard-shelled mussel Mytilus coruscus exposed to air for 24–48 h at 24°C. M. coruscus exposed to air showed a decrease in hemolymph pH from 7.625 to 7.118 after 24 h and to 6.702 after 48 h. The hemolymph total CO2 concentration increased from 1.43 mM/L to 3.12 mM/L during the first 24 h of air exposure, and increased to 6.32 mM/L after 48 h. The hemolymph CO2 partial pressure increased from 1.50 torr to 9.48 torr during the first 24 h of air exposure, and increased to 41.8 torr for 48 h. The hemolymph [HCO3–] increased to 2.74 mM/L at 24 h and to 4.62 mM/L at 48 h. These results indicated that during prolonged air exposure M. coruscus showed hemolymph acidosis with partial compensation. M. coruscus were immersed in seawater after air exposure for 24 h, and the acid–base status recovered to initial levels within 3–24 h.
Key words : Mytilus coruscus, hemolymph, acid–base balance, air exposure, normoxia, respiratory physiology
Affiliation: 1Department of Applied Aquabiology, National Fisheries University, Nagata-honmachi, Shimonoseki City, Yamaguchi
Pref., JAPAN
seawater. The experimental seawater had a salinity of 33 psu, water temperature 24℃ , O2 saturation 99%, pH 8.15, and total CO2 concentration 1.4 mM/L.
Experimental procedure
The effect of air exposure on hemolymph acid–base status was investigated using the following procedures. Series I. Air exposure
Experimental animals in the respiratory chamber were exposed to air by stopping the flow into the chamber and siphoning out the water. When the air exposure started (0 h), hemolymph was collected from the adductor muscle. Other experimental animals were exposed to air for 24 h or 48 h, and hemolymph was similarly collected from the adductor muscle. The temperature and humidity of the air were maintained by passing air through the experimental seawater, and adjusted air flowed into the respiratory chamber. Five different individual experimental animals were used for each analysis (n=15).
Series II. Non-exposure
As a control for Series I, animals were not exposed to air without stopping flow in the respiratory chamber, and hemolymph was collected at the same time as in Series I. Five different individual experimental animals were used for each analysis (n=15).
Series III. Immersion after air exposure
After exposure of the experimental animals to air for 24 h, the inflow of experimental seawater was resumed into the respiratory chamber, and the animals were immersed in seawater. Hemolymph was collected at 3 h and 24 h after immersion in seawater (R3 h, R24 h). Three different individual experimental animals were used for each analysis (n=6).
Hemolymph collection and analysis
Hemolymph was collected anaerobically once from each individual from the adductor muscle by direct puncture using a gas-tight microsyringe (Model 1750LTN, Hamilton Co.), and the volume of each hemolymph sample was 0.3 mL. Hemolymph pH and total CO2 concentration (Tco2, mM/L) were measured
immediately after collection. The pH was measured using a blood gas meter (BGM200; Cameron Instruments) with glass and reference electrodes (E301, E351; Cameron Instruments) at 24 ℃ . Tco2 was measured using a total CO2 analyzer (Capnicon 5; Cameron Instruments).
Calculation
The hemolymph CO2 partial pressure (Pco2, mmHg) and bicarbonate concentration ([HCO3–], mM/L) were calculated by rearranging the Henderson–Hasselbalch equation.12) In the equation, the CO
2 solubility coefficient (αco2) and apparent dissociation constant of carbonic acid (pKapp) of M. coruscus hemolymph required. Handa et al. (2017) described hemolymph αco2 and pKapp of M. coruscus were 40.6 µM/L/torr and 6.2609,8) respectively. The hemolymph Pco2 and [HCO3–] were calculated using the following equations:
Pco2 = Tco2 · [0.0406 · (1 + 10 (pH - 6.2609))] -1 [HCO3–] = Tco2 - 0.0406 · Pco2
The non-bicarbonate buffer value (ϐNB, slykes) and the related expression of the hemolymph non-bicarbonate buffer were calculated from the in vitro experiments8) on hard-shell mussel.
Statistical analysis
All data are expressed as means ± standard error of the means. Kruskal–Wallis test was performed for changes in hemolymph properties over the experimental time course. The comparison of two mean values used Mann–Whitney’s U test. Statistically significant differences were set at P < 0.05 (KyPlot 5.0, KyensLab Inc.)
Results
The hemolymph pH of air-exposed animals (Series I) was 7.118 at 24 h and 6.702 at 48 h (Fig. 1). These mean values were statistically significantly lower than the value at 0 h (P < 0.01). The hemolymph Tco2 increased significantly during air exposure (P < 0.01), reaching 3.12 mM/L at 24 h and 6.32 mM/L at 48 h (Fig. 2). The
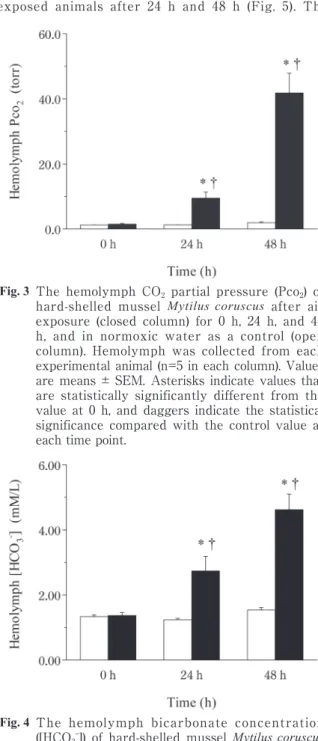
hemolymph Pco2 increased from 1.50 torr to 9.48 torr during the first 24 h of air exposure, and increased to 41.8 torr after 48 h (P < 0.01, Fig. 3). The hemolymph [HCO3–] increased significantly during air exposure (P < 0.01), reaching 2.74 mM/L at 24 h and 4.62 mM/L at 48 h (Fig. 4). In the control group (Series II), the mean values
of hemolymph pH were 7.569–7.691 from 0 h to 48 h, and those for Tco2 were 1.29–1.62 mM/L. The mean Pco2 and [HCO3–] from 0 h to 48 h were 1.22–1.93 torr and 1.24–1.54 mM/L (Series II). The hemolymph pH of immersed animals (Series III) was higher than the pH of air-exposed animals after 24 h and 48 h (Fig. 5). The
Fig. 1 The hemolymph pH of hard-shelled mussel Mytilus coruscus after air exposure (closed column) for 0 h, 24 h, and 48 h, and in normoxic water as a control (open column). Hemolymph was collected from each experimental animal (n=5 in each column). Values are means± SEM. Asterisks indicate values that are statistically significantly different from the value at 0 h, and daggers indicate the statistical significance compared with the control value at each time point.
Fig. 3 The hemolymph CO2 partial pressure (Pco2) of hard-shelled mussel Mytilus coruscus after air exposure (closed column) for 0 h, 24 h, and 48 h, and in normoxic water as a control (open column). Hemolymph was collected from each experimental animal (n=5 in each column). Values are means ± SEM. Asterisks indicate values that are statistically significantly different from the value at 0 h, and daggers indicate the statistical significance compared with the control value at each time point.
Fig. 2 The hemolymph total CO2 concentration (Tco2) of hard-shelled mussel Mytilus coruscus in after exposure (closed column) for 0 h, 24 h, and 48 h, and in normoxic water as a control (open column). Hemolymph was collected from each experimental animal (n=5 in each column). Values are means ± SEM. Asterisks indicate values that are statistically significantly different from the value at 0 h, and daggers indicate the statistical significance compared with the control value at each time point.
Fig. 4 The hemolymph bicarbonate concentration ([HCO3–]) of hard-shelled mussel Mytilus coruscus after air exposure (closed column) for 0 h, 24 h, and 48 h, and in normoxic water as a control (open column). Hemolymph was collected from each experimental animal (n=5 in each column). Values are means ± SEM. Asterisks indicate values that are statistically significantly different from the value at 0 h, and daggers indicate the statistical significance compared with control value at each time point.
hemolymph [HCO3–] of immersed animals was lower than the [HCO3–] of air-exposed animals. There were statistically significant differences in pH, [HCO3–], and Pco2 between immersed animals (R3 h, R24 h) and air-exposed animals (24 h, 48 h). There were no significant differences of hemolymph properties between the values for R3 h, R24 h, 0 h, and the control (Fig. 5). The ϐNB, which is the slope of the non-bicarbonate buffer line, was 0.44 slykes, and the relationship with the expression of the hemolymph non-bicarbonate buffer line is indicated in Fig. 5.
Discussion
We examined the hemolymph acid–base status of the hard-shelled mussel M. coruscus to evaluate the effect of air exposure. M. coruscus demonstrated reduced hemolymph pH and increased Tco2 and Pco2 over the time course of air exposure (Figs. 1-3). Experimental animals exposed to the air were unable to ventilate the ctenidium, which inhibited the release of CO2. CO2 gradually accumulated in the hemolymph, causing progressive acidosis. Therefore, acidosis in the animals during the air exposure could include respiratory
acidosis by the inhibition of CO2 release. In some marine and freshwater bivalves, the hemolymph and pericardiac fluid showed a drop of oxygen partial pressure13-15) and acidosis during air exposure.13-17) Although we did not measure the anaerobic end-products, the results of the biochemical studies on anaerobic metabolism18-22) suggested that air exposure conducted in this study was sufficient to force anaerobic metabolism in the experimental animals. Therefore, M. coruscus exposed to air for a prolonged time might have undergone metabolic acidosis in this study. M. coruscus seemed to rapidly reduce Po2 and deplete stored oxygen when air exposure was started, and causing anaerobic metabolism and metabolic acidosis.
M. coruscus exposed to the air increased hemolymph [HCO3–] (Fig. 4). The increased in [HCO3–] during exposure to air should derive from mobilization of the shell valves (CaCO3 crystal). In marine and freshwater bivalves, acidosis during air exposure involved increased bicarbonate and calcium ion concentrations in the hemolymph or pericardiac fluid.13-16) Research using radiolabeled markers indicated that the source of increased calcium was a shell valve.23) Bicarbonate that dissolved from the shell valve could buffer the
Fig. 5 A hemolymph pH-[HCO3–] diagram of air-exposed (closed circles, Series I), control (open circles, Series II), and immersed Mytilus coruscus (open squares, Series III). The Pco2 isopleths are derived from rearranging the Hendersson–Hasselbalch equation,12) and αco
2 and pKapp of the experimental animals were 40.6 µM/L/ torr and 6.2609,8) respectively. The dashed line is the in vitro non-bicarbonate buffer line:[HCO
3–] = 4.7413 – 0.4412 · pH (R2=0.7045) The line was obtained from the results of in vitro experiments.8)
hemolymph of M. coruscus. According to the pH-[HCO3–] diagram of M. coruscus hemolymph (Fig. 5), [HCO3–] and Pco2 increased considerably with the reduction in pH, and the points at 24 h and 48 h were located above the non-bicarbonate buffer line. The increase in acidic end-products during air exposure should dissolve the shell valve, and the bicarbonate that was mobilized from the shell compensated partially for the acidosis. Therefore, [HCO3–] derived from the shell valve was applied as metabolic compensation for acidosis. The increased Pco2 during air exposure derived from the liberated CO2 when an acidic end-product was buffered by shell carbonates.
M. coruscus showed increased hemolymph pH when the experimental animals were immersed in seawater after air exposure (Fig. 5). The aerobic metabolism of the experimental animals resumed, and anaerobic metabolite were not produced. The increased [HCO3–] during air exposure was consumed to compensate for acidosis, and [HCO3–] decreased within 24 h in the immersed animals. The hemolymph Pco2 reduced with the increase in pH. The experimental animals should resume ventilation and rapidly release CO2 from the ctenidium after immersion. There were no significant differences in pH, [HCO3–] and Pco2 between the values at R3 h, R24 h, 0 h, and the control (P > 0.05). M. coruscus during air exposure for 24– 48hr showed respiratory and metabolic acidosis with partial compensation by bicarbonate mobilized from the shell, and the acid-base status recovered to the initial levels within 3–24 h after immersed in the seawater again.
References
1) Okutani T: Mytiloida. In: Okutani T (ed) Marine Mollusks in Japan. Tokai University Press, Tokyo, 862-878 (2000)
2) Semenikhina OY, Kolotukhina NK and Evseev GA: Morphology of larvae of the family Mytilidae (Bivalvia) from the north-western part of the Sea of Japan. JMBA, 88, 331-339 (2008)
3) Xu TJ, Sun YN, Yuan YT, Liao Z and Wang RX:
Isolation and characterization of polymorphic microsatellite loci in the hard-shelled mussel, Mytilus coruscus (Mytilidae). Genet Mol Res, 9, 1338-1391 (2010) 4) An HS and Lee JW: Development of microsatellite
markers for the Korean Mussel, Mytilus coruscus (Mytilidae) using next-generation sequencing. Int J Mol Sci, 13, 10583-10593 (2012)
5) Li Y, Gu Z, Liu H, Shen H and Yang J: Biochemical response of the mussel Mytilus coruscus (Mytiloida: Mytilidae) exposed to in vivo sub-lethal cooper concentrations. Chin J Oceanol Limn, 30, 738-745 (2012) 6) Yand JL, Li X, Liang X, Bao WY, Shen HD and Li
JL: Effects of natural biofilms on settlement of plantigrades of the mussel Mytilus coruscus. Aquaculture, 425, 228-233 (2014)
7) Yang HS, Hong HK, Donaghy L, Noh CH, Park HS, Kim DS and Choi KS: Morphology and immune-related activities of hemocytes of the mussel Mytilus coruscus (Gould, 1861) from East Sea of Korea. Ocean Sci J, 50, 77-85 (2015)
8) Handa T, Araki A and Yamamoto K: Acid–base balance of the hard-shelled mussel Mytilus coruscus in normoxic conditions. J Nat Fish Univ, 65, 39-46 (2017) 9) Yamamoto K, Adachi S, Tamura I, Aramizu T and
Koube H: Effects of hypoxia and water temperature on ciliary movement of gills 5 bivalvia, Mytilus edulis, Atrina pectinate, Pinctada fucata martensii, Chlamys nobilis and Crassostrea gigas. J Nat Fish Univ, 44, 137-142 (1996)
10) Yamamoto K, Handa T, Nakamura M, Kitukawa K, Kita Y, Takimoto S, Nishikawa S: Effects of ozone-produced oxidants on respiration of the pearl oyster, Pinctada fucata martensii. Aquaculture Sci, 47, 241-248 (1999)
11) Yamamoto K, Handa T: Effect of hypoxia on oxygen uptake in the Pacific oyster Crassostrea gigas. Aquaculture Sci, 59, 199-202, (2011)
12) Davenport HW: Fundamental equation. In: The ABC of acid–base chemistry 6th edition. University of Chicago Press, Chicago, 39-41 (1974)
13) Jokumsen A and Fyhn HJ: The influence of aerial exposure upon respiratory and osmotic properties of
haemolymph from two intertidal mussels, Mytilus edulis L. and Modiolus modiolus L. J Exp Mar Biol Ecol, 61, 189-203 (1982)
14) Booth CE, McDonald DG, Walsh PJ: Acid–base balance in the sea mussel, Mytilus edulis. I. Effects of hypoxia and air-exposure on hemolymph acid–base status. Mar Bio Lett, 5, 347-358 (1984)
15) Byrne RA, Shipman BN, Smatresk NJ, Dietz and McMahon RF: Acid–base balance during emergence in the freshwater bivalve Corbicula fluminea. Physiol Zool, 64, 748-766 (1991)
16) Byrne RA and McMahon BR: Acid–base and ionic regulation, during and following emersion, in the freshwater bivalve, Anodonta grandis simponiana (Bivalvia: Unionidae). Biol Bull, 181, 289-297 (1991) 17) Michaelidis B, Haas D, Grieshaber MK: Extracellular
and intracellular acid–base status with regard to the energy metabolism in the oyster Crassostrea gigas during exposure to air. Physiol Biochem Zool, 78, 373-383 (2005)
18) Zwaan AD and Wijsman TCM: Anaerobic metabolism in bivalvia (Mollusca), Characteristics of anaerobic metabolism. Comp Biochem Physiol, 54B, 313-324 (1976).
19) Kluytmans, JH, Bont AMT de, Janus J and Wijsman TCM: Time dependent changes and tissue specificities in the accumulation of anaerobic fermentation products in the sea mussel Mytilus edulis L. Comp Biochem Physiol, 58B, 81-87 (1977) 20) Livingstone DR and Bayne BL: Responses of Mytilus
edulis L. to low oxygen tension: Anaerobic metabolism of the posterior adductor muscle and mantle tissues. J Comp Physiol, 114, 143-155 (1977) 21) Livingstone DR: Anaerobic metabolism in the
posterior adductor muscle of the common mussel Mytilus edulis L. in response to altered oxygen tension and temperature. Physiol Zool, 51, 131-139 (1978) 22) Zwaan A de, Bont AMT de, Zurbug W, Bayne BL
and Livingstone DR: On the role of strombine formation in the energy metabolism of adductor muscle of a sessile bivalve. J Comp Physiol, 149, 557-563 (1983)
23) Crenshaw MA and Neff JM: Decalcification at the mantle-shell interface in molluscus. Am Zool, 9, 881-885 (1969)
![Fig. 5 A hemolymph pH-[HCO 3 – ] diagram of air-exposed (closed circles, Series I), control (open circles, Series II), and immersed Mytilus coruscus (open squares, Series III)](https://thumb-ap.123doks.com/thumbv2/123deta/6947638.1189178/4.892.192.693.764.1092/hemolymph-diagram-exposed-circles-series-immersed-mytilus-coruscus.webp)
