Chapter 4 A Review of the Availability of and
Studies on Spatial Economic Data in Laos
権利
Copyrights 日本貿易振興機構(ジェトロ)アジア
経済研究所 / Institute of Developing
Economies, Japan External Trade Organization
(IDE-JETRO) http://www.ide.go.jp
journal or
publication title
Spatial Statistics and Industrial Location in
CLMV
page range
1-21
year
2010-03
Kuroiwa ed., Spatial Statistics and Industrial Location in CLMV: An Interim Report, Chosakenkyu Hokokusho, IDE-JETRO, 2010.
Chapter 4
A Review of the Availability of and Studies on Spatial Economic Data in Laos
1Souknilanh Keola
1. Introduction
Spatial data are being increasingly used in a wide range of disciplines, a fact that is clearly reflected in the recent trend to add spatial dimensions to the conventional social sciences. Economics is by no means an exception. On one hand, spatial data are indispensable to many branches of economics such as economic geography, new economic geography, or spatial economics. On the other hand, macroeconomic data are becoming available at more and more micro levels, so that academics and analysts take it for granted that they are available not only for an entire country, but also for more detailed levels (e.g. state, province, and even city).
The term ‘spatial economics data’ as used in this report refers to any economic data that has spatial information attached. This spatial information can be the coordinates of a location at best or a less precise place name as is used to describe administrative units. Obviously, the latter cannot be used without a map of corresponding administrative units. Maps are therefore indispensible to the analysis of spatial economic data without absolute coordinates. The aim of this report is to review the availability of spatial economic data that pertains specifically to Laos and academic studies conducted on such data up to the present. In regards to the availability of spatial economic data, efforts have been made to identify not only data that has been made available as geographic information systems (GIS) data, but also those with sufficient place
2 labels attached.
The rest of the report is organized as follows. Section 2 reviews the maps available for Laos, both in hard copy and editable electronic formats. Section 3 summarizes the spatial economic data available for Laos at the present time, and Section 4 reviews and categorizes the many economic studies utilizing these spatial data. Section 5 give examples of some of the spatial industrial data collected for this research. Section 6 provides a summary of the findings and gives some indication of the direction of the final report due for completion in fiscal 2010.
2. Maps of Laos
The present territory of Laos was largely divided and determined through conflicts and compromise between France and Thailand between the late 1800s to early 1900s. Early maps of Laos were created by France as part of its efforts to take control of the region. Maps of Laos produced during the colonial period were detailed to the second administrative level (province level)2 at best, and showed the position of the provincial capital and some important cities.
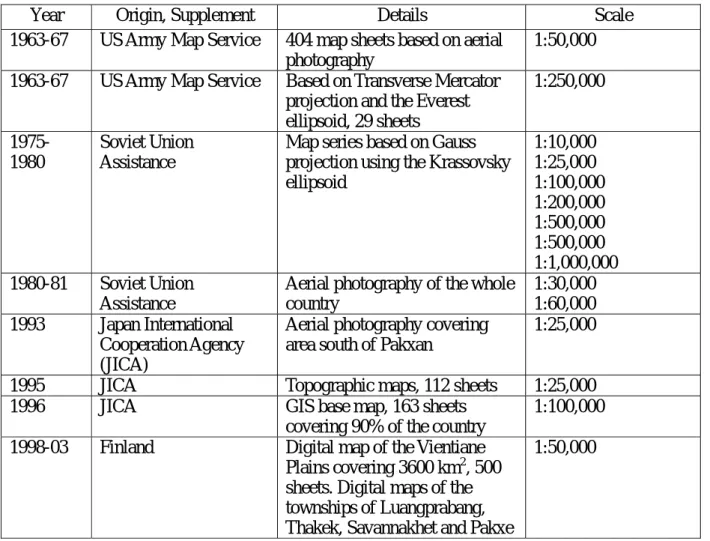
Recent source of maps for Laos are based on surveys as shown in Table 1. Maps of Laos were created through external assistances, so did many other major infrastructures in the country. There were aids from US in 1960s, former Soviet Union in 1980s, and Japan in 1990s. Finland assisted with development of digital map of major plains and several urban areas from late 1990s to early 2000s.
Third level (district level) administrative maps were not widely available until publication of the 2005 population census. The district boundary map is still the smallest administrative map
2 Province is the second administrative level in Laos; the first administrative level refers to the whole country.
3
available at present, although much supplementary information (e.g. village positions and information, road networks) is getting more and more available.
Table 1: Primary Resources for Laos Maps
Year Origin, Supplement Details Scale 1963-67 US Army Map Service 404 map sheets based on aerial
photography
1:50,000 1963-67 US Army Map Service Based on Transverse Mercator
projection and the Everest ellipsoid, 29 sheets 1:250,000 1975-1980 Soviet Union Assistance
Map series based on Gauss projection using the Krassovsky ellipsoid 1:10,000 1:25,000 1:100,000 1:200,000 1:500,000 1:500,000 1:1,000,000 1980-81 Soviet Union Assistance
Aerial photography of the whole country 1:30,000 1:60,000 1993 Japan International Cooperation Agency (JICA)
Aerial photography covering area south of Pakxan
1:25,000
1995 JICA Topographic maps, 112 sheets 1:25,000 1996 JICA GIS base map, 163 sheets
covering 90% of the country
1:100,000 1998-03 Finland Digital map of the Vientiane
Plains covering 3600 km2, 500 sheets. Digital maps of the townships of Luangprabang, Thakek, Savannakhet and Pakxe
1:50,000
Source: http://www.gisdevelopment.net/magazine/years/2007/march/32_1.htm accessed in March 2010.
It has never been easy to obtain up-to-date administrative maps of Laos. Numbers of administrative units of Laos have changed quite frequently. Number of provinces, the first administrative level, was 9 in 1912, which then rose to 12 by 1926 and to 17 by 1975. During this time, some provinces were divided, merged, making total number fluctuated. Nevertheless,
4
provincial level maps have been generally available on a relatively timely basis.
However, up-to-date district, or the second level administrative maps are quite difficult to obtain, as their boundaries change more frequently. While the number of provinces has stayed more or less the same since mid 1970s, the number of districts has increased from 112 in 1985 to 117 in 1995, 142 in 2003, 139 in 2006, and 140 in 2008.
Boundaries of villages, the smallest administrative units in Laos have continued to be difficult to obtain. In fact nationwide village boundaries may not exist in reality. Representative location but not the boundaries of villages based on 2005 population census are nevertheless confirmed to exist. It is, however, understandable how difficult it would be to keep up-to-date records of the boundaries of Lao villages, given their number, remoteness and available administrative resources. The number of villages was more than 10,000 in 1995 and around 8,000 in 2005.
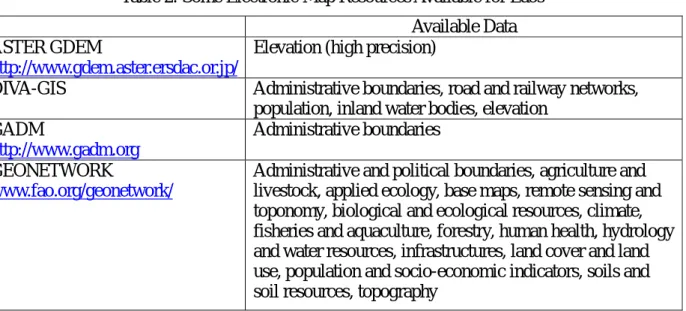
Of the many maps published by the Lao authorities, few are available in digitally analyzable forms to GIS software. They usually come as hard copy and are often difficult to use with spatial data without additional processes. There are, however, a number of online resources for map data in many digital formats (see Table 2). DIVA-GIS (http://www.diva-gis.org/), a website offering free downloads of GIS software, provides a lot of spatial data for many countries in the world, including Laos. Downloadable country-based spatial data on DIVA-GIS’s site include administrative boundaries, up to district level in Laos’ case, population by province, road and railway networks, land cover, inland water bodies, and elevation. Also available on the website of GADM (Global Administrative Areas, http://www.gadm.org) are data on administrative area boundaries.
The GEONETWORK, a portal of geo information on the net, operated by the Food and Agriculture Organization (FAO) of the United Nations, provides more up-to-date maps of the
5
administrative units of all countries in the world, including Laos. Spatial data on GEONETWORK includes from those accessible to limited users, to freely available to anyone to download. They are however come with best meta-information such as abstracts, status, sources, time stamps etc.
Table 2: Some Electronic Map Resources Available for Laos
Available Data
ASTER GDEM
http://www.gdem.aster.ersdac.or.jp/
Elevation (high precision)
DIVA-GIS Administrative boundaries, road and railway networks, population, inland water bodies, elevation
GADM
http://www.gadm.org
Administrative boundaries GEONETWORK
www.fao.org/geonetwork/
Administrative and political boundaries, agriculture and livestock, applied ecology, base maps, remote sensing and toponomy, biological and ecological resources, climate, fisheries and aquaculture, forestry, human health, hydrology and water resources, infrastructures, land cover and land use, population and socio-economic indicators, soils and soil resources, topography
Source: Author.
In short, there are two major sources and types of maps available for Laos. Firstly, Lao authorities publish hard copy of up to district level maps and representative positions of villages. Electronic formats of these maps exist, but only available for purchase upon case by case basis. Secondly, external sources provide free or restricted administrative boundaries of up to district level, alongside other supplemental spatial data such as those detailing road and rail networks, inland water bodies, and elevation. It is worth noting that digitization of information on hard copy maps is also becoming a practical option, given the increased availability of free or low-cost
6
GIS software in recent years3. Moving around places with GPS could also produce their electronically analyzable formats.
3. Laos’ Spatial Economic Data
Macroeconomic statistics began to appear as early as in the colonial government’s administrative reports from around the beginning of the 1900s, although their accuracy remains largely questionable. Population by provinces was available as early as the beginning of 1900s. Expenditure figures began to appear in the budgetary reports from 1926 onwards and some industrial establishment lists appeared in administrative reports during the period of civil war4.
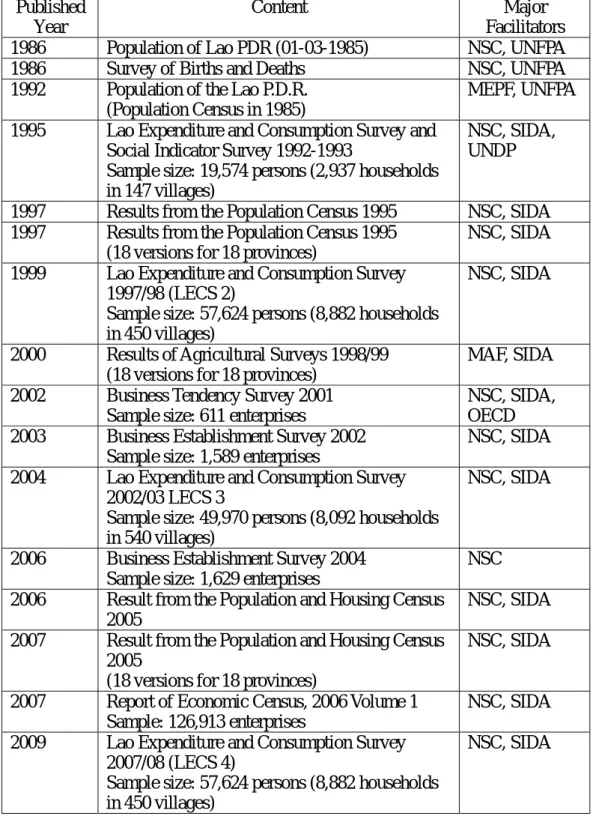
After 1975, the National Statistical Center (NSC) has played leading role in making data, including spatial economic ones, on Laos available. NSC has provided considerable and comprehensive nationwide spatial data in recent years, mostly through assistances and cooperation from international donors such as the Swedish International Development Agency (SIDA) and the United Nations and. As shown in Table 3, population censuses have been carried out every 10 years since 1985. Population censuses include not only number of inhabitants but also many social and economic indicators. The figures from population censuses are spatial economic data by definition, as they collected by villages, the smallest administrative unit in Laos, and relevant to economics in one way or another. Quality of data in population censuses improved outstandingly with the financial and technical assistances by SIDA started in 1995
3 The IDE Geographical Simulation Model: Predicting Long-Term Effects of Infrastructure
Development Projects by Kumagai et al (2008)
(http://ir.ide.go.jp/dspace/bitstream/2344/776/3/ARRIDE_Discussion_No.159_kumagai.pdf) extensively utilized spatial information collected from hard copy maps.
7 population census.
Lao Expenditure and consumption surveys (LECS) have been conducted every few years since 1992. LECS 1 conducted in 1992/93 covered 19,574 persons in 147 villages nationwide. The content and coverage of LECS expanded and improved significantly since LECS 2 in 1999. Questions asked in LECS include education, income, consumption, time spent, etc.
Although many economic establishment surveys were conducted in the 1990s, none before 2002 are publicly available. Establishment surveys became an economic census in 2006, although the results did not appear publicly until 2008. The results of these establishment surveys, including those available for limited administrative and academic users, will undoubtedly become one of the major sources studies on industrial development, including those utilizing spatial dimension data, in the years to come.
Besides the National Statistical Center, many line ministries as well as provincial, district, and even village offices also collect spatial economic data for administrative purposes. Unfortunately, most such data have not been published or stored properly, especially in regards to data collected before the era of personal computers. Some spatial information such as the location, number of employees, registered capital, and production capacity of economic establishments have been collected and revised almost every year for licensing and taxation purposes. These items constitute quality information which is obviously valuable for academic research.
Finally, some mostly remote sensing-based GIS data are made publicly available by developed countries’ governmental or intra-governmental organizations. For instance, elevation data for all countries including Laos are available for download on NASA’s ASTER website (Table 2). Last but not least are the many individual surveys conducted by educational institutions, think tanks, and NGOs. Mechanisms for the pooling and sharing of existing spatial economic data would contribute enormously to making more data on Laos available and to facilitating
8 academic studies that utilize such data.
Table 3: Major Spatial Economic Data for Laos Published
Year
Content Major Facilitators
1986 Population of Lao PDR (01-03-1985) NSC, UNFPA 1986 Survey of Births and Deaths NSC, UNFPA 1992 Population of the Lao P.D.R.
(Population Census in 1985)
MEPF, UNFPA 1995 Lao Expenditure and Consumption Survey and
Social Indicator Survey 1992-1993
Sample size: 19,574 persons (2,937 households in 147 villages)
NSC, SIDA, UNDP
1997 Results from the Population Census 1995 NSC, SIDA 1997 Results from the Population Census 1995
(18 versions for 18 provinces)
NSC, SIDA 1999 Lao Expenditure and Consumption Survey
1997/98 (LECS 2)
Sample size: 57,624 persons (8,882 households in 450 villages)
NSC, SIDA
2000 Results of Agricultural Surveys 1998/99 (18 versions for 18 provinces)
MAF, SIDA 2002 Business Tendency Survey 2001
Sample size: 611 enterprises
NSC, SIDA, OECD 2003 Business Establishment Survey 2002
Sample size: 1,589 enterprises
NSC, SIDA 2004 Lao Expenditure and Consumption Survey
2002/03 LECS 3
Sample size: 49,970 persons (8,092 households in 540 villages)
NSC, SIDA
2006 Business Establishment Survey 2004 Sample size: 1,629 enterprises
NSC 2006 Result from the Population and Housing Census
2005
NSC, SIDA 2007 Result from the Population and Housing Census
2005
(18 versions for 18 provinces)
NSC, SIDA
2007 Report of Economic Census, 2006 Volume 1 Sample: 126,913 enterprises
NSC, SIDA 2009 Lao Expenditure and Consumption Survey
2007/08 (LECS 4)
Sample size: 57,624 persons (8,882 households in 450 villages)
NSC, SIDA
9
Note: NSC is National Statistical Center. SIDA is Swedish International Development Agency. MAF is Ministry of Agriculture and Forestry.
To summarize at this point, firstly, there is clearly much spatial economic data on Laos becoming available for academic research. The primary sources of such data are national, intra-, inter-country and non-governmental organizations (See Table 2 and Table 3). Some data sets are available to the public, are better stored and more reliable than other datasets. Secondly, there are many administrative data that can as well become spatial economic data through digitization processes. Most of them were not created with clear GIS concept from the outset, but with sufficient location labels and time stamps, they have most information needed as spatial economic data.
4. Research on Laos’ Spatial Economic Data
Research on Laos’s spatial economic data has taken two forms thus far. First, there are studies based on spatial economic data, mostly on a country-wide basis, provided by statistical or other authorities. However, many of the studies in this category have used these data with geographic information without explicitly taking into account the spatial dimensions of them. Bourdet (1998) was among the pioneers to use spatial data on Laos in his study that presents many regional disparities, including agglomeration of industrial establishments, by using province level data5. However, in his study, average number of households per village was used as proxy of distance.
5 The Dynamics of Regional Disparities in Laos: The Poor and the Rich
10
Studies by Anderson6 et al. (2006) on the determinants of poverty and Warr7 (2006) on the relation between road development and poverty reduction in Laos both utilized LECS. While LECS provides relatively high-precision position labels such as village names from which accessibility may be calculated, they have been rarely utilized among studies in this category.
Epprecht et al. (2008) made further advances through more applied use of spatial information from LECS in their analysis of poverty and inequality in Laos8. They made use of many other spatial information was such as the elevation of villages, surface roughness, and mean slope from village center points, besides information from LECS which originally based on interviews. However, accessibility was still principally based on responses in LECS, without making use of the relative positions of the villages which can be obtained easily from their names. Hamaguchi9 (2007) found distance from the Capital to significantly impact on per capita GRDP negatively in Laos. Kumagai et al.’s (2008) study of infrastructure development in the Mekong region seems to be the first that uses Laos’ spatial economic data within the theoretical framework of new economic geography. In this study, distances between two pair of regions were calculated by shortest distances between them through road networks. Messerli et al. (2009) recently proposed a new interesting method, where relative positions were explicitly used, for
6 Determinants of Poverty in Lao PDR (http://swopec.hhs.se/eijswp/papers/eijswp0223.pdf) 7 Road Development and Poverty Reduction: The Case of Lao PDR
(http://unpan1.un.org/intradoc/groups/public/documents/APCITY/UNPAN022865.pdf) Accessed March 2010.
8 The Geography of Poverty and Inequality in the Lao PDR by Michael Epprecht, Nicholas Minot,
Reno Dewina, Peter Messerli and Andreas Heinimann.
(http://www.laoatlas.net/links/PDF/The%20Geography%20of%20Poverty%20and%20Inequality%20in%2 0the%20Lao%20PDR.pdf) Accessed March 2010.
9 Regional Income Inequalities in East Asia.
11
analyzing human activities by using land cover and population census data10.
Secondly, many studies, mainly in agricultural economics, have utilized remote sensing together with global position system (GPS) ground surveys. Nagasawa et al. (1998) studied the possibility of using temporal high-resolution satellite data to monitor slash and burn cultivation in Laos. Inoue et al. (2002) conducted a case study on the shifting cultivation system in Northern Laos using remote sensing technology11 and Yasuda et al. (2005) analyzed the spatial patterns of land use in Northern mountainous region of Laos using remote sensing data.
To summarize the existing research using Laos’ spatial economic data, on the one hand, although more nationwide spatial economic data has become available in recent years, most of their spatial dimensions have yet to be sufficiently utilized, in the sense that only distance to certain place in certain direction was taken into account. Most of the studies on nationwide spatial economic data for Laos concentrated on income or poverty, and not industrial location/agglomeration. On the other hand, while spatial data from remote sensing and ground surveys have being intensively used mainly in agricultural economics, they have only covered very limited geographic areas of Laos.
5. Some Example of Spatial Economic Data Collected
The purpose of our research group is to study industrial agglomeration in relation to economic
10 Finding Homogeneity in Heterogeneity ‒ A New Approach to Quantifying Landscape Mosaics
Developed for the Lao PDR
(http://www.springerlink.com/content/ng0q21401m578q70/fulltext.pdf) Accessed March 2010.
11 Monitoring and structural analysis of terrestrial food production ecosystems
(http://nels.nii.ac.jp/els/110001740705.pdf?id=ART0001882191&type=pdf&lang=jp&host=cinii&or der_no=&ppv_type=0&lang_sw=&no=1268104072&cp=) Accessed March 2010.
12
integration among the countries of the Indochinese peninsula, namely, Cambodia, Laos, Myanmar, Thailand, and Vietnam. Analysis will be principally conducted at a district or second administrative level and by type of economic activities. New economic geography will be one of the main theoretical frameworks on which the articles produced by this research group will be based. As a part of this topic, the aim of this report is to focus on Laos. Many spatial data on industrial agglomeration in Laos such as data on distribution of population, infrastructure, and the many types of economic activities have been collected.
The following are examples of the spatial economic data collected by our research group this fiscal year.
5.1 Maps
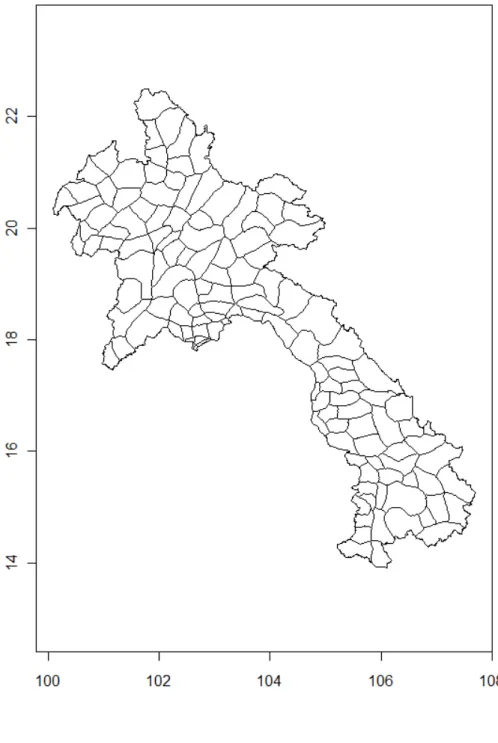
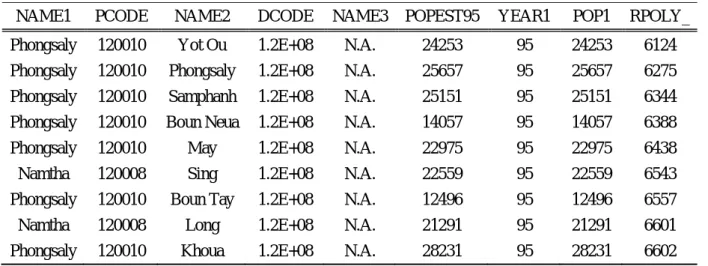
Digital maps of Laos’ administrative areas at province and district levels have been collected in shapefile format from many sources. Firstly Figure 1 is the map of Laos’ secondary administrative units, or districts based on a shapefile at GEONETWORK. Number of district in this map is 133. This map come with many supplementary data, such as area in square kilometers, population in 1995 as shown in Table 4-a and 4-b.
Beside maps of administrative areas, shapes or positions of infrastructures such as road, railways and ports have also been collected. Figure 2 depicts shapes of roads and trails based on shapefile at DIVA-GIS’s website.
13
Figure 1: Map of Laos’ Second Administrative Units (Districts)
14
Figure 2: Shapes of Roads and Trails
15
Table 4-a: Spatial Data Attached to Map in Figure 1
AREA PERIMETER ASIA2000_2 ASIA2000_2.1 SQKM ADMSQKM CODE
0.26685 2.49312 6124 6125 3054.4 3054.4 L 0.25147 2.09371 6275 6276 2885.7 2885.7 L 0.21304 2.28013 6344 6345 2449.4 2449.4 L 0.12172 1.78008 6388 6389 1398.6 1398.6 L 0.23976 2.73061 6438 6439 2760.5 2760.5 L 0.17545 2.00318 6543 6544 2022 2022 L 0.11046 1.40053 6557 6558 1272.5 1272.5 L 0.14394 1.81631 6601 6602 1661.7 1661.7 L 0.13491 1.51252 6602 6603 1556 1556 L 0.26455 2.08191 6620 6621 3054.5 3054.5 L 0.12127 1.40764 6635 6636 1399.8 1399.8 L 0.26788 2.41766 6661 6662 3098.5 3098.5 L 0.10303 1.27125 6693 6695 1190.4 1190.4 L 0.25788 2.50827 6719 6721 2982.3 2982.3 L 0.15109 1.88589 6720 6722 1747.9 1747.9 L 0.12123 1.42884 6752 6755 1402.5 1402.5 L 0.16048 1.72424 6784 6787 1856.5 1856.5 L 0.34775 2.57594 6792 6795 4027.9 4027.9 L 0.2233 1.98652 6795 6798 2584.2 2584.2 L Source: GEONETWORK.
Table 4-b: Spatial Data Attached to Map in Figure 1
NAME1 PCODE NAME2 DCODE NAME3 POPEST95 YEAR1 POP1 RPOLY_
Phongsaly 120010 Yot Ou 1.2E+08 N.A. 24253 95 24253 6124
Phongsaly 120010 Phongsaly 1.2E+08 N.A. 25657 95 25657 6275
Phongsaly 120010 Samphanh 1.2E+08 N.A. 25151 95 25151 6344
Phongsaly 120010 Boun Neua 1.2E+08 N.A. 14057 95 14057 6388
Phongsaly 120010 May 1.2E+08 N.A. 22975 95 22975 6438
Namtha 120008 Sing 1.2E+08 N.A. 22559 95 22559 6543
Phongsaly 120010 Boun Tay 1.2E+08 N.A. 12496 95 12496 6557
Namtha 120008 Long 1.2E+08 N.A. 21291 95 21291 6601
Phongsaly 120010 Khoua 1.2E+08 N.A. 28231 95 28231 6602
16 5.2 Spatial Economic Data
Many spatial economic data have collected. Populations by district have been collected for 1995 and 2005. Efforts have been made to collect other data on these two specific years for analytical purpose. Figure 3-a to 3-d depicts district level map of Khammouan, a province in central Laos and location of under construction Third Mekong Friendship Bridge between Laos and Thailand, and location of foreign direct investments by activities. Village population and locations are used in this figure in order to better show their relative positions with location of industrial establishments.
17
Figure 3-a: Village Population and Industrial Location by Activity
18
Figure 3-b: Village Population and Industrial Location by Activity
19
Figure 3-c: Village Population and Industrial Location by Activity
20
Figure 3-d: Village Population and Industrial Location by Activity
21
6. Concluding Remarks
This interim report examined the availability of spatial economic data pertaining to Laos. It also reviewed academic research that has used such data to date. It found that spatial economic data is increasingly becoming available in general as well in the case of Laos specifically and that many studies have used these spatial data, although few as yet have actually made use of the spatial dimensions available in these data.
Some examples of the data collected to analyze industrial agglomeration in Laos were described. Most of the data needed for analysis based on new economic geography or spatial economics have been successfully collected. These data will be utilized in analyses in search of possible generalizations in the spatial distribution of people and the many types of economic activities, as well as empirical research on theoretical frameworks of spatial economics.