Indian IT software engineers in Japan : a
preliminary analysis
著者
Ota Hitoshi
権利
Copyrights 日本貿易振興機構(ジェトロ)アジア
経済研究所 / Institute of Developing
Economies, Japan External Trade Organization
(IDE-JETRO) http://www.ide.go.jp
journal or
publication title
IDE Discussion Paper
volume
168
year
2008-09-01
INSTITUTE OF DEVELOPING ECONOMIES
IDE Discussion Papers are preliminary materials circulated
to stimulate discussions and critical comments
Keywords: information technology (IT), software engineer, onsite, migrant, India,
Japan
JEL classification: J44, J61, L86, M12
* South Asia Studies Group, Area Studies Center, IDE ([email protected])
IDE DISCUSSION PAPER No. 168
Indian IT Software Engineers in Japan:
A Preliminary Analysis
Hitoshi OTA*
September 2008
Abstract
In this study, the work and life of Indian IT engineers in Japan engaged in software
development were examined through a questionnaire survey. Findings were further
supported by comparative analyses with Chinese and Korean software engineers.
While Indian IT software engineers appeared rather satisfied with their life overall in
Japan, they seemed rather dissatisfied with their work conditions including such
things as fringe benefits, the working-time management of the company, levels of
salary and bonuses, and promotion opportunities. It was made clear that profiles and
perceptions of Indian engineers and those of Chinese and Koreans in Japan were
different.
The Institute of Developing Economies (IDE) is a semigovernmental,
nonpartisan, nonprofit research institute, founded in 1958. The Institute
merged with the Japan External Trade Organization (JETRO) on July 1, 1998.
The Institute conducts basic and comprehensive studies on economic and
related affairs in all developing countries and regions, including Asia, the
Middle East, Africa, Latin America, Oceania, and Eastern Europe.
The views expressed in this publication are those of the author(s). Publication does not imply endorsement by the Institute of Developing Economies of any of the views expressed within.
INSTITUTE OF DEVELOPING ECONOMIES (IDE), JETRO 3-2-2, WAKABA,MIHAMA-KU,CHIBA-SHI
CHIBA 261-8545, JAPAN
©2008 by Institute of Developing Economies, JETRO
No part of this publication may be reproduced without the prior permission of the IDE-JETRO.
Indian IT Software Engineers in Japan: A Preliminary Analysis
Hitoshi Ota
I. INTRODUCTION
Well over a decade has passed since the Indian Information Technology (IT) industry attracted wide attention around the world, especially in developed countries, for its dynamic growth and potential. The IT industry may indeed be a symbol for the growth of the Indian economy and its globalization following economic liberalization in 1991. The active role that Indian IT firms played on a global scale in the solution of the Y2K problem has had a definite impact for its credit. The mobility of capital and labour across borders is an essential part of the globalization of an economy, and the Indian IT industry is no exception. This industry has shown dynamism and mobility in both areas, especially in mobility of labour which has been accomplished through overseas assignments of IT engineers. The business focus of the IT industry has been shifting to offshore outsourcing for the past four to five years. However, there can be no doubt that doing business onsite will continue to be very important.
Given the importance of onsite business for the IT industry, the present study concerns IT software engineers who work abroad, onsite, in client countries. Specifically, the purpose of this article is to study the work and life of Indian IT engineers who are engaged in software development in Japan by making use of a survey conducted between November 2004 and January 2005 in Japan. It is important to note that much may not be known about the work and life of Indian IT Engineers abroad. There are some studies of IT engineers working in the US on temporary visas. For example, Deve (2002) studied the lives of female Indian IT engineers on H-1B visas and those on H-4 visas who lived in the US with their husbands. Varma and Rogers (2004) described the plight of Indian IT engineers on H-1B visas. A not so rosy picture of their work and life in the US may be seen in the descriptions of Singhal and Rogers (2001, pp. 28-30). Nonetheless, the contribution of the present study may be significant since almost nothing is known regarding actual situations of Indian IT engineers working in Japan. It is also imperative to have a better understanding of issues related to working in Japan as Indo-Japan relationships not only in the IT area but in other domains as well are expected to expand in the future.
In the following section, background issues relative to the study are presented. These include: (1) the current status of Indian IT Industry, (2) the status of the IT software industry and its labour market of foreign nationals in Japan, and (3) related government policies concerning foreign workers in Japan. The work and life of Indian IT software engineers are examined in section III. Since the sample size of Indian IT software engineers is rather small (a total of 23), brief comparative analyses with Chinese and Korean counterparts are presented on some issues in order to delineate characteristics. A group
interview with five Indian software engineers was conducted in parallel with the survey. Comments from the interview as well as opinions expressed in the survey are referenced where relevant. This study primarily focuses on the IT software industry and its engineers. IT-Enable Services (ITES) and Business Process Outsourcing (BPO) industries are not considered.
II. BACKGROUND
1. Current status of the Indian IT Industry
Dahlman and Utz (2005) point out India’s strengths and advantages in Knowledge Economy, and some of these are applicable to the Indian IT sector. They are (among others): (1) a critical mass of skilled English-speaking knowledge workers, especially in the sciences, (2) a large and impressive Diaspora creating valuable knowledge linkages and networks, (3) macroeconomic stability, (4) a dynamic private sector, (5) institutions of a free market economy, (6) a well-developed financial sector, and (7) a broad and diversified science and technology infrastructure.1 According to the National Association of Software and Service Companies (NASSCOM), the Indian IT-BPO sector (including domestic and export segments) has grown an estimated 28 percent in 2007-08. As a proportion of national GDP, the aggregate revenue of the Indian technology sector has grown from 1.2 percent in 1998-99 to an estimated 5.4 percent in 2007-08. Net value-added by this sector to the economy has been estimated at 3 to 3.5 percent for 2007-08.2 Indian software and services are comprised of IT Services, BPO, engineering services including research and development (R&D), and software products. Total revenue for these services was $16.7 billion in 2004-05, $22.5 billion in 2005-06, $30.3 billion in 2006-07, and $39.5 billion in 2006-07.3 The latter was a 30.4 percent increase from the previous year (NASSCOM, 2008).
Exports are the mainstay of the Indian IT sector. The IT software industry accounts for a marginal share of India’s GDP, but the share of software services in India’s total exports in services is 38.5 percent (Reserve Bank of India, 2007, p. 90).4 Software and service revenues totaled $39.5 billion in 2006-07, and exports accounted for 72.9 percent or $31.3 billion. Revenue from IT services was $18.0 billion, and $4.9 billion came from engineering services including R&D and software products (NASSCOM, 2008).5 It is imperative to note that the delivery model of exports has shifted from onsite to offshore. In 1999-2000, 57.25 percent of the export revenue for IT software came from onsite services and 34.70 percent came from offshore services (the remaining 8.05 percent came from products and packages) (NASSCOM, 2001, p. 56). Their shares reversed in 2001. In 2002-03, 42.7 percent came from onsite and 57.3 percent from offshore.6 Considering costs and other disadvantages of onsite services (Aspray et al. eds., 2006; Balatchandirane, 2007b), the demand for offshore outsourcing is further expected to grow. Apparently, the current situation is quite different from that before the mid-1990’s (Heeks, 1996).
operations come within the scope of a business if it seeks to expand activities, and this naturally induces movement of people to other countries. Many projects require significant face-to-face interaction with customers. Despite the rapid acceleration of offshore outsourcing and (in the case of the US) recorded unemployment for (American) IT workers there, the appetite for temporary work visas such as H-1B and L-1 has continued to increase. Many functions combine both offshore and onsite delivery (Hira, 2005, pp. 212-224). Mankiw and Swagel (2006) came to a tentative conclusion that outsourcing from US firms appeared to be connected to increasing US employment and investment rather than to overall job loss. Job creation in the US may further induce onsite work. While it is plausible that shares from offshore outsourcing will increase in the IT industry’s total revenue, there will always be Indian IT engineers working onsite in client countries, and any research conducted on them will still be of great significance.
2. Japan’s IT Industry, its Labour Market for Foreign-Nationals, and its Migration Policies (1) Japan’s IT Industry and its Partners
Japan is the second largest information and communications technology (ICT) market with the US being first. According to the World Information Technology and Services Alliance (WITSA), total global ICT spending for the year 2008 has been estimated to be $3.79 trillion and that of Japan $350.5 billion. The total global computer software spending in the world is estimated at $311.1 billion, and Japan’s spending on it in 2008 is estimated to stand at $13.1 billion, which is the 6th largest in the world.7 In 2006, 567,498 people including non-engineers were working in the software industry in Japan (Government of Japan, 2007b).
The US dominates Japan’s IT market in shares of imports from foreign countries to Japan. According to a sample survey conducted jointly by three industrial associations (JISA et al., 2005) with total effective responses of 318 IT companies in Japan, the total value of IT related imports by 67 replying companies at the end of fiscal year 2004 (March 2005) was 354.6 billion Japanese yen (approximately $3.4 billion). Japan imported the most from the US with a share of 92.8 percent (total import value of 329.2 billion yen). The second largest partner to Japan was China with a share of 4.9 percent. India was in the third place with the meager share of 1.1 percent (import value at 4.0 billion yen). Year-on-year increases were 127 percent for the US and 164 percent for China. Such increases were comparatively smaller at 97 percent for India.
China is the major country for outsourcing from IT companies in Japan. With 77 replying companies, the same survey of JISA et al. (2005) showed that total outsourcing was 52.7 billion yen for the fiscal year 2004. China had the largest share with 64.0 percent and a total value of 33.2 billion yen. The US was next with a share of 9.7 percent. India was again in third place with a share of 8.2 percent (total value of 4.3 billion yen). Year-on-year increases were 126 percent for China and 103 percent for the US. They remained relatively low for India at 67 percent. When compared with the US
and China, it is clear that India is not a major partner to Japan in the IT industry.
(2) Japan’s IT Labour Market for Foreign Nationals
There are no official statistics relative to how many foreign IT engineers currently work in Japan. Thus, rough estimations must be made using various data.8 Actually, there are no official statistics regarding how many IT engineers are in Japan.9 Foreign nationals who stay in Japan for more than 90 days are required to register. According to the Immigration Bureau of Japan’s Ministry of Justice, there were 1.97 million foreigners registered at the end of 2004. The number increased to 2.15 million at the end of 2007. Of these registered foreign nationals, the qualification status for their stay in Japan considered most relevant to the onsite IT engineers were “Engineer,” “Specialist in Humanities/International Services” and “Intra-Company Transferee.”10 The actual populations and proportions for each category at the end of 2007 were 44,684 (2.1 percent) for “Engineer,” 61,763 (2.9 percent) for “Specialist in Humanities/International Services,” and 16,111 (0.7 percent) for “Intra-Company Transferee” (Government of Japan, 2008a).
Official statistics for foreign nationals who were issued the qualification status of either “Engineer” or “Specialist in Humanities/International Services” in 2006 for their stay in Japan are also available (Government of Japan, 2007a). They indicate that total numbers were 19,344 (9,954 “Engineers” and 9,390 “Specialists in Humanities/International Services”). This was an increase from 14,884 in the previous year, an increase of 30.0 percent. Chinese were highest at 4,853, and they were followed by Americans at 2,781, Koreans at 2,668, and Indians at 1,493. This was a 19.2 percent increase from the previous year for the Indian nationals. Out of 19,344, 32.4 percent or 6,274 were classified in “Information Processing”, a classification closest to the IT industry. Of these, 6,152 (98.1 percent) were “Engineers” by status. “Information Processing” composed 61.8 percent of the total “Engineer” category. These numbers do not correspond to the actual number of foreign national IT engineers, but the actual number may be estimated as a value between 25,000 (44,684 times 0.618) and 35,000 [by 106,447 (44,684+61,763) times 0.324)], and most likely less than 40,000 in 2007.
The industry survey from JISA et al. (2005) shows that out of the 318 effective responses, 119 companies (37.5 percent) employed at least one foreign national IT engineer in March 2005. The total foreign national IT engineers employed were 1,631. Of those employed, the share of Chinese was largest at 56.7 percent. They were followed by Koreans at 27.7 percent. The share of the Indian IT engineers was in third place at 5.6 percent. Year-on-year increases were 137 percent for Chinese and 128 percent for Koreans. It was 99 percent for the Indian IT engineers. It is clear that until now, the number of Indian IT engineers in Japan has been small, especially compared to Chinese and Korean counterparts. Another survey conducted in 2007 by the Information-Technology Promotion Agency, with the sample size of 357 companies (the number of the effective responses is not clear), revealed that the share of Chinese IT engineers was 69.8 percent and that of Indian engineers was 12.6 percent
(IPA, 2008).
Chinese domination in Japan’s IT industry in terms of outsourcing as well as the share of foreign national human resources working in Japan is mainly due to the proximity of the two countries. Further, many Chinese IT engineers in Japan speak Japanese. The Japanese language uses Chinese characters, and Japan’s relationship with China has a long history.
(3) Future Manpower Demand and Migration Policy
The Whitepaper of the Information Services Industry 2007 by JISA indicates that a sense of the manpower shortage is felt especially in the areas and/or specialties of IT architecture, consultancy, product management, high-level (highly-skilled) IT specialization, and in embedded software and operation systems (JISA, 2007). The older generation of the Japanese IT software engineers who use COBOL, one of the oldest programming languages, are said to retire around 2007, and this may have accelerated the manpower shortage in the IT engineer labour market in Japan (Kojima, 2004, pp. 212-213). The President of Tata Consultancy Services (TCS) Japan, also pointed out in an interview that the sense of manpower shortage is felt to be especially strong in the area of embedded software (JILPT, 2006).11 A survey was conducted on the embedded software industry in Japan due to high interest of the Ministry of Economy, Trade and Industry (METI) between November 2007 and January 2008, with effective responses from 317 establishments (291 companies). This survey revealed that there are currently 242,000 embedded software engineers in Japan with a further 88,000 required, the rate of vacancy being 36.4 percent. “Software” is the area where manpower shortage appears highest (Government of Japan, 2008b). Some observe that it may not be difficult for Indian companies to enter the embedded software market in Japan especially because of this shortage of highly-skilled engineers (Muniratnam, 2006, p. 346). In any case, the demand for foreign national IT engineers in Japan may be assumed to be high in the above mentioned areas where manpower shortages are observed.
With this connection, the migration policy of the Japanese government related to IT engineers may be observed. In the 9th Basic Employment Measures Plan approved in August 1999 by the Cabinet, the Japanese government showed the nation’s basic approach to the acceptance of foreign workers and its intention to accept them in specialized/professional or technical fields (Ohmi, 2005). The Strategic Headquarters for the Promotion of an Advanced Information and Telecommunications Network Society (IT Strategic Headquarters) was established within the Cabinet in January 2001 in order to promote measures for forming an advanced information and telecommunications network society expeditiously and intensively. In March 2001, it drew up the “e-Japan Priority Policy Program”. According to the program, the Immigration Bureau was to identify problems in the present immigration control system such as the landing permission criteria applicable to IT engineers and also to take necessary action to secure high-quality technical professionals and experts in Japanese society by further accepting IT engineers and other technical experts from foreign countries (Government of
Japan, 2007c, p. 70).
In March 2000, the Ministry of Justice formulated the Basic Plan for Immigration Control (2nd edition). In accordance with this policy and with a view to responding to the need for more IT engineers, the Ministerial Ordinance on the Criteria for the Status of Residence of “Engineer” was partially amended in December 2001 to ease the standards for accepting IT engineers from abroad. Specifically, foreign nationals who have passed foreign examinations or obtained qualifications on information processing skills which are mutually certified by Japanese IT-related examinations or qualifications and are designated by the Minister of Justice in the Official Gazette, may enter Japan irrespective of whether or not they satisfy the criteria for landing permission regarding the status of “Engineer” (having graduated from or completed a course at a college or acquired equivalent education or having at least 10 years of work experience). These foreign examinations and qualifications are those implemented and granted in Singapore, South Korea, China, the Philippines, and Viet Nam as of March 2008. The Three-Year Program for Promoting Regulatory Reform formulated in June 2007 also states that the government will review the system relating to the acceptance of foreign nationals, including the criteria for landing permission for IT engineers, and continue to take necessary measures (Government of Japan, 2007c, p 70).
It should also be added that the Japanese government is not reluctant, at least in its official stance, to strengthen relationships with India in IT related businesses. The New Global Partnership for the 21st Century between Japan and India was unveiled when then Prime Minister Mori visited India in August 2000, and IT was set as one of the pillars for cooperation and promotion between the two countries. Some initiatives of this “partnership” have already started.
III. WORK AND LIFE OF INDIAN IT ENGINEERS IN JAPAN
In this section, the survey method and limitations to the study are discussed. This is followed by a presentation of survey results on the work and life of Indian IT software engineers in Japan.
1. Survey Method
Data for analysis came from a questionnaire mail survey which was conducted between November 2004 and January 2005 by the Institute for Research in Contemporary Political and Economic Affairs affiliated with Waseda University, Japan. The survey was designed to provide basic and objective information regarding the work and life of foreign national IT software engineers. It was conducted for policy making in such areas as the economy, industry, labour, social security, and population. The questionnaire mail survey was used since it could cover more of the target populations under consideration than interviews. Too, only a rather a short period of time was allowed to complete the survey.
(1) the population of the foreign national IT software engineers working in Japan was not clear and (2) it was not known where these engineers worked (Shiraki, 2005). Therefore, after a pilot survey, members of the research project requested that industrial associations and companies distribute the questionnaire to foreign national IT engineers who worked for them. In addition, each member was asked to request acquaintances (personal or otherwise) to cooperate in the survey. All questionnaires were directly returned by post. In several cases, the questionnaire was filled out and returned by e-mail. More than 90 percent of all respondents (more than 85 percent of Indian respondents) resided in Tokyo and the metropolitan areas of Saitama, Kanagawa, and Chiba.
The number of foreign national IT engineers in Japan at the time of the survey was estimated to be between 6,000 and 10,000. The sample size included all nationalities and totaled 203. This constituted two to three percent of the target population (Shiraki, 2005). The size of the sub-sample of Indian respondents was 23. However, the proportion of Indian respondents was not significantly different from the survey conducted by IPA (2008) and even larger than the proportion obtained by JISA et al (2005). The proportion of Chinese respondents was also similar to the proportion in these two surveys. The present research was the first of its kind in Japan that tried to assess the work and life of foreign national IT engineers inclusively (Shiraki, 2005).12 Though there may be certain limitations in interpretation, results are nonetheless quite valuable given time, budget, and other constraints.
2. Profile of Respondents
Table 1 shows profiles of the respondents. All Indian respondents were male, and their average age was 31.0 years. 69.6 percent out of 23 Indian engineers had a bachelor’s degree while the rest had a master’s degree. In contrast to Chinese and Korean counterparts, 91.3 percent had a computer related educational background. Only one Indian software engineer had DOEACC level qualification. The high educational profile of Indian IT engineers is similar to Indians working in the US.13
Table 1 Characteristics of respondents SD below University/ College University/ College degree Master's degree Ph.D./ Doctorate Indians 23 (11.3%) 100.0% - 31.0 4.1 - 69.6% 30.4% -Chinese 144 (70.9%) 76.4% 23.6% 28.7 5.1 2.8% 75.0% 20.8% 1.4% Koreans 20 (9.9%) 100.0% - 34.7 4.4 5.0% 65.0% 25.0% 5.0% Others 16 (7.9%) 87.5% 12.5% 34.4 9.3 - 43.8% 50.0% 6.3% All 203(100.0%) 82.3% 17.7% 30.0 5.8 2.5% 70.9% 24.6% 2.0% Computer related science Science (computer unrelated) Humanities/ Social Sciences Others Norspns. Indians 91.3% 4.3% - 4.3% -Chinese 68.1% 18.1% 9.7% 3.5% 0.7% Koreans 25.0% 55.0% 20.0% - -Others 56.3% 31.3% 6.3% 6.3% -All 65.5% 21.2% 9.4% 3.4% 0.5%
Source) Survey conducted by author's research group. Note) -: 0%
Specialization in final educational attainment
Educational background (total: 100%) N (%) Male (%) Female (%) Av. Age(years)
One engineer (4.3 percent) was married living separately from spouse, and 11 (47.8 percent) were married living with spouse. 43.5 percent of the Indian IT software engineers were not married. Six Indian engineers out of 12 who were married had children, and the average number of children was 2.0. 43.5 percent or 10 out of 23 Indian engineers lived in company-sponsored housing, while 17.4 percent lived in a rented house or a room subsidized by the company. 39.1 percent of Indians lived in a rented house or room but without company subsidy. Thus, more than 60 percent of Indian software engineers lived in a place where the company sponsors or offers subsidy in some way.
Table 2 shows ability in the Japanese language. 21.7 percent or five out of 23 Indian software engineers did not speak Japanese at all; 21.7 percent spoke Japanese, but not well. This contrasts sharply with Chinese and Koreans who spoke Japanese fluently or quite well (65 and 75 respectively). Some respondents (see Appendix) and interviewees expressed that they had difficulty with the Japanese language. This will be discussed later.
Table 2 Ability in Japanese language Not at
all Not well
Enough for daily life Well
Completely fluent No rspns. Total Indians 21.7% 21.7% 30.4% 21.7% 4.3% - 100.0% (n=23) Chinese 2.1% 6.3% 27.1% 34.0% 29.9% 0.7% 100.0% (n=144) Koreans - - 25.0% 50.0% 25.0% - 100.0% (n=20) Others - 18.8% 6.3% 37.5% 37.5% - 100.0% (n=16) Total 3.9% 8.4% 25.6% 34.5% 27.1% 0.5% 100.0% (n=203)
Source) Survey conducted by author's research group. Note) -: 0%
With regard to the status of visas, 73.9 percent of Indian IT software engineers (17) had “Engineer” status; while 8.7 percent (2) were considered “Intra-Company Transferees.” 8.7 percent were “Permanent Residents.” The number of engineers with the status of “Engineer” was also high for Chinese and Korean counterparts.
The average total stay in Japan for the Indian software engineers was 3.59 years; it was 4.69 and 5.60 years respectively for Chinese and Koreans (see Table 3-(1)-(B)). In this sense, Indian IT software engineers were relatively newcomers when compared to Chinese and Korean counterparts. But do they intend to stay longer in Japan? Some indicated that wherever they go, most IT Indians tend to move to non-English-speaking industrialized countries with a clear plan to move out soon.14 Some in the parallel interview stated that their maximum stay in Japan would be about 3 years. In the survey, there were six Indian software engineers (26.1 percent) with a temporary visa who replied that they intend to live in Japan permanently. 60.9 percent (14 engineers including the above mentioned two persons on permanent visa status) said that they intend to go back to India. The remaining two persons replied that they were not sure, and one engineer said that he intends to go some other country.
3. Careers and Peripheries
Table 3 presents several indices regarding the career of Indian IT engineers. Out of the 3.59 average years of stay in Japan, Indian IT software engineers have worked an average of 3.55 years (99.1 percent) of the period (Tables 3-(1)-(C) and (2)-(E)). They mainly come to Japan for their job. Chinese and Koreans may not necessarily do so; some may came to Japan for study. Statistically, the proportion of the work career in Japan relative to the entire work career for Indian software engineers and those of Chinese and Koreans are significantly different (Table 3-(2)-(F)). Indian IT software engineers have worked outside of Japan longer; Chinese and Koreans have not. Unlike Indians, some Chinese and Koreans come to Japan first to study and then to seek a job after graduation instead of going back to their respective countries.15
The length of the work career for the Indian software engineers was 8.59 years on average, and this is longer than Chinese and Korean counterparts. As indicated in Table 3-(2)-(G), Indians have spent most all of their career in software development, and this proportion is higher than that of Chinese and Koreans.16 Incidentally, five out of 23 Indian engineers (21.7 percent) had worked for more than three months in countries other than India and Japan.
Table 3 Work career of software engineers (length (1) and proportion (2)) (1) Length (years)
Mean N SD Mean N SD Mean N SD Mean N SD
Indians 8.59 22 3.95 3.59 22 3.40 3.55 22 3.39 7.86 22 4.31 Chinese 5.11 141 4.59 4.69 140 3.91 3.28 141 2.86 4.15 139 4.04 Koreans 6.42 19 4.65 5.60 20 3.78 4.10 20 3.58 4.68 19 3.32 Others 10.69 16 10.77 8.81 16 6.49 5.19 16 4.65 6.69 16 6.84 All 6.07 198 5.53 4.99 198 4.26 3.54 199 3.19 4.83 196 4.45 (2) Proportion (%)
Mean N SD Mean N SD Mean N SD
99.1% 22 0.04 37.9% 21 0.25 92.7% 22 0.23
81.1% 137 0.31 72.6% 139 0.32 82.1% 138 0.32
80.3% 20 0.31 69.9% 19 0.24 77.4% 19 0.20
69.5% 16 0.38 74.2% 16 0.35 57.6% 16 0.41
82.1% 195 0.30 68.7% 195 0.33 80.8% 195 0.31
Source) Survey conducted by author's research group.
Note) 1. Proportions were first worked out for each engineer, and then means were calculated. 2. To assess statistical differences, one-way ANOVA s with Bonferroni tests were conducted. Results are as follows:
3. There are no statistical differences between Chinese and Koreans for any of the above items. *** Differences between Indians and Chinese as well as between Indians and Koreans were statistically significant at the .01 level of confidence for "(F) proportion of work career in Japan to entire work career."
** The difference between Indians and Chinese was statistically significant at the .01 level of confidence for "(D) length of career engaged in software development."
(B) Total length of stay in Japan (years)
Indians
* The difference between Indians and Chinese was statistically significant at the .05 level of confidence for "(A) total length of work career."
(D) Length of career engaged in software development (years) **
(G) Proportion of career of software development to entire work career (=(D)/(A))
All Others Koreans Chinese (A) Total length of work career (years) *
(C) Total length of work career in Japan (years)
(F) Proportion of work career in Japan to entire work career (=(C)/(A)) *** (E) Proportion of work
career in Japan to total length of stay in Japan (=(C)/(B))
Table 4 shows the current job position or title, or a designation most appropriately reflecting current job status. Skill levels of Indian software engineers seem to be higher than those of Chinese and Korean counterparts. While 39.1 percent (nine out of 23) of surveyed Indian engineers were system engineers, 21.7 percent were consultants and 17.4 percent were senior programmers. Proportions of Chinese and Korean engineers at the entry level were relatively high.
Table 4 Current position/job title
Consultant Entry levelprogrammer SeniorprogrammerSystemsengineer
Group leader of systems development/ software development Software technical marketing staff (Sales engineer) Operator/ Systems operator Indians 21.7% 4.3% 17.4% 39.1% 17.4% - -Chinese 0.7% 26.4% 11.1% 36.8% 11.8% 3.5% 1.4% Koreans - 30.0% - 40.0% 15.0% 5.0% -Others 12.5% 6.3% - 37.5% 25.0% 6.3% -All 3.9% 22.7% 9.9% 37.4% 13.8% 3.4% 1.0% Head of department Employer (including self-employed) Others No rspns. Total Indians - - - - 100.0% (n=23) Chinese 2.1% 0.7% 4.2% 1.4% 100.0% (n=144) Koreans - 10.0% - - 100.0% (n=20) Others 6.3% - 6.3% - 100.0% (n=16) All 2.0% 1.5% 3.4% 1.0% 100.0% (n=203)
Source) Survey conducted by author's research group. Note) 1. -: 0%
2. Respondents were asked to indicate what most appropriately reflects their current circumstances and/or status.
Relative to the experience of shifting companies in Japan, six out of 23 (26.1 percent) Indian software engineers had changed companies (one person did not give an answer), while proportions for Chinese and Korean counterparts were 27.1 and 25.0 percent respectively. Indian engineers changed companies an average of 2.50 times (n=6, sd=1.22). Chinese and Koreans engineers changed companies an average of 1.77 (n=39, sd=0.81) and 1.40 (n=5, sd=0.55) respectively. To the question whether they would like to continue working for the present company, five out of 23 Indian software engineers (21.7 percent) responded that they would like to do so as long as possible, while 39.1 percent said they would like to but not necessarily so emphatically. One person (4.3 percent) replied that he would like to change companies as soon as possible, and 13.0 percent said they would like to change but not necessarily so quickly.
It is interesting to note in Table 5 what software engineers feel most committed to among the six choices. Eight out of 23 (34.8 percent) Indian IT software engineers indicated they felt most committed to their job as software-developer or software engineer. This proportion was relatively high compared to Chinese and Korean counterparts. An interesting contrast is that while 26.1 percent of Indians felt most committed to the company where they are currently employed, it was 65.0 percent for Korean counterparts. In general, Koreans seem committed to their company. In fact, 45.0 percent replied that they would like to continue working at their current company as long as possible. 40.0 percent said that they would like to do so but somewhat less emphatically.
Table 5 What software engineers feel most committed to The company where they are employed The department they belong to Their direct superior Their seniors and colleagues The work team (group) they belong to Their job as a software-developer/ software engineer No rspns. Total Indians 26.1% - - 21.7% 17.4% 34.8% - 100.0% (n=23) Chinese 23.6% 9.0% 9.7% 13.2% 23.6% 17.4% 3.5% 100.0% (n=144) Koreans 65.0% 5.0% - 10.0% 10.0% - 10.0% 100.0% (n=20) Others 31.3% 12.5% 18.8% 12.5% 6.3% 18.8% - 100.0% (n=16) All 28.6% 7.9% 8.4% 13.8% 20.2% 17.7% 3.4% 100.0% (n=203)
Source) Survey conducted by author's research group. Note) -: 0%
Respondents were asked up to what age they think they would be able to continue to work as a software engineer, supposing that there was not any incident that would prevent them from doing so against their will. Six out of 23 Indian software engineers (26.1 percent) responded that they would be able to work as long as they want to, thinking that there is no upper age limit for them as a software engineer. Seven engineers (30.4 percent) replied that they would not be able to do so for long. For these seven engineers, the average age limit as a software engineers was 47.9 years old (n=7, sd=7.0).17 Reasons given for not being able to work beyond this age included “psychological factors” (e.g. unable to concentrate) and being “too busy undertaking tasks other than software development” (e.g. meetings, coordinating duties among different departments, attending to customers, and making budget plans etc.). Two individuals gave “physical factors” as a reason. Reasons of being “less motivated to challenge new themes/projects,” being “unable to keep pace with rapid technological innovation” and being “too busy dealing with administrative duties” were given by one person each. Two respondents indicated “other”. One interviewee mentioned that the reason for not being able to continue might have more to do with mental rather than physical strength. It should be added that as engineers move up their career ladder, their preference may shift toward management.
4. Current Work and Work Conditions
Table 6 shows the employment size of companies where software engineers currently work. Koreans seem to work at small companies. The average length of service at the current company for Indian software engineers was 3.04 years (n=23, sd=1.69), 2.45 years for Chinese (n=141, sd=1.81), and 2.80 years for Koreans (n=20, sd=1.36).
Table 6 Employment size of company where software engineers currently work
up to 9 10-29 30-49 50-99 100-299 300-499 500-999 1000-2999 3000 andabove rspns.No Total
Indians - 17.4% 13.0% 8.7% 26.1% 4.3% 4.3% 8.7% 17.4% - 100.0% (n=23)
Chinese 4.2% 16.0% 16.7% 3.5% 13.9% 1.4% 2.8% 9.7% 31.3% 0.7% 100.0% (n=144)
Koreans 20.0% 30.0% 30.0% 10.0% - 5.0% - 5.0% - - 100.0% (n=20)
Others - 12.5% - - 12.5% - 25.0% 6.3% 43.8% - 100.0% (n=16)
All 4.9% 17.2% 16.3% 4.4% 13.8% 2.0% 4.4% 8.9% 27.6% 0.5% 100.0% (n=203)
Source) Survey conducted by author's research group. Note) -: 0%
Table 7 presents the methods/modes through which respondents found a job at their current company. These appear quite different among Indians, Chinese, and Koreans. For Indian software engineers, nine out of 23 engineers (39.1 percent) found their job through friends, while 30.4 percent found it through an advertisement in a newspaper or magazine. The situation is not much different from what Vijayabaskar et al. (2001, pp. 46-47) describe in their study of India. They indicate that the overall picture of modes of recruitment in the IT industry in India reveal a dominance of campus interviews and advertisements. However, there were differences across firm size and type, and they add that employee referrals were also important. It appears that the Internet homepage of the company was not very important for Indian software engineers in Japan. In contrast, 36.8 percent of the Chinese software engineers found their job through the school they attended. Another sharp contrast is with Koreans. While 45.0 percent found their job through friends (just as did the Indians), eight out of 20 Korean engineers (40.0 percent) did so through the company’s Internet homepage.
Table 7 Method of finding the job at the current company
Through friends Through the school attended Through an advertisement in a newspaper/ magazine The Internet Homepage of the current company Through a recruitment agency Through a public employment service Others No rspns. Total Indians 39.1% 8.7% 30.4% - 13.0% - 8.7% - 100.0% (n=23) Chinese 24.3% 36.8% 4.9% 11.1% 9.0% 2.1% 9.7% 2.1% 100.0% (n=144) Koreans 45.0% - - 40.0% 10.0% - 5.0% - 100.0% (n=20) Others 37.5% 12.5% 6.3% 6.3% 12.5% 6.3% 18.8% - 100.0% (n=16) All 29.1% 28.1% 7.4% 12.3% 9.9% 2.0% 9.9% 1.5% 100.0% (n=203)
Source) Survey conducted by author's research group. Note) -: 0%
As to where they joined their current company, 73.9 percent (17 out of 23) Indian software engineers joined their current company in India, while 26.1 percent joined while in Japan. 30.6 percent of Chinese joined the company in China, and 15.0 percent of Koreans in their home country. Both are in sharp contrast to Indians. 39.1 percent of Indian engineers work for companies that were established
in India, while 52.2 percent work for those established in Japan.
Regarding the type of employment contract, 87.0 percent of Indian engineers (20 out of 23), 71.5 percent of Chinese, and 80.0 percent of Koreans were found to be regular employees. Proportions of Indians and Chinese are almost the same as those found in other research. The proportion of permanent employees in the study of Abraham and Sharma (2005) in India was 92.7 percent, while the proportion of the regular employees in the study of Wang (2005) on Chinese IT workers in Japan was 68 percent. The remaining 13.0 percent of Indian employees were found to be contract employees with fixed terms of employment. Incidentally, two Korean respondents were either employers or self-employed.
As shown in Table 8, places where individuals currently work are somewhat different between Indian engineers and their counterparts. The proportion of Indian engineers who worked at another company as a contractor was higher (six out of 23 or 26.1 percent) than Chinese and Koreans. As a contractor is responsible for many aspects of the delivery of work and services, this may be further proof that skill levels of Indian engineers in Japan are in general higher than Chinese and Korean counterparts (Umezawa, 2005).
Table 8 Place where software engineers currently work At the company where they currently employed (including self-employed) At another company, having been dispatched from the company where currently employed At another company as a contractor Others Total Indians 43.5% 30.4% 26.1% - 100.0% (n=23) Chinese 50.7% 41.0% 7.6% 0.7% 100.0% (n=144) Koreans 60.0% 35.0% 5.0% - 100.0% (n=20) Others 87.5% 6.3% 6.3% - 100.0% (n=16) All 53.7% 36.5% 9.4% 0.5% 100.0% (n=203)
Source) Survey conducted by author's research group. Note) -: 0%
Table 9 shows the distribution of annual salary before tax deductions. 26.1 percent of the Indian IT Software engineers (30.0 percent of valid responses) made between 2 and 2.99 million Japanese yen, while 21.7 percent made between 3 and 3.99 million yen. From the table, it appears that Koreans are the most affluent in terms of annual salary. In fact, when the mean salary was calculated for valid responses by taking the mean value for each category (e.g. 1.5 million yen for “between 1.00 and 1.99 million yen”), it was found to be 4.60 million yen for Indian software engineers (n=20, sd=3.23 million: approximately $44,000), 3.78 million yen for Chinese (n=143, sd=1.67 million), and 4.87 million yen for Koreans (n=19, sd=1.30 million). The difference between Indians and Koreans was not
large, but it should be noted that one Indian engineer makes between 11.00 and 11.99 million yen annually, and the standard deviation is much smaller for Koreans. Incidentally, according to JISA (2005), the simple average of the annual income of 30 year old employees working at the 387 companies surveyed in Japan was 4.33 million yen (overtime pay not included) in 2004.
Table 9 Distribution of Annual Salary before Tax Deductions (Japanese yen) Less than \ 1 million \ 1.00 ‒ 1.99 million \ 2.00 ‒ 2.99 million \ 3.00 ‒ 3.99 million \ 4.00 ‒ 4.99 million \ 5.00 ‒ 5.99 million \ 6.00 ‒ 6.99 million Indians - 13.0% 26.1% 21.7% - - -Chinese 1.4% 10.4% 20.8% 28.5% 19.4% 10.4% 4.2% Koreans - - 10.0% 5.0% 45.0% 15.0% 15.0% Others - - 6.3% 18.8% 6.3% 6.3% 18.8% All 1.0% 8.9% 19.2% 24.6% 18.7% 9.4% 5.9% \ 7.00 ‒ 7.99 million \ 8.00 ‒ 8.99 million \ 9.00 ‒ 9.99 million \ 10.00 ‒ 10.99 million \ 11.00 ‒ 11.99 million More than \ 12 Million No rspns. Total Indians 8.7% - 13.0% - 4.3% - 13.0% 100.0% (n=23) Chinese 1.4% 2.1% - 0.7% - - 0.7% 100.0% (n=144) Koreans 5.0% - - - 5.0% 100.0% (n=20) Others 12.5% 6.3% 6.3% 6.3% 6.3% 6.3% - 100.0% (n=16) All 3.4% 2.0% 2.0% 1.0% 1.0% 0.5% 2.5% 100.0% (n=203)
Source) Survey conducted by author's research group. Note) 1. US$ 1=JP\ 104.2 as of Dec.31, 2004
2. -: 0%
Software engineers were asked if they were covered by any health/medical insurance. Table 10 shows that 43.5 percent or 10 out of 23 Indian IT software engineers had health insurance either through the company’s Health Insurance Society or Government-managed Health Insurance. 30.4 percent had National (Japanese) Health Insurance run by the local municipality. It is assumed that those working on their own account, working with small companies, or those who were not employed would join this system. It should be noted that 17.4 percent did not have any health insurance. Differences observed among nationalities are interesting.
Table 10 Health/Medical Insurance (multiple answer) Health insurance such as that of the company s Health Insurance Society or of Government-managed Health Insurance National (Japanese ) Health Insurance Traveler's accident insurance Private health insurance in Japan, for the payment of excess charges Public health (medical) insurance from their native country Private health (medical) insurance from their native country. Others Not covered by any health insurance N Indians 43.5% 30.4% 4.3% - - 4.3% - 17.4% 23 Chinese 74.3% 8.3% 5.6% 3.5% 7.6% 5.6% 0.7% 11.1% 144 Koreans 55.0% 25.0% - - 5.0% 20.0% - 20.0% 20 Others 87.5% 12.5% 6.3% - 12.5% - - - 16 All 70.0% 12.8% 4.9% 2.5% 6.9% 6.4% 0.5% 11.8% 203
Source) Survey conducted by author's research group. Note) -: 0%
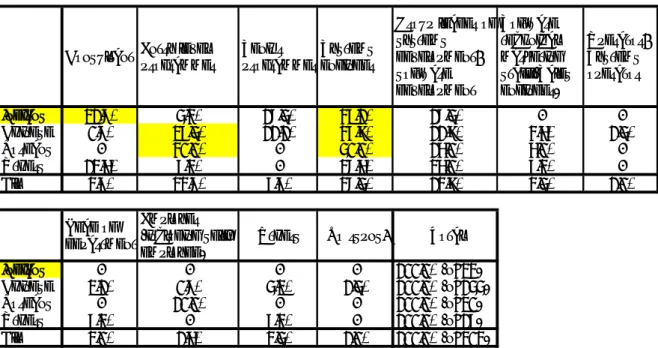
Table 11 summarizes the level of overall satisfaction with work and 13 other items. Respondents were asked to evaluate their level of satisfaction on a 5-point Likert scale, 1 being strongly dissatisfied and 5 strongly satisfied. Mean scores were calculated on each item for the three nationalities using only valid responses. Rank was assigned based on mean scores of Indian IT software engineers.18 To see characteristics of Indian software engineers, comparisons with the other two nationalities, especially Chinese, were deemed to be useful. However, differences between Indians and Chinese were statistically significant only for one item, “job/work content.”
Overall, Indian IT software engineers appear more satisfied than their Chinese counterparts. For job/work content, Indian responses indicated that they were more satisfied than the Chinese, and this difference was statistically significant. Indian software engineers seemed rather satisfied with their communication with seniors and colleagues as well as with end users and customers compared to Chinese and Koreans, but they were somewhat less satisfied with the communication they have with those of other nationalities such as the Japanese. In interview responses as well as comments written in the questionnaire survey (see comments 2, 5, 7, and 12 in Appendix), language and communication with Japanese were seen as difficult and/or a problem for many Indian IT software engineers in Japan. An assessment was made to determine whether or not there was any difference in satisfaction regarding communication between Indian respondents who speak Japanese and those who do not.19 The size of the Indian sub-sample is small, and the only difference in level of satisfaction with communication involving those of other nationalities such as Japanese was statistically significant at the .05 level (scores are 3.62 (n=13, sd=0.96) for Japanese speakers and 2.63 (n=9, sd=0.74) for non-speakers). Differences in communication with seniors and colleagues, as well as with end users and customers were not significant. It is interesting that one respondent in the parallel interview said that language might be a problem for him, but that communication with Japanese clients was not as he
had confidence in his professional knowledge. It should also be added that Japanese clients usually speak English to a certain extent.
Table 11 Level of satisfaction with work in Japan
Mean Score N SD Mean Score N SD
Indians 3.95 22 0.72 Indians 3.00 22 1.02 Chinese 3.18 142 1.01 Chinese 2.76 139 1.03 Koreans 3.75 20 0.72 Koreans 3.25 20 1.02 All 3.36 200 1.00 All 2.86 197 1.05 Indians 3.71 21 0.78 Indians 2.91 22 0.92 Chinese 3.48 141 0.87 Chinese 2.79 140 0.99 Koreans 3.79 19 0.85 Koreans 3.60 20 0.88 All 3.55 196 0.87 All 2.90 198 1.03 Indians 3.41 22 0.91 Indians 2.86 22 1.04 Chinese 3.02 142 0.96 Chinese 2.71 142 1.06 Koreans 3.15 20 0.99 Koreans 3.35 20 0.99 All 3.12 200 0.96 All 2.83 200 1.05 Indians 3.41 22 1.01 Indians 2.77 22 0.97 Chinese 3.19 142 0.98 Chinese 2.88 142 1.15 Koreans 3.15 20 1.14 Koreans 2.90 20 0.97 All 3.24 200 1.03 All 2.88 200 1.12 Indians 3.38 21 0.92 Indians 2.73 22 0.88 Chinese 2.91 141 1.04 Chinese 3.08 141 1.16 Koreans 3.35 20 1.14 Koreans 3.20 20 1.15 All 3.06 198 1.06 All 3.07 199 1.14 Indians 3.32 22 0.99 Indians 2.55 22 0.96 Chinese 3.08 142 0.98 Chinese 2.82 141 1.10 Koreans 3.70 20 0.92 Koreans 3.00 20 1.17 All 3.18 200 1.01 All 2.85 199 1.09 Indians 3.24 21 1.00 Indians 3.36 22 0.85 Chinese 3.47 142 0.96 Chinese 3.08 142 0.92 Koreans 3.68 19 0.82 Koreans 3.55 20 0.83 All 3.49 198 0.97 All 3.18 200 0.91
Source) Survey conducted by author's research group.
Note) 1. Mean scores were calculated for level of satisfaction which was rated on a 5-point Likert scale (1=strongly dissatisfied to 5=strongly satisfied).
2. Numbers (1 through 13) represent rank based on the Indian engineers' mean scores.
3. To assess statistical differences, one-way ANOVA s with Bonferroni tests were conducted. "1. Job/work cont "5. Delegation of authority in work," "9. Promotion Opportunities," and "10. Salary, bonuses" were statisticall significant at the .05 level of confidence by one-way ANOVA test.
* The difference between Indians and Chinese was statistically significant at the .05 level of confidence for "1. Job/work content."
** The difference between Chinese and Koreans was statistically significant at the .05 level of confidence for "9. Promotion opportunities."
Overall satisfaction of
work
7. Communication with those of other nationalities, such as Japanese
13. Fringe benefits 3. Communication
with users and customers 11. Length of working time 10. Salary, bonuses 1. Job/work content* 5. Delegation of authority in work 6. Fairness of personnel appraisal (system) 12. Freedom as to when to work 3. Opportunities for skill development 8. Career path designed by company 9. Promotion opportunities ** 2. Communication
with seniors and colleagues
Indian software engineers seem dissatisfied with their work conditions. Satisfaction with fringe benefits is quite low. Satisfaction levels with salary and bonuses as well as with promotion opportunities are also rather low. For the Indians, all mean scores for these three items were below 3.0. In this sense, Korean counterparts seem more satisfied with their work conditions than Indians.
In parallel interview and in comments given in the questionnaire, Indian software engineers also indicated dissatisfaction with working time and/or its management at the companies where they worked. They especially wondered why Japanese work long hours (see comments 1, 3, 7, and 10 in Appendix).20 Table 11 indeed shows that Indian software engineers are rather dissatisfied with working time management of the company.
Finally, it should be added that the satisfaction level of Indian software engineers for opportunities related to development of skills is relatively high when compared to Chinese and Korean counterparts.
5. Life in Japan
This sub-section includes assessment of how IT software engineers perceive their life in Japan by determining to what extent they are adjusted as well as whether or not they are satisfied.
Table 12 shows the degree of adjustment. There is no statistically significant difference among the three nationalities for any item. Even though the mean score for adjustment to life in Japan in general for the Indian software engineers was slightly lower than the others, these engineers seem adjusted to their current situation, at least to a certain extent. Indians appear rather well adjusted to the standard and quality of life, shopping (how to shop, etc.) and to commuting. Though the difference is not statistically significant, the degree of adjustment for commuting among Indians was also relatively high compared to Chinese and Koreans. The adjustment score for food for the Indian engineers was somewhat low compared to the others.
Table 12 Degree of adjustment to life in Japan
Mean Score N SD Mean Score N SD
Indians 4.09 23 0.79 Indians 3.39 23 1.23 Chinese 3.68 142 0.93 Chinese 3.51 142 0.94 Koreans 3.55 20 0.76 Koreans 3.60 20 0.88 All 3.74 201 0.91 All 3.51 201 1.00 Indians 3.95 22 0.84 Indians 3.26 23 0.96 Chinese 4.08 142 0.73 Chinese 3.60 142 0.88 Koreans 3.95 20 0.39 Koreans 3.70 20 0.57 All 4.08 200 0.74 All 3.58 201 0.91 Indians 3.91 23 1.04 Indians 3.26 23 1.01 Chinese 3.58 142 1.01 Chinese 3.13 141 0.86 Koreans 3.25 20 0.79 Koreans 3.10 20 0.55 All 3.61 201 0.99 All 3.18 199 0.88 Indians 3.65 23 0.83 Indians 3.22 23 1.20 Chinese 3.44 141 0.94 Chinese 3.54 141 0.87 Koreans 3.45 20 0.76 Koreans 3.35 20 0.59 All 3.49 200 0.92 All 3.52 200 0.96 Indians 3.43 23 1.24 Indians 3.17 23 1.03 Chinese 3.57 141 0.93 Chinese 3.30 142 0.90 Koreans 3.70 20 0.57 Koreans 3.30 20 0.66 All 3.61 200 0.98 All 3.32 201 0.92 Indians 3.70 23 0.88 Chinese 3.73 142 0.69 Koreans 3.84 19 0.37 All 3.76 199 0.71
Source) Survey conducted by author's research group.
Note) 1. Mean scores were calculated for degree of adjustment which was rated on a 5-point Likert scale (1=not at all adjusted to 5=very well adjusted).
2. Numbers (1 through 10) represent rank based on the Indian engineers' mean scores.
3. To assess statistical differences, one-way ANOVA s with Bonferroni tests were conducted. No item was found statistically significant.
1. Standard and quality of life 6. Health care facilities 3. Commuting Life in Japan in general 4. Housing conditions 7. Japanese society and customs 8. Interacting with Japanese people in general 10. Interacting with Japanese colleagues outside of work 9. Conversations with Japanese people on a daily basis 5. Food 2. Shopping
Even though mean scores were above 3.0, Indian IT software engineers appear less well-adjusted to Japanese society and customs than do Chinese and Korean counterparts. Presumably, this is due to cultural differences. One of the respondents in the parallel interview said that it had taken some time for him to adjust to life in Japan because customs were different in Japan and India. However, he further indicated that once he got used to it, life in Japan became very easy. Scores for adjustment related to conversing with Japanese people on a daily basis and interacting with Japanese colleagues outside of work were also lower than those of Chinese and Korean counterparts. It is interesting, however, that scores related to interacting with Japanese people in general were relatively higher for the Indian software engineers than for the Chinese or Koreans.
There were significant differences between Indians who speak Japanese and those who do not on perceptions of Japanese society and customs (p<.01) and conversing with Japanese people on a daily basis (p<.05). Those who speak Japanese appear to be better adjusted to Japanese society and customs and to conversing with Japanese than those who do not.
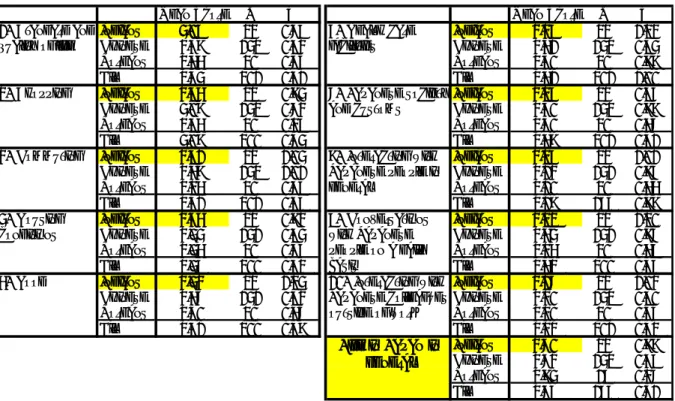
Let us examine if they are satisfied with their life in Japan from Table 13. Statistical significance may be observed only for one item, “child education.” Indian IT software engineers appear rather satisfied with their life overall in Japan. Mean scores for satisfaction with safety (4.39) as well as living convenience (4.32) were quite high. This was supported by comments in the questionnaire (5 and 8 in Appendix). They appear relatively satisfied with commuting time and method compared to their counterparts, and this is consistent with the degree of adjustment regarding commuting observed above. Satisfaction with housing also seems consistent, but the parallel interview revealed that some felt the cost of rent was too high for the size of housing.
Indian software engineers are relatively less satisfied with the medical environment when compared to Chinese and Korean counterparts. This is consistent with the adjustment observed in Table 12. Reasons, among others, include both cost and the language problem (see comments 4 and 9 in Appendix). Food is another area of difficulty for Indians living in Japan. Indian software engineers appear less satisfied with food than do Chinese or Koreans. In fact, the difficulty and dissatisfaction in adjusting to food in Japan were seen in comments to the questionnaire (see comments 2, 7 and 8 in Appendix) and the parallel interview. It may be especially difficult for pure vegetarians. Here, it is interesting to see that the difference in satisfaction regarding food is statistically significant at the .05 level between Indian engineers who speak Japanese (3.54, n=13, sd=0.97) and those who do not (2.60, n=10, sd=0.97). This is an interesting finding, and it may be an indication that understanding the local language alleviates the food problem to a certain degree.
Table 13 Level of satisfaction with life in Japan
Mean Score N SD Mean Score N SD
Indians 4.39 23 0.66 Indians 3.26 23 1.21 Chinese 4.10 143 0.89 Chinese 3.61 143 0.84 Koreans 4.00 20 0.65 Koreans 3.65 20 0.93 All 4.11 202 0.87 All 3.57 202 0.92 Indians 4.32 22 0.72 Indians 3.13 23 1.06 Chinese 4.37 142 0.73 Chinese 3.45 143 0.97 Koreans 3.90 20 0.55 Koreans 3.40 20 0.94 All 4.25 200 0.77 All 3.45 202 0.99 Indians 3.83 23 1.11 Indians 2.78 23 0.80 Chinese 3.28 143 1.10 Chinese 3.17 141 0.78 Koreans 3.10 20 1.12 Koreans 3.05 20 0.76 All 3.35 202 1.12 All 3.12 200 0.84 Indians 3.52 23 1.08 Indians 2.50 6 0.55 Chinese 3.27 143 1.01 Chinese 3.28 18 0.83 Koreans 3.05 20 1.15 Koreans 4.00 6 0.00 All 3.27 202 1.05 All 3.23 35 0.88 Indians 3.70 23 0.63 Chinese 3.76 143 0.66 Koreans 3.75 20 0.55 All 3.74 202 0.67
Source) Survey conducted by author's research group.
Note) 1. Mean scores were calculated for level of satisfaction which was rated on a 5-point Likert scale (1=strongly dissatisfied to 5=strongly satisfied).
2. Numbers (1 through 8) represent rank based on the Indian engineers' mean scores.
3. To assess statistical differences, one-way ANOVA s with Bonferroni tests were conducted.
"8. Child education" was statistically significant at the .05 level of confidence by one-way ANOVA test * The difference between Indians and Koreans was statistically significant at the .05 level of confidence for "8. Child education."
Overall satisfaction of life in Japan 8. Child education * 4. Housing 6. Food 3. Commuting time & method
5. Medical environment 7. Relationship with locals 1. Safety 2. Living convenience
Scores for Indian software engineers related to the relationship with locals and child education were below 3.0. For Indians, the mean score of the latter was as low as 2.50, and for Koreans it was 4.00. This difference was statistically significant. The same was expressed in the questionnaire survey (see comment 3 in Appendix). The President of TCS Japan pointed out in the interview that child education is especially a big problem for Indian engineers who have children (JILPT, 2006). Actually, the first Indian school in Japan, India International School in Japan, was opened in Tokyo in August 2004, and it is expected to alleviate the magnitude of the difficulty to some extent.
V. CONCLUSIONS
In the present study, Japan’s IT industry and its labour market were observed, and the work and life of Indian IT engineers in Japan engaged in software development were examined through a survey. The sample size of Indian software engineers was not large and may impose some limitation to the interpretation. However, findings were further supported by comparative analyses with Chinese and Korean software engineers as well as cases derived from opinions expressed in the survey and in a parallel interview. It is clear that profiles and perceptions of Indian engineers and those of Chinese and Koreans in Japan are different, but this is plausible considering differences in entry route to Japan as well as proximity, geographical and otherwise. Findings of the study are as follows:
- The average age of Indian IT software engineers is 31.0, and the average total length of stay in Japan is 3.59 years. More than 40 percent either do not speak Japanese at all or do not speak it well. - Indian respondents have a bachelor’s or higher degree, and the average skill level of Indian IT
engineers working in Japan appears higher than Chinese and Korean counterparts.
- Indian IT software engineers have come to Japan for their job while some Chinese and Koreans have come first to study but then later gain employment. Indian software engineers have worked outside of Japan longer in their career while this is not the case for Chinese and Korean counterparts. - 73.9 percent of Indian IT software engineers have joined their current company in India while 26.1
percent have joined in Japan. 39.1 percent of Indian software engineers have found their current job through friends while 30.4 percent have used an advertisement.
- Indian software engineers seem rather dissatisfied with their work conditions including such things as fringe benefits, the working-time management of the company, levels of salary and bonuses, and promotion opportunities. They seem rather satisfied with their communication with seniors and colleagues as well as with end users and customers compared to Chinese and Koreans, but they seem somewhat less satisfied with the communication they have with those of other nationalities such as Japanese.
- Indian IT software engineers appear less well-adjusted to Japanese society and customs than do Chinese and Korean counterparts, but they are rather satisfied with their life overall in Japan. Satisfaction regarding safety and living convenience seems quite high.
- Food is seen as an area of concern for some Indians. Results show that Indian software engineers are less satisfied with food than are Chinese and Koreans. But understanding the Japanese language may alleviate the food problem to a certain degree.
- Levels of satisfaction of Indian software engineers regarding child education in Japan as well as relationships with local people appear quite low.
What can be seen from the above picture of the work and life of Indian IT software engineers in Japan? The study does not show that they are in a plight or are miserable in Japan. In fact, one may get the impression that in general, work conditions are better for Indian software engineers than for Chinese counterparts. However, it cannot be said that they have no problems or concerns and are leading a perfectly happy life in Japan. Of course, the situation naturally varies from person to person. The importance of enhancing human resources can never be overemphasized as work conditions are determined more or less by economic forces. There are, however, certain aspects of life about which the government and/or private companies can do little.
As observed in Section II, even though the Japanese government shows no reluctance in expanding the relationship of Japanese companies with India in IT related areas, this does not mean that it must be Indian IT engineers who are to be employed to meet their expectations. In fact, reasons
why Japanese companies recruit foreign national IT engineers include: (1) securing skilled manpower, (2) responding to pressures for cost reduction, (3) responding to globalization, (4) responding to rising interest in “diversity management” (diversification of human resources), and (5) the fact that some who were recruited based on their qualifications happened to be foreign nationals (Ebuchi, 2003). All of these have nothing to do with nationality. As shown in Section II, Chinese dominate Japan’s IT industry in terms of outsourcing and share of foreign nationals working in Japan. Thus, Indian engineers are in competition with their Chinese counterparts. IPA (2008) revealed the concerns of Japanese companies regarding outsourcing to India. 71.4 percent of companies with valid responses (21, multiple answers) were concerned about “the communication due to the different languages,” and 42.9 percent each were concerned about “differences in business cultures and customs” and the “rising labour cost in India.” Difficulties with communication and language as well as differences in business cultures and customs are, in a sense, non-tariff entry barriers.
On the other hand, Indian IT companies or engineers do not necessarily have to do business with Japan either. Kurata (2004) has pointed out that the work organization of Japanese companies may not be attractive to foreign national IT engineers because: (1) it is not organized based on the job concept, (2) as such, one might not be able to plan or foresee his/her future career, and (3) the managerial ability of Japanese companies to deal with foreign national employees may be lacking due to inexperience. One respondent in the parallel interview indicated that the management of the Japanese company he worked for was too strict for him. When interviewed, the President of TCS Japan said that highly skilled and talented Indian people might shun coming to Japan for work due to the differences in living and business environments as well as language. Further, they might prefer to go to Australia or Singapore in the Asia-Pacific region if the salary were the same because there would be fewer differences in those countries, and it might also be better for their career prospects (JILPT, 2006). In other words, Japan may not be attractive enough for foreign national workers. It remains to be seen whether or not those who are already in Japan would prefer to stay longer.
However, it may be assumed that Indian companies will want to avoid the situation where their source of revenue is concentrated in one place, that is, the US. Therefore, they may want to diversify the sources. Further, Japanese companies cannot afford to ignore the talents and potentials of human resources of India in global business competition. Above all, Japan requires for its economic growth the talented people irrespective of nationality, gender, or age. It may lead to the win-win situations for both sides, therefore, if the Indian companies do not go into the “race to the bottom” type of business strategy but give priority to the value additive activities through (among others) further enhancing human resources, and, if Japanese companies (for that matter, Japan itself) establish an environment where foreign nationals feel relatively at ease in working and living. It should be added, however, that for Japan, the issue may have to be addressed in a broader perspective, that is, how it can accommodate foreign migrants and integrate them into society in the long-term perspective. In this,
language ability would appear to be the key issue.
Acknowledgement
This research project, “Work and Life among Foreign IT Engineers in Japan”, was headed by Prof. Mitsuhide Shiraki of Waseda Univeristy, Japan and was organized at the Institute for Research in Contemporary Political and Economic Affairs affiliated with Waseda University. A part of the research funded by a Health and Labour Sciences Research Grant for the fiscal year 2004 and titled “International Comparative Studies on the Coordination between the International Migration Policies and the Social Security Policies in response to the Decreasing Population,” was entrusted. Prof. Takashi Umezawa of Kokushikan University gave the author useful advice regarding the survey report of the IT industry.
Notes
1. On the other hand, challenges that the Indian IT software industry may face include, among others: (1) shortages of skilled manpower, (2) rising wage costs, and (3) the growth of other industrial and service sectors in the domestic market that have synergy effects with the IT industry (Joseph and Harilal, 2001; Kumar, 2001; D’Costa, 2004; Muniratnam, 2006).
2. Both figures are from the NASSCOM homepage (http://www.nasscom.in/Nasscom/templates/NormalPage.aspx?id=11028) accessed on July 17, 2008.
3. Currencies with the dollar symbol ($), unless otherwise indicated, refer to US dollars.
4. According to the Reserve Bank of India (2007), the total amount of exports of principal commodities in 2006-07 was $126.331 billion. Of this, manufactured goods accounted for $82.818 billion (both figures are provisional, Appendix Table 50, p. 332). The total amount from service exports was $81.330 billion (Table 1.78, p. 90).
5. It should also be added that the most important source region of remittances from overseas to India is North America which accounts for about 44 percent of total remittances. This high share could be attributed to the growing strength of professionals in software and other technology related areas (Reserve Bank of India, 2007, p. 92).
6. Calculated from NASSCOM (2004, p. 38).
7. These figures are from the WITSA website (http://www.witsa.org/).
8. The estimation procedure in this section follows that in Kurata (2004) and Shiraki (2005).
9. This is primarily due to the fact that categorizations of industry and job/occupation or government statistics are not necessarily structured to capture differentiations in the IT industry
comprehensively (Kurata, 2004). According to Varma and Rogers (2004), defining an IT worker is complicated in the US because IT occupations are not located only in the IT industry. The situation is the same in Japan.
10. Note that each category includes not only IT engineers but also engineers or specialists in other fields.
11. Nath and Hazra (2002) point out that the embedded software segment holds the key to supremacy in the software market.
12. Simultaneous with this study, Wang (2005) conducted a survey on Chinese IT engineers working in Japan. He encountered similar problems with the unknown sample population and therefore followed a similar sampling method. While the size of the Chinese sub-sample in this study was 144, the sample in the Wang study was 60. The Wang study had interviews with six Chinese engineers that were in-depth and interesting, but numerical analyses of the survey were somewhat less detailed.
13. Greenspan (2004, p. 128), quoting an article in Time dated June 19, 2000, points out that 72 percent of working Indians in the US are college graduates and only three percent lack a high school education. In fact, unlike other immigrants to the US, the Indian Diaspora in the US is largely made up of professionals and their families (Balatchandirane, 2007a). However, note that body shopping type IT jobs are also included with these professionals.
14. Xiang (2007, p. 109), quoting Agence France-Presse’s “Indian Software Experts Looks Askance at Germany’s Welcome Mat,” dated May 26, 2000.
15. Wang (2005) points out that especially after 2000, as companies in Japan started recruiting Chinese college/university students in China for jobs in Japan, more and more Chinese engineers come to Japan for work directly and immediately after their graduation from school in China.
16. Statistically significant differences between the Indian and Chinese software engineers regarding total length of work career and length of career engaged in software development (Tables 3-(1)-(A) & (D)) are presumed to be due to differences in their average ages (Table 1).
17. Chinese were on average 35.7 years old (n=81, sd=5.4) , and Koreans are 45.9 years old (n=8, sd=12.3).
18. The same procedures were adopted for analyses regarding the degree of adjustment and satisfaction with life. Also see notes to Tables 11, 12, and 13.
19. Those who speak Japanese (“Japanese speakers”) refer to those whose response was either “enough for daily life,” “well”, or “completely fluent” in Table 2. Those who do not speak (“non-speakers”) refer to either “not at all” or “not well.”
20. Abraham and Sharma (2005, p.801) point out that IT workers are constantly under pressure to work longer hours to complete and meet targets within specified time limits in India as well, but the extent of overwork for some Japanese is actually extreme.