NUE Journal of International Educational Cooperation, Volume 12, 151-162, 2018
Study Note
1. INTRODUCTION
Students need problem-solving skills in all aspects of their studies even when encountering real-world problems. Lajoie (1995) noted that mathematical problems and activities have to be taught in line with realistic context so students can use and apply their mathematical knowledge in their Jobs. Mathematics is beautiful as Von Waltershausen (1856) noted that even Gauss described mathematics as the “queen of science”. In Fiji students view on mathematics is different; they have no motivation, and very low self-confidence. Brown, Brown & Bibby (2008) believe that if students have low self-confidence, mathematics will be difficult and could result in them to dropping out of learning. Fiji’s education system has been undergoing continuous reforms. In 2011 there is a big change made: the national examination was abolished from year 1 to 11, and Classroom-Based Assessment (CBA) was introduced. This assessment is supposed to immediately provide quick feedback to students and teachers as they teach (MoE, 2008). According to the
Australia National Numeracy Review, the center for the teaching and learning process is assessment, and very good CBA could improve the teaching and learning process. Groves, Mousley & Forgasz (2006) supported the idea by stating that to effectively help students to develop numeracy skills and understanding, the teacher must develop strategies and create a teaching approach that generates mathematical understanding.
The MoE re-introduced the national examination back into the school system and curriculum in 2015. The summative evaluation that will measure each and individual student knowledge and skills after one academic year. In addition, teachers conducted formative evaluation CBA inside their classroom for quick lessons feedback on student’s mathematical thinking. The system is a combination of the national exams and CBA and in this analysis, we will compare the different cognitive level with the percentage pass rate to the different topics covered in the Year 10 syllabus. In addition, we will analyze and synthesize the 2015 NER comprehension level to compare the
Mathematics Misconception and Achievement of Year Ten Students in Fiji:
Result from Fiji Year Ten Examination 2015, 2016 and 2017 Examiners Reports
Luke SERUBASAGA Naruto University of Education
Abstract: The Ministry of Education (MoE) with its rigorous reform policy it has was to improve student’s mathematics performances. In the National Examiners Reports (NER) of the Fiji Year 10 Certificate Examination (FY10CE), it listed common issues regarding what children faced when encountering mathematical questions. A summary of 2015, 2016 and 2017 NER and analysis and of the interpreted misconceptions from the common errors made by students. We compared the different cognitive levels with the percentage pass rate to the different topics covered in the Year 10 syllabus. Results showed that students have good outcomes in basic knowledge but failed to perform well in the comprehension and application level. Items observational analysis showed that language has an impact on the mathematics outcome. Advocates for language barriers in mathematics programmers must consider such findings and find ways or design programme that resistance and implement.
outcome of student’s performances on each item. 2. METHOD
The report summarizes the Ministry of Education (MoE) Year 10 Certificate Examination (FY10CE) National Examiners Report (NER) from 2015, 2016 and 2017. The subject of each report was 200 students randomly selected by the examiners. Examiners reported on the pass rate of each item and gave comments on some of the common errors shown by students on their answer scripts. This report will: a.Analyze the six topics in the year 10 syllabus for
each item for the three-year paper.
b.Analyze the Average pass rate of each topic according to the three cognitive level; Basic Knowledge, Comprehension and Applications. c.With regards to Comprehension level 2015, a
summary of the common errors made by the students.
d.With regards to Comprehension level 2015, Analyze items with no responses given by students.
e.With regard to Comprehension level 2015, show examples of two items for each topic and interpret what kind of instruction needed to be applied. f.Offer general recommendations from the
Examiners and the author’s recommendation on how to teach that could prevent any kind of misconception by students.
3. Year Ten Mathematics Curriculum 3.1 Mathematics Syllabus
Table 1 below shows the list of the strands and the various sub-strands covered by the year 10 textbook which was introduced to all schools throughout Fiji. The content was simplified to help slow learners in understanding basic mathematical concepts. The new textbook uses a wide variety of techniques such as it provides more examples of student’s daily living problems to mathematical concepts in each sub-strand. The version was published by the Curriculum Development Unit (CDU) under the MoE of Fiji in 2015.
3.2 Year Ten External Examination Question Papers The paper was based on the Year 10 Mathematics Syllabus in Table 1. The question paper retained the format of previous papers. A candidate was again required to demonstrate accurate recall, selection and use of basic procedures. This was not evident in low performing candidate’s responses even though questions were designed to allow candidates of all mathematical abilities to show their skills and ability to analyze and interpret information as well as the recall of basic mathematical facts.
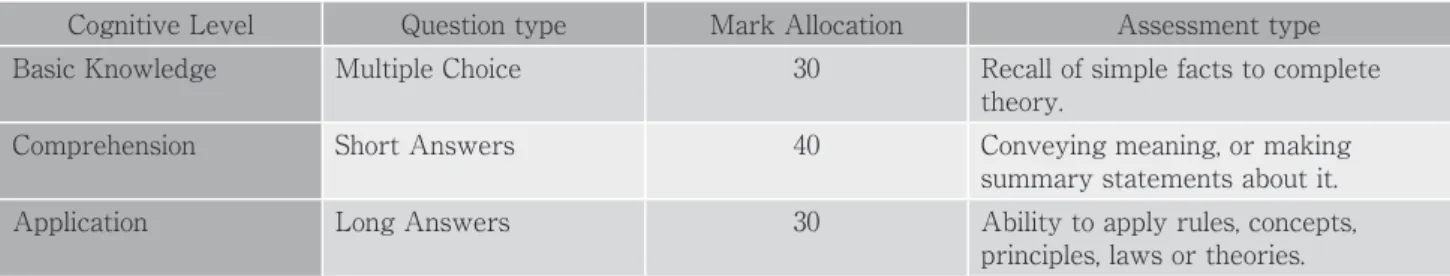
Table 2 shows the three cognitive level the year 10 students were tested in; this is Basic Knowledge,
the ability to recall learned unit contents. It can range from the recall of simple facts to complete theories. It represents the minimum level of learning outcome, requiring only that the student recall previously learned information and contents. Comprehension, the ability to grasp the important meaning and concepts of units learned. The student may show understanding of the unit contents by translating it from one form to another, by conveying meaning and concepts, or by making summary statements about it. Application, the ability to use learned unit contents in a new and concrete situation. The students are required to apply rules, concepts, principles, laws, or theories.
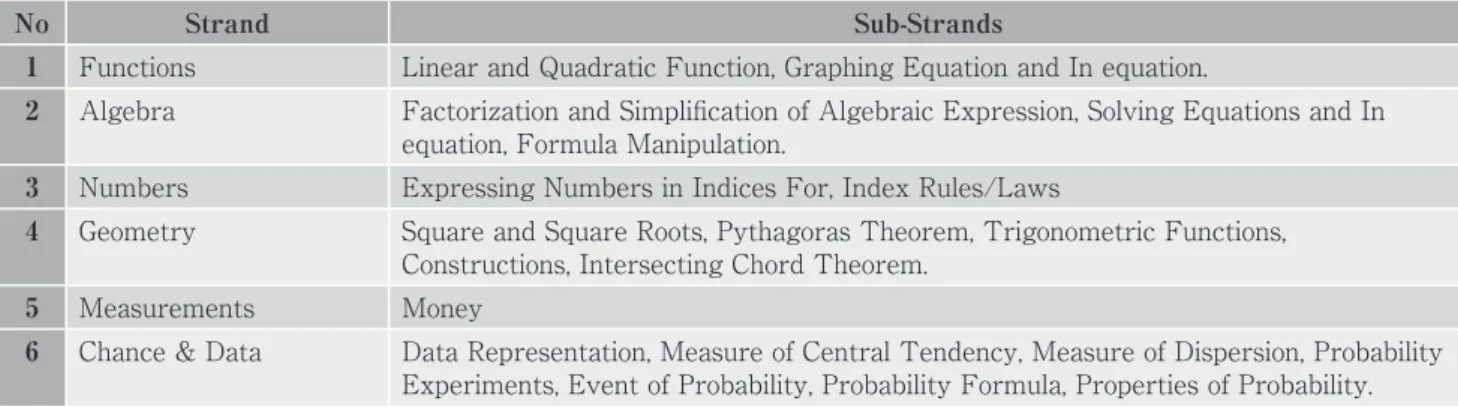
No Strand Sub-Strands
1 Functions Linear and Quadratic Function, Graphing Equation and In equation.
2 Algebra Factorization and Simplification of Algebraic Expression, Solving Equations and In equation, Formula Manipulation.
3 Numbers Expressing Numbers in Indices For, Index Rules/Laws
4 Geometry Square and Square Roots, Pythagoras Theorem, Trigonometric Functions, Constructions, Intersecting Chord Theorem.
5 Measurements Money
6 Chance & Data Data Representation, Measure of Central Tendency, Measure of Dispersion, Probability Experiments, Event of Probability, Probability Formula, Properties of Probability. Source: MoE CDU Fiji, (2015 pp.6-7).
4. ANALYSIS FINDINGS
Table 3 below shows the average marks allocation for each topic studied in year 10 examination papers for the three consecutive years. It was noted that Geometry, Algebra, and Function dominate the Basic level items numbers with a rating of 8, 6 and 5 respectively. The other topics have 4 each; there is an allocation of 1 mark per item. Algebra dominates the Comprehension level items with a rating of 12 followed
by Chance and Data with 8. Functions have 5 while Geometry, Numbers, and Measurement have 4, 3 and 2 items respectively. Marks allocation is different depending on each part of the items. Application level saw Functions, Chance and Data, and Measurement with the rating of 8, 6 and 5 items while Algebra and Geometry have 2 items each. There are no items in Section C for Numbers in all the three years of the papers.
4.1 The average pass rate in each Cognitive level analyze from the NER.
The following sections show the result of analysis on the NER according to the three cognitive level based on Bloom’s Taxonomy.
4.1.1 Basic Knowledge
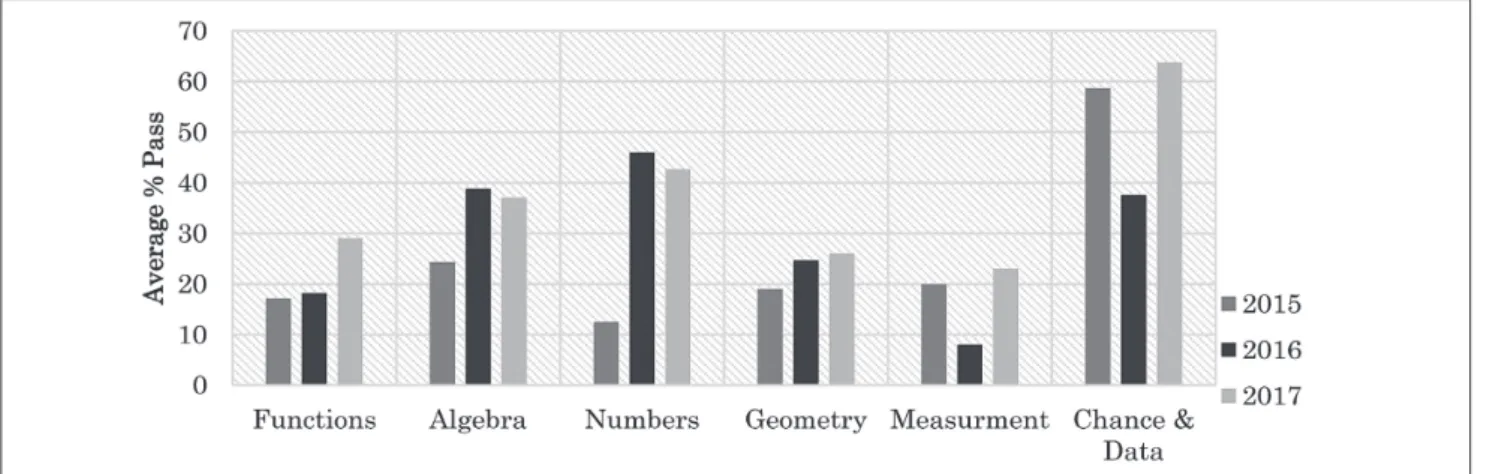
Basic Knowledge shown in Figure 2.1 were satisfactory but some topics areas need teachers to use plausible distractors to root out any misconceptions.
Topics like algebra experienced a percentage drop in 2016 and a slight increase in 2017 with the differences of 0.5%. Other, areas also need improvement. In most topics we can note the fluctuation. For example, Functions shows a 57%, 48.75%, and 64.6% percentage pass rate. Numbers increased from 54.75% to 58% but dropped to 41.33% in 2017. Geometry was above average but still more improvement needed as it recorded a pass rate of 57.56%, 51.13%, and 55.5% respectively. Measurements were the only topic that Table 2. Cognitive Level of question used in the exam papers.
Cognitive Level Question type Mark Allocation Assessment type Basic Knowledge Multiple Choice 30 Recall of simple facts to complete
theory.
Comprehension Short Answers 40 Conveying meaning, or making summary statements about it. Application Long Answers 30 Ability to apply rules, concepts,
principles, laws or theories. Source: The Author made this Table.
Table 3 Distribution of items to each topic according to the NER.
Topics Functions Algebra Numbers Geometry Mesuments Chance & Data
Basic Knowledge 5 6 4 8 4 4
Comprehension 5 12 3 4 2 8
Application 8 2 0 2 5 6
Average question distribution between each cognitive level and topics covered Source: MoE NER (2015, 2016, and 2017)
recorded a continuous increase in the last three years with a 54.25%, 67.5% and 68.28% respectively. Chance and Data dropped below average in 2016 from 58% to 40.25% but managed to improve again in 2017 with a rate of 60%. There’s a need for teachers to focus on skill sets required to help the teaching and learning of mathematics inside the classroom to improved performance of students’ mathematical understanding in Basic Knowledge.
4.1.2 Comprehension
Comprehension level was poorly done, all topic areas need a major change in order to clarify the student’s mathematics misconception. Functions show
increases but still below the 30% margined. Algebra recorded an increase in 2016 from 24.31% to 38.8% but slightly dropped to 37.8% in 2017. Numbers have a big improvement in 2016 from 12.5% to 46% also slightly decrease with a rate of 42.67% in 2017. Geometry shows progressive improvement but still also below the 30% margined. In Measurement, there was a drop in 2016 from 10% to 8% and improve back in 2017. The last topic shows promising average data of 58.63%, 37.63%, and 63.75% respectively, but there still improvement needed. These section majority of the question involves formulating Mathematical statement from sentences and this was ones of the main issues because of language barriers.
4.1.3 Applications
The application saw many comments made by the examiners that were related to language understanding. The Figure 2.3 shows that the five strands’ pass rate was below average from 2016. Functions had an increase of 20.43 to 35.35% but dropped in 2017 with the rate of 30.88%. Algebra
dropped from 49.33% to 14.5% in 2016 and increased back to 43% in 2017. The result about Geometry increased gradually but at the end of 2017 was still under the 40% margined. Measurement increased from 33%, 35% to 44.6% in 2017 but was still under the 50% threshold. Also, it dictates the same results as the comprehension level questions even though there Fig. 2.2 Average percentage pass in Comprehension Level on the six topics coverage. Source: NER, MoE,
(2015, 2016, & 2017)
Fig. 2.3 Average percentage pass in Application type of question in the six topics coverage Source: MoE, NER, (2015, 2016, & 2017)
was a positive change in two of the tested topics, others showed average pass rate fluctuations. The positive growth shown was in Chance and Data and Measurement with the rate of 43.2%, 57.85%, 65% and 33%, 35%, 44.6% respectively. Many misconceptions arose from the application side of questions such as the incorrect use of formulas. Also, students ignoring negative signs in front of the variables, could not interpret the graph properly, and many more.
4.2 The analysis of the common errors from the NER and the authorʼs interpretation in studentsʼ misconception of each item.
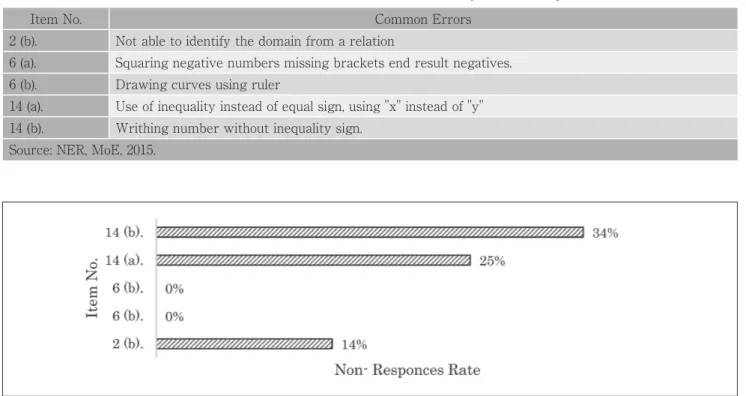
The following table show some of the misconceptions or the difficulties students encounter in their answer scripts. The Table 3.1 to 3.6 below
summarizes the errors which are commonly made by students in the comprehension part of the paper. The figure shows the percentage of items with no responses on their answer script and examples from each topic. 4.2.1 Functions
In Function figure. 3.1, 14% of students whose script was analyzed did no attempt item 2(b), which is 28 out of the 200 students scripts analyzed. The NER noted that “students not being able to identify the domain from the given relation” (MoE, 2015, p.3). In item 2 (b) the Interpreted Misconception 1, of students could be that they do not understand the definition or meaning of “domain”. Interpreted Misconception 2: students are confused by “x and y values” in a set of ordered pairs.
The second example is in figure 3.1.2 below shows items 14 (a) and 14 (b) which show a much higher
percentage rate of students who do not attempt the questions these are 25% and 34% respectively. Table 3.1 Common Errors of students on each item on topic covered by Functions
Item No. Common Errors
2 (b). Not able to identify the domain from a relation
6 (a). Squaring negative numbers missing brackets end result negatives. 6 (b). Drawing curves using ruler
14 (a). Use of inequality instead of equal sign, using ''x'' instead of ''y'' 14 (b). Writhing number without inequality sign.
Source: NER, MoE, 2015.
Fig. 3.1 Percentage of students who do not attempt each item on topic covered by Functions. Source NER, MoE, 2015
The NER noted that there were two most occurring errors found in this items, first was the incorrect use of the inequality sign. Secondly, students were confused about the x-axis and the y-axis of the Cartesian plane (MoE, 2015, p.7).
Interpreted Misconception 3 is that students could not distinguish between the x-axis and y-axis of a Cartesian plane even though it is labeled. Interpreted Misconception 4, is that students cannot figure out which inequality sign they could use if there is a solid line or a dotted line.
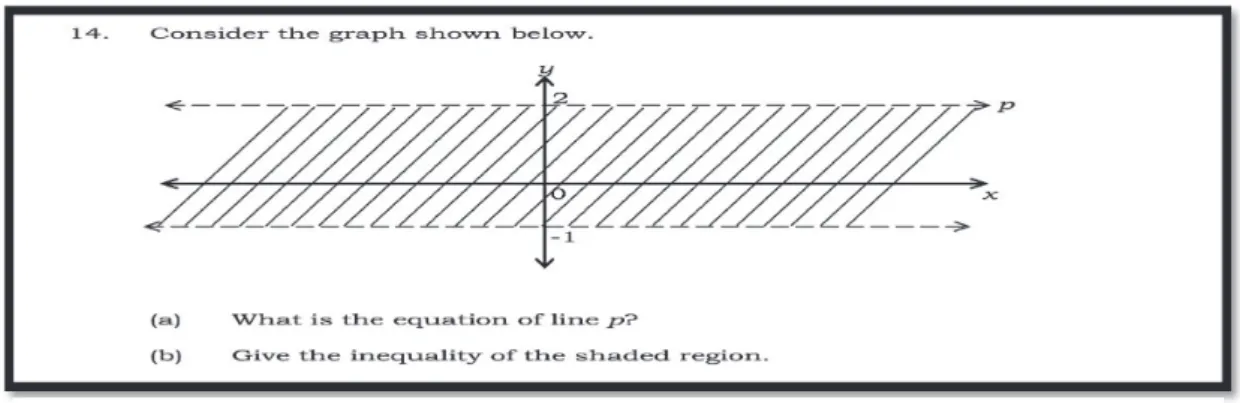
According to the NER, only 5% of the answer scripts for Item 14 (b) were able to get the full marks (MoE, 2015, p.7). Two assumptions of misconception
arise when students are dealing with inequality of the shaded region. First, they could not write the equation of line ‘p’ from a designed inequality graph. This shows the definition or the meaning of the word equation totally changes when students try to interpret the information using the inequality graph. Secondly, they only wrote numbers, which indicates that they could not interpret inequality between two shaded parts. Also, the use of a dotted line still has no meaning to them, and they were unaware of which variable to use ‘x’ or ‘y’ when formulating the inequality.
4.2.2 Algebra
In Algebra, Figure. 3.2 shows 40 % of students Fig.3.1.2 Item No. 2(b). Source FY10CE, MoE, 2015, p 13
Table 3.2. Common Errors of students on each item on topics covered by Algebra.
Item No. Comments
1 Problem with squaring numbers
2 (a). Difficulties in formulating mathematical statement from sentences. 3 Expansion not done to all the term inside the brackets
4 (a). Problem with multiplying and dividing by negative numbers 4 (b). Language problems
7 difficulties to make the subject of the formula 12 (a). Wrong expansion
12 (b). Cannot figure out the common factor. Source : NER, MoE, 2015
According to the NER, there are three focus areas needed for this item: Firstly, the use of distributive properties; secondly, distinguish between unlike and like terms; lastly, the use of the minus sign in operation such as divide and multiply. (MoE, 2015, p.3). Students tend to get confused with some of the use of the terms in the FY10CE. This terms such as “factorizing”, “expand”, and “solve” when dealing with algebraic expressions and algebraic equations.
Interpreted Misconception 6: students were not
able to use previous knowledge in this item, such as the use of distributive properties. Interpreted Misconception 7: when dealing with like terms and unlike terms, students did not know the proper procedure when adding or subtracting.
This is the basic knowledge needed to be properly understood by students for them to be able to see inside a new problem. This will help them quickly recall what steps they should take in order to get their final solution.
whose script was analyzed did no attempt item 2(a). Converting this 40%, this was 80 students out of the 200 scripts which were analyzed in 2015. According to NER students have problems formulating mathematical statements from sentences. Secondly, language problems were one of the contributing factors in the poor responses from Students (MoE, 2015, p. 3).
Interpreted Misconception 5’: students cannot
formulate mathematical statements in the sentences because they cannot see mathematics inside the statement or previous knowledge.
Teachers need to train student’s skills of extracting mathematical information because mathematics is a subject with the language of its own. The majority of Fijian students are bilingual and English is their second language. Since the medium of instruction is English more emphasis is needed.
In another case, Figure 3.2.2 below shows item 3 which also a higher rate on no response from students.
This rate was 28 %( Figure 3.2) which is 56 scripts in which there was no attempt.
Fig.3.2.1 Item No. 2(a). Source FY10CE, MoE, 2015, p 10
Fig.3.2.2, Item No. 3. Source FY10CE, MoE, 2015, p 10.
4.2.3 Numbers
Table 3.3. Common Errors of students on each item on topics covered by Numbers
Item No. Comments
5 (a). Problems in Laws of Indices
5 (b). Not raising everything inside the brackets to the power outside. 9 (a). Unable to write volume of a cube in base index form.
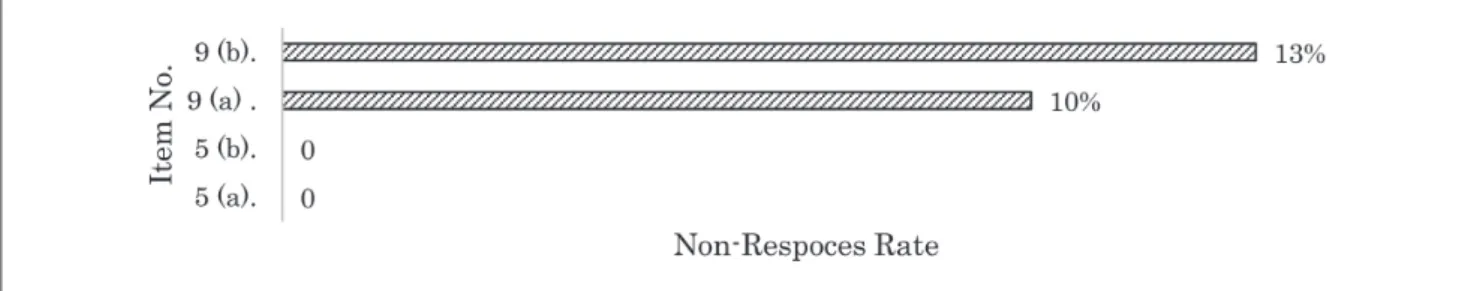
9 (b). Not able to calculate volume of cubes Source : NER, MoE, 2015
The Figure. 3.3 shows 10 % and 13% respectively for item 9 (a) and 9 (b) which is exactly 20 and 26
students respectively who did not attempt these items.
According to the NER, only 7% of the answer scripts analyzed achieved full marks. Also, remarks made were that students were not able to use the volume formula correctly (MoE, 2015, p.3).
Interpreted Misconception 8: students cannot even read and understand word sentences. The ability to pick out mathematical information that is within the word sentences. This is the hidden information and students needed skills to know on how to extract them.
In the other part, item 9 (b) 15% of the students able to get full marks, but on the other hand, 13% in Figure 3.3 shows that 26 students did not attempt their answer scripts. The NER noted that there is a need for educators to address the basic when using algebraic equation and algebraic expression. (MoE, 2015, p. 6)
Interpreted Misconception 9: ‘language problem’
the ability to read and understand the mathematical terms and sentences. Interpreted Misconception 10: students lack skills of extracting information and to formulate the mathematical statement. The teachers need to direct student on how they can properly extract information from story problems.
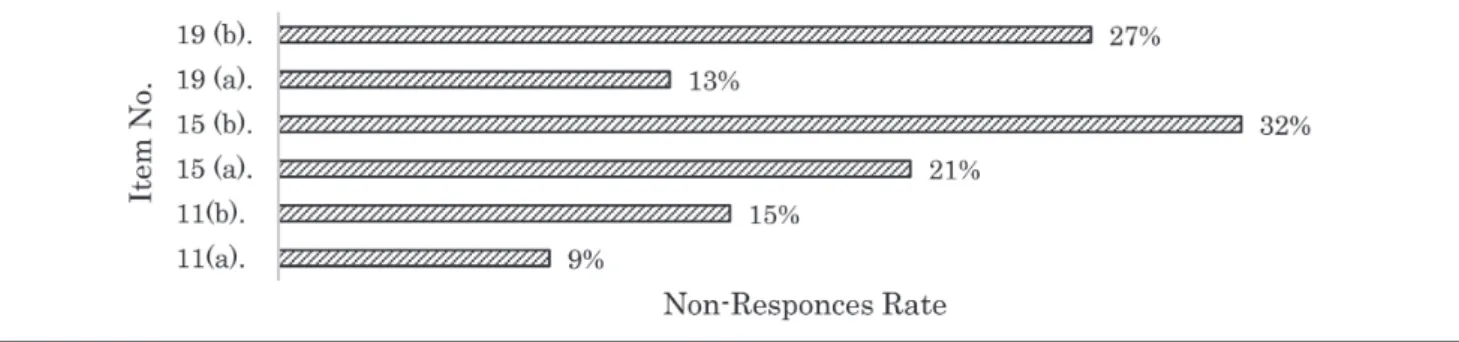
4.2.4 Geometry
The Figure 3.4.1 shows item 15 (a) and 15(b) and NER noted that only 3% out of the 200 scripts analyzed achieved full marks in both items (MoE, 2015). In Figure 3.4 the rate of each item is 27%, and 32% respectively. This is the number of students who did not attempt the two items. According to the NER, the students could not use Pythagoras theorem, they were confused when dealing with letters and have difficulties calculating variables of the same power. Interpreted Misconception 11: students have Fig. 3.3 Percentage of students who do not attempt each item on topics covered by Numbers. Source NER, MoE 2015
Fig.3.3.1 Item No. 9 (a) and 9 (b). Source FY10CE, MoE, 2015, p 10
Table 3.4 Common Errors of students on each item on topics covered by Geometry.
Items No. Comments
11(a). Incorrect rounding off of answers 11(b). Incorrect Labeling of Length 15 (a). Unable to apply Pythagoras theorem 15 (b). Inability to recognize like terms 19 (a). Could not identify the type of graph 19 (b). Emphasis, coordinate of main point of graphs Source: NER, MoE, 2015.
limited knowledge about the right angle triangles and other shaped triangles. Interpreted Misconception 12:
the concept of like and unlike terms are not understood very well by students.
4.2.5 Measurement
The Figure 3.5.1 shows Item 20 (a) and 20(b), only 4% of the students who did no response to these two items. The NER noted that 52% of those who attempted to answer received no marks for both
items. In addition, the majority of the students had difficulties in calculating the chargeable income (MoE, 2015, p 10).
Fig. 3.4 Percentage of students who do not attempt each item on topics covered by Geometry. Source NER, MoE 2015
Fig.3.4.1 Item No. 15 (a) and 15 (b). Source FY10CE, NER, 2015, p 13
Table 3.5 Common Errors of students on each item on the topics covered by Measurement
Items No. Comments
20 (a). Difficulty in calculating chargeable income. 20 (b). Calculating refund using wrong formula. Source : NER, MoE, 2015
4.2.6 Chance and Data
In Figure 3.5.1 shows item 20(a) and (b), and the NER note that for these two items students have no idea on how to formulate chargeable income (MoE, 2015, p 10).
Interpreted Misconception 13: students were not aware that the total amount deducted was FNPF plus PEYE. In addition, students are making mistakes in subtracting directly from Normal Tax.
The Figure 3.6 below, shows that item 16 (a) and 16 (b) recorded the highest rate of the students with no response on their answer script. This was 17% and
10% respectively, in addition, 18% of the students failed to get the correct solution for item 16 (b).
The NER noted in Figure 3.6.1 below that many students wrote 37 as the upper quartile and 7 as the
interquartile range with the use of the wrong formula (MoE, 2015, p, 8).
Table 3.6 Common Errors of students on each item on the topics covered by Chance and Data. Fig.3.5.1 Item No. 20 (a) and 20 (b). Source: FY10CE, 2015, p 15
Items No. Comments
13 (a). Probability that is greater than 1 13 (b). E(x)=np must be taught well
16 (a). Some students wrote 3 value for the upper quartile 16 (b). Incorrect use of formula
17 (a). Well done 17 (b). Wrong working 18 (a). Well done
18 (b). Probability greater 1 Source: NER, MoE, 2015.
Interpreted misconception 14, students are confused with the meaning of mean, median, quartile upper quartiles, and interquartile range. Interpreted misconception 15, most students answer is 7 so they pick the correct upper quartile but wrong lower quartile value, therefore could not correctly determine the correct solution.
5. General Conclusion
In the first section of the analysis, students tend to do well in the Basic knowledge level compared to the other two cognitive levels. The majority of the problem-solving parts in comprehension and application levels were not attempted by the students. The analysis also noted that there were increased numbers of items with no responses. The students have shown a negative attitude by not responding to questions. The NER also commented that students have lost interest in mathematics so teachers need to find creative ways in lesson dissemination MoE, (2016). The common errors made by students mostly related to simple calculation techniques and skills. NER urged to focus on this basic calculation techniques and skills when revising for external examination.
Teaching strategies to be effective as Kulm, (1994) noted that meaningful learning of mathematics to happen, educators are duty bound to pick and pose activities that involve learners active in constructing their understanding of mathematical thinking, and confidence. Teaching and learning process needs to be students centered use of constructive teaching approach to help students gain knowledge. According to Glasersfeld, (1989) mentioned that knowledge is gained by children when they construct and restructure it over time. Also, Dewey (1938/1997), a child gains knowledge through practical work or
when facing a realistic situation, and educators should help this process. Moreover, Hatfield, Edward, Bitter, & Morrow, (2003) noted that the teaching and learning of mathematics will be improved vigorously when the learning style moves from behaviorism to constructivism.
Base on topics wise, all topics need improvement as mentioned by the MoE, NER, (2017) stated that students need to improve their skills in all topics areas, for example, manipulation of an algebraic expression or how to draw diagrams using pencils. There was 16 interpreted misconception that can be formulated from the comprehension section and there are many more in the other two parts of the paper. MoE, NER, (2017) reported that there is a need to put more emphasis on the application type of items and facilitators need to make the connection in a real-life situation.
Facilitators also have a pivotal role in the learning process and they need to be creative to facilitate students learning the ability. Cohen & Fowler (1998) stated that facilitators should construct learning activities that will assess a child’s deep understanding of one mathematical idea. NCTM (2000) noted that facilitators need to apply authentic mathematical task during the lesson to help in building students mathematical knowledge. Lastly, Kulm, (1994) noted that for facilitators, when posing and developing activities, should consider making use of the application of mathematical procedure with a different solution so that it can bring out students’ understanding.
REFERENCES
Brown, M., Brown. & Bibby. (2008) I would rather die: Reason given by 16 years-old for not continuing their study of mathematics. Research in Mathematics Education, 10(1).3-18.
Commonwealth of Australia, (2008). National numeracy review report. Canberra, Australia.
Dewey, J. (1997). Experiencing and education. New York, NY: Simon & Schuster (Original work published in 1938).
Groves, S., Mousley, J., & Forgasz, H. (2006). Primary numeracy: A mapping review and analysis of Australia research in numeracy learning at primary school level. Canberra: Department of Education Science and training.
Hatfield, M. M., Edwards, N. T., Bitter, G. G., & Morrow, J. (2003). Mathematics methods for elementary and middle school teachers (4th Ed.).
New York, NY: John Wiley & Sons.
Kulm, G. (1994). Mathematics assessment: What works in the classroom? San Francisco, CA: Jossey Bass Inc.
Lajoie, S.P. (1995). A framework for authentic assessment in mathematics. In T.A. Romberg (Ed.), Reform in school mathematics and authentic assessment (pp.19-37).Albany, NY: State University of New York.
Ministry of Education, Fiji. (2008). National policy for curriculum assessment and reporting. Suva, Fiji:
Ministry Publishing
Ministry of Education Fiji (2015), Fiji Year 10 Certificate Examination. Examiners Report, Suva, Fiji, Ministry Publishing
Ministry of Education Fiji (2016), Fiji Year 10 Certificate Examination. Examiners Report, Suva, Fiji Ministry Publishing
Ministry of Education Fiji (2017), Fiji Year 10 Certificate Examination. Examiners Report, Suva Fiji Ministry Publishing
National Council of Teachers of Mathematics. (2000). Principles and standards for school mathematics. Reston VA
Rosli, R, Goldsby, D & Capraro, M., .M. (2013). Assessing Students' Mathematical Problem-Solving and Problem-Posing Skills. Asian Social Science, 9(16), 54.
VonGlasersfeld, E. (1989) Constructivism in education. In T. Husen, & T.N. Postlethwaite (Eds), The International Encyclopedia of Education (supplementary vol., pp. 162-163). Oxford: Pergamon. Von Waltershausen, W, S. (1856). Gauss zum Gedachtnis (Gauss: A memorial). Liepzig, Germany: von S. Hirzel.