非計量多次元尺度構成法を用いたマイクロアレイ実験におけるノイズ低減
8
0
0
全文
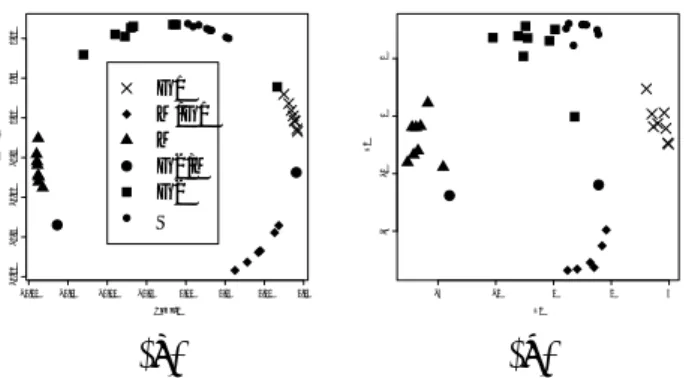
(2) 2. 0.10 0.05. 0 V2 −2 −4. Comp.2. −0.20. −0.15. −0.10. −0.05. 0.00. G1 M/G1 M G2/M G2 S. −0.20. −0.15. −0.10. −0.05. 0.00. 0.05. 0.10. 0.15. −4. Comp.1. −2. 0. 2. 4. V1. (a). (b). Figure 1: (a)2D embedding of 40 genes of cdc15-base synchronization experiments for budding yeast(for detail, see text). (b) Normalized PCA result for the same data.. Although massive amounts of data are generated, methods are needed to determine whether changes in gene expression are experimentally significant. Methods based on conventional t-tests tell us the probability (P)that a difference in gene expression could occur by chance [1, 2]. Although P = 0.05 is significant in the context of experiments designed to evaluate small numbers of genes, a microarray experiment for a thousand genes would give around 50 false positives. In order to avoid such problems, many more sophisticated methods have been proposed (e.g., Ref. [3]). In this paper, we would like to propose a new criterion for gene filtering based on our implementation of non-metric multidimensional scaling method (nMDS)[4, 5]. Since nMDS can be regarded as the most unsupervised form of multivariate analysis, our criterion is also maximally unsupervised.. 2. Applying nMDS to microarray data. In this section we demonstrate the usefulness of nMDS in the analysis of gene expression data. For time course gene expression profiles, we have previously shown[5, 6] that 2D nMDS embeddings give us circular configurations with the polar angle readily interpretable biologically (typically being time related). Fig. 1(a), shows the 2D nMDS embedding of budding yeast cell cycle division microarray data[7, 8] with correlation coefficients[5, 6] used as the similarity measure. It is clear that nMDS can separate out cell cycle phases with no supervision being required. In our experience, other methods like k-means clustering, self organized map and kernel PCA, cannot produce such a striking results. The only exception is normalized PCA[5, 6] which gives results consistent with those of nMDS, albeit of lower quality (See Fig. 1(b)).. −10−.
(3) 0.04 Comp.2. 0.00 −0.02. −0.04. −0.03. −0.02. −0.02. −0.01. 0.00. Comp.2. 0.00. Comp.2. 0.01. 0.02. 0.02. 0.02. 0.03. 0.04. 0.04. 0.04 0.02 0.00. Comp.2. −0.02 −0.04 −0.04. −0.02. 0.00. 0.02. 0.04. −0.04. −0.02. 0.00. Comp.1. (a). 0.02. 0.04. Comp.1. −0.04. −0.02. 0.00 Comp.1. (b). (c). 0.02. 0.04. −0.04. −0.02. 0.00. 0.02. Comp.1. (d). Figure 2: (a)2D embedding of randomly selected 988 genes from factor-based synchronization (abbreviated as alpha). (b)The same for size-based synchronization (abbreviated as elu). (c) Top 743 good-embedded genes for (a). (d) Top 882 goodembedded genes for (b).. 3. Noise reduction. Unfortunately, such clean circular results are fairly uncommon, making the definition of polar angles unreliable. In Fig. 1 and Ref. [5], only genes pre-selected for the right periodicity are embedded. For such cases, we usually get a clean circular arrangement, with the polar angle interpretable as the extent of progress through the cell cycle. In general, the circular arrangement is much poorer (except yeast data synchronized by elutriation which does in fact give a clear circular arrangement[6]). In Figs. 2 (a) and (b), we compare 2D nMDS embeddings of 998 randomly selected genes from experiments using two different synchronization methods[7]. Clearly, synchronization by elutriation (Fig. 2(b)) gives a much clearer circular arrangement. Of course, the appearance of a clean circular arrangement is not a necessary condition for the polar angle to be biologically meaningful; polar angles obtained from normalized PCA, which gives a rather diffuse circular arrangement, are consistent with those obtained from the clean circular arrangement produced by nMDS[6]. We now show that it may be possible to obtain such clean circular configuration simply by discarding noisy genes without pre-selection being needed. To do this, we propose the following procedure. Firstly, gene quality is determined on the basis of goodness of nMDS embedding ∆(i) (for the definition, see Appendix 1 in [5]). We then discard the worst embedded. The question of exactly how many genes to discard is a hard one, and to propose two ways to resolve it. The first method (called Shuffle Test) is that genes whose quality cannot be easily distinguished, statistically, from random vectors are considered noisy and discarded. Randomized gene expression profiles are generated by shuffling the gene expression profile of each gene, i.e., the time order of gene expressions is mixed up. We embed these randomized gene expression profiles into 2D space and find the distribution of the ∆(i) values . For each gene we find the significance level of its true ∆(i) value under the null hypothesis (i. e., gene expression profiles are random), by comparing −11−.
(4) it to the random distribution. In Figs. 2 (c) and (d), we have only preserved genes with a significance level of 5 % or less under our null hypothesis. It is clear that our noise reduction procedure, enhance the circular arrangement in much the same way as pre-selection does (Ref. [5] and Fig. 1(a)). The problem with the Shuffle Test is that the determination of quality are made with respect to embedding which contain noisy data, making such determinations unreliable. Secondly, for a good test, the null hypothesis should respect the data structure as much as possible, except for the information we are interested in. Shuffling profiles destroys all intra-gene as well as inter-gene correlations. Since we are only interested in inter-gene relations here, it seems possible that the test may be too weak. With this in mind we propose a completely different test known as the bootstrap test. The bootstrap test is a recursive test, discarding the worst 10% of genes at each step and re-embedding the remaining ones. The question now is how many steps of recursion are required. We propose to stop the recursion when we cannot be confident that the genes that are identified as belonging to the worst 10% may not even be among the next 10% of genes to be discarded. This confidence level is determined by bootstrapping. 90% of genes are selected randomly, and for each genes it rank is found. This is repeated for a large number of randomly selected sets (of 90% of the remaining genes), to produce a distribution of ranks for the goodness of embedding of each gene. When we start polishing, the worst points are clearly bad, and their rank distributions are very narrow (i.e., we can discard them with confidence). As we discard more points, the worst points increasingly start resembling the better ones, and their rank distribution broadens and eventually become statistically indistinguishable from the points with less mismatches. We stop when this happens. The explicit algorithm for this may be found in the appendix. For actual use, we recommend using the two test in conjunction. The bootstrap test should be applied first. Then the shuffle test should be used on the genes passing the bootstrap test. Note that that bootstrap test is far more demanding computationally, so for exploratory purpose it is often enough simply to use the shuffle test. Despite passing these tests, it may still be possible that these results are not biologically meaningful. However, if we compute `2 -distance[6] of polar angles between alpha experiment and elu experiment, it decreases from 1.58 between Figs. 2 (a) and (b) to 1.48 between Figs. 2 (c) and (d). This value is as small as Table 1[6] of `2 distances, for which we have observed biological information among genes. Thus, noise reduction increases the agreement between alpha and elu experiments and excluded noisy parts because gene relationship among genes is expected to be common for both experiments. We also note that the appearance of circular arrangement does not guarantee that the nMDS result is biologically meaningful, although the data must satisfy some simple law for it to be embeddable as one dimensional structure since our criterion −12−.
(5) G1:MCB. G1:MCB. G1:SCB. G1:SCB. G2M. G2M. G1M. G1M. G2S. G2S. (a). (b). Figure 3: (a)2D embedding of 799 genes assigned as cell cycle regulated (cdc15-based synchronization, cdc15). (b)2D re-embedding of 385 genes after noise reduction procedure.. of goodness of embedding ensures that the circular arrangement is well embedded in 2D.. 4. Biological significance of nose reduction procedure. Following Spellman[7], we preselected 799 genes, which were considered to be cellcycle related, based on a Fourier based method. The cdc15-based synchronization data was used to embed these genes into 2D. Of these genes, many are known, biologically, to be upregulated in specific cell cycle phases. The nMDS positions of this subset of genes are shown in Fig. 3(a). When the bootstrap and shuffle tests are used in conjunction we find that only 385 genes pass our criterion. These genes are re-embedded into 2D by nMDS (Fig. 3(b)). The separation of phases is much improved. This shows that the polishing procedure enhances the biological significance, and also that the circular arrangement which appears after noise reduction is biologically meaningful. nMDS turns out be powerful enough to separate out cell cycle phases even for very noisy microarray experiments. Thus, in general, to check if the circular arrangement produced by noise reduction is genuine, we must identify whose biological meaning is understood and try to identify patterns of these informative genes.. −13−.
(6) 0.00. 0.02. 0.04. V2. (a). 0.04 V3. −0.02 −0.04. −0.02 −0.04 −0.04. −0.02. 0.00. 0.02. 0.04. V2. −0.04. −0.02. 0.00 V2. (b). 0.00. 0.02 V3. 0.00. 0.00. V3. −0.02 −0.04 −0.02. 0.02. 0.04. 0.04 0.02. 0.04 0.02 V3. 0.00 −0.02 −0.04. −0.04. (c). 0.02. 0.04. −0.04. −0.02. 0.00. 0.02. 0.04. V2. (d). Figure 4: (a)2D embedding of randomly selected 500 genes[9]. (b)The same for Ref. [10] (c) Top 266 good-embedded genes for (a). (d) Top 248 good-embedded genes for (b).. 5. Some other examples. So far, we have suggested that the appearance of circular arrangement is indicative of some biological meaning. We now demonstrate that the noise reduction procedure works for systems other than budding yeast cell cycle regulated genes. We have applied same procedure to two distinct cases[9, 10]. For 500 randomly selected genes, we obtained 266(248) genes after noise reduction procedure for Ref. [9]([10]). Both give us clear circular arrangements (Figs. 4). Ref. [9] has been criticized strongly by Shedden and Cooper[11]. Even random data will occasionally show genes with the correct periodic behavior, it is claimed that the number of cyclic genes in Cho’s data could have indeed been produced by random data. We attempt to overcome such issues by explicit comparisons to shuffled data. So far, we have not been able to biologically interpret the polar angles for these cases, although the presence of such a clean pattern makes us optimistic that such an interpretation exists. At the very least, the appearance of a clean circular arrangement shows that there is a one dimensional structure under periodic boundary condition irrespective of interpretation.. 6. Conclusion. We have demonstrated the powerfulness of our nMDS based noise reduction procedure. It gives us clean circular arrangements of genes which has allows for easy definition of the polar angle which we usually find to be biologically meaningful[6]. Since pre-selected genes often give circular arrangements([5] and Figs. 1), the appearance of circular arrangement is promising, although its biological meaning has not yet been understood completely. Noise reduction procedure is based upon the comparison with shuffled data, thus it is free from the criticism by Shedden and −14−.
(7) Cooper[11]. Since this procedure is very general, we expect it should find a wide range of applications.. 7. Acknowledgment. The authors thank Prof. Y. Oono for useful suggestions, discussions, and many other critical contributions to this research.. References [1] Roberts, C., Nelson, B., Marton, M., Stoughton, R., Meyer, M., Bennett, H., He, Y., Dai, H., Walker, W., Hughes, T., Tyers, M., Boone, C. and Friend, S. (2000) Science 287, 873-880. [2] Galitski, T., Saldanha, A., Styles, C., Lander, E. and Fink, G. (1999) Science 285, 251-254. [3] Tusher, V. G., Tibshirani, R., and Chu, G., Significance analysis of microarrays applied to the ionizing radiation response, Proc. Nat. Acad. Sci., 98 (2001), 51165121. [4] Y-h. Taguchi and Y. Oono, Nonmetric Multidimensional scaling as a data-mining tool: new algorithm and new targets, Geometric Structures of Phase Space in Multidimensional Chaos, Advances in Chemical Physics, 130B, eds. M. Toda, T Komatsuzaki, T. Konishi, R.S. Berry, and S.A. Rice (2005) 315-351. [5] Y-h. Taguchi and Y. Oono, Relational patterns of gene expression via non-metric multidimensional scaling analysis, Bioinformatics 21 (2005), 730-740. [6] Taguchi, Y-h., Detecting Cell Cycle Regulated genes in S. pombe with Non-metric Multidimensional Scaling without sinusoidal fittings, IPSJ SIG Tech. Rep., 2005BIO-3, (2005) 59-66. [7] P. T. Spellman,Gavin Sherlock, Michael Q. Zhang, Vishwanath R. Iyer, Kirk Anders, Michael B. Eisen, Patrick O. Brown, David Botstein, and Bruce Futcher, Comprehensive Identification of Cell Cycle-regulated Genes of the Yeast Saccharomyces cerevisiaea by Microarray Hybridization, Mol. Bol. Cell., 9 (1998) 3273-3297. [8] We have selected 40 genes as follows. At authors’ web page (http://genomewww.stanford.edu/cellcycle/), search function is provided. In this functions, genes are assigned as cell cycle phases in accordance with reference genes (CLN2:G1, HTA1:S, CLB4:G2, SWI5:M, ASH1:M/G1). Furthermore, there are [submit] button by which we can list similar genes. Thus, after searching reference genes themselves, by pushing [submit] button, we can have a list of genes which are most regulated to each cell cycle phase. Among these genes with no missing values, suitable number of genes are selected such that each cell cycle can have same number of genes. Since there are no G2/M phase genes in the reference genes, we have used CDC20 and CDC2, although −15−.
(8) they are not so well embedded. Actually speaking, this way of selection can be found in some paper, although I could not cite it since it has not been published. [9] R. J. Cho, M. Huang, M. J. Campbell, H. Dong, L. Steinmetz, L. Sapinoso, G. Hampton, S. J. Elledge, R. W. Davis and D. J. Lockhart, Transcriptional regulation and function during the human cell cycle, Nature Genetics (2001) 27 48. [10] S. Blackshaw, S. Harpavat, J. Trimarchi, L. Cai, H. Huang, W. P. Kuo1, G. Weber, K. Lee, R. E. Fraioli, S-H Cho, R. Yung, E. Asch, L. Ohno-Machado, W. H. Wong, and C. L. Cepko, Genomic Analysis of Mouse Retinal Development, (2004) PLoS Biology 2 e247. [11] K. Shedden and S. Cooper, Analysis of cell-cycle-specific gene expression in human cells as determined by microarray and double-thymidine block synchronization, Proc. Natl. Acad. Sci., 99 (2002) 4379-4384.. A. : Details of Recursive Honing. Algorithm with nMDS: 1. Analyze the data set by nMDS to extract the mathematical structure. 2. Calculate the rank mismatch of each data point and identify the worst 10% of points in terms of mismatch. These are candidates for removal (called the candidate set). 3. Calculate the empirical distribution of mismatch of each gene after randomly discarding 10% of the data set many times. Now, focus on the distribution of mismatch for the members of the candidate set in (2) in this framework. 4. If the distribution obtained in (3) strongly supports the results from (2), remove the candidate set in (2). 5. With the remaining genes as the starting set for the next iteration repeat the procedure from (1) to (4) until (3) no longer supports (2).. Cutoff criterion In Step 4 of the algorithm above, we are asked to decide if the bootstrap results support the set of points we have selected for removal. As indicated in the algorithm, for each point, the bootstrapping procedure gives us a distribution for its normalized rank, i.e., Rank/N . This distribution resembles a Gaussian centered close to its pre-bootstrap rank. We characterize the uncertainty in rank by the 3σ value of this distribution. More specifically, when the distribution becomes so broad that for some point i hr(i)i ≥ 0.9. but. hr(i)i − 3σ(i) ≤ 0.8. we stop our honing process, and accept the result. Here, hr(i)i and σ(i) are the mean and standard deviation respectively of the normalized rank distribution of the point i. −16−.
(9)
図

![Figure 4: (a)2D embedding of randomly selected 500 genes[9]. (b)The same for Ref.](https://thumb-ap.123doks.com/thumbv2/123deta/7916299.1729608/6.892.140.787.175.351/figure-d-embedding-randomly-selected-genes-b-ref.webp)
関連したドキュメント
Bearing these ideas in mind, for the stock market analysis, in the next section, is adopted i the set of thirty-three SMI listed in Table 1 ii the CWs for the signal analysis, iii
We study the basic preferential attachment process, which generates a sequence of random trees, each obtained from the previous one by introducing a new vertex and joining it to
[Tetali 1991], and characterises the weights (and therefore the Dirichlet form) uniquely [Kigami 1995]... RESISTANCE METRIC, e.g. equipped with conductances) graph with vertex set V
While conducting an experiment regarding fetal move- ments as a result of Pulsed Wave Doppler (PWD) ultrasound, [8] we encountered the severe artifacts in the acquired image2.
法制執務支援システム(データベース)のコンテンツの充実 平成 13
当初申請時において計画されている(又は基準年度より後の年度において既に実施さ
Abstract: The Legend Pipe method was researched and developed to reduce groundwater and prevent landslides and liquefaction by utilizing a subsidy from the Ministry of
Abstract: Conventional practice in recording information on archaeological remains is to take
