Development of analytical technique for plant
saccharides using raman spectroscopy
学位名
博士(理学)
学位授与機関
関西学院大学
学位授与番号
34504甲第691号
DEVELOPMENT OF ANALYTICAL TECHNIQUE FOR PLANT
SACCHARIDES USING RAMAN SPECTROSCOPY
A Thesis for the degree
of
Doctor of science
Submitted to
School of Science, Kwansei Gakuin University
By
Anggara Mahardika
1
Abstract
The overall aim of this study is to develop a new technology to study seaweeds for the improvement of aquaculture productivity. Indonesia is one of the top producers of seaweed in the world. The red macrophytic alga, Kappaphycus alvarezii is the main source seaweed for the industrial production of kappa type carrageenan. The quality of seaweed harvests has become paramount to obtaining good quality of carrageenan. A good quality of seaweed K. alvarezii containing about 40-50% of carrageenan. However, instability of environmental conditions may make it difficult to produce good quality carrageenan. Furthermore, harvests are often limited by seaweed diseases, one of the major problems in seaweed farming. Ice–ice is the most famous seaweed disease caused by bacterial pathogens. Ice–ice disease causes whitening of algae thallus and leads to fragmentation and eventually loss of biomass. Bacterial infection in the algal body often involves degradation of algal storage compounds by bacterial enzymes. To monitor and investigate the bacterial infection in seaweed body, low cost and effective analytical tools are needed. In this study, we demonstrated the ability of combining Raman spectroscopy with chemometric analysis to investigate infective enzymatic activities in seaweed body. A low cost Partial Least Square Regression (PLSR) model with reduced number of test samples was successfully achieved for quantifying the enzymatic reaction mixture with substrate and product in the alfa-amylases activity. In order to qualify of seaweed harvest, imaging Raman spectroscopy (iRs) was successfully used to observe carrageenan content in three different hierarchies of seaweed branches. Furthermore, low cost PLSR model and iRs were successfully used to investigate the carrageenan degradation activities of infected K. alvarezii by measuring the decrease in carrageenan content, as a substrate in bacterial enzymatic reaction. From this study, it can be concluded that iRs combined with chemometric analysis is a powerful tool to monitor conditions of seaweed quality.
2 Contents Abstract ... 1 Introduction ... 4 Background ... 4 Carrageenan ... 4 Advantages of carrageenan ... 5
Problem in seaweed farming ... 6
Study of seaweed with vibrational spectroscopy ... 7
The limitation of vibrational spectroscopy for plant sample... 8
Chemometric Analysis ... 9
Synopsis of the work described in each chapter of the thesis ... 11
References ... 14
Figures... 22
Chapter 1 ... 24
Development of Quantitative Analysis Techniques for Saccharification Reactions Using Raman Spectroscopy ... 24
Abstract ... 24
Introduction ... 25
Materials and methods ... 27
Enzyme assay ... 27
Preparation of model mixtures ... 27
Raman measurement ... 28
Chemometrics analysis ... 28
Result and Discussion ... 29
Conclusion ... 34
References ... 35
Figures... 38
Supplementary information: Detailed description of PLSR models... 44
Chapter 2 ... 47
Application of Imaging Raman Spectroscopy to study the Distribution of Kappa Carrageenan in the Seaweed Kappaphycus alvarezii ... 47
3
Introduction ... 48
Material and method ... 50
Sample Preparation ... 50 Raman Measurement ... 51 Chemometrics analysis ... 51 Results ... 52 Discussion ... 53 Conclusion ... 56 References ... 57 Figures... 61 Chapter 3 ... 70
Bacterial decomposition of Seaweed Kappaphycus Alvarezii studied by 3D Raman Imaging Spectroscopy ... 70
Abstract ... 70
Introduction ... 71
Material and method ... 73
Bacterial screening ... 73
Enzymatic assays... 74
Infection of K. alvarezii by selected bacterial strains... 74
Bacterial Identification ... 75 Raman spectroscopy ... 76 Chemometrics analysis ... 76 Results ... 77 Discussion ... 80 Conclusion ... 82 References ... 83 Figures... 88 List of Publication ... 98 Paper ... 98 Conference ... 98 Acknowledgment ... 100
4
Introduction Background
The general purpose of this study is to develop a new research technology to study reactions in marine algae and interactions between the algae and bacteria, which cause seaweed disease. The development of an accurate and effective technique was motivated in order to solve the problems in seaweed farming caused by the effect of the surrounding environment, such as bacterial infection.
Indonesia is one of the top seaweed producing countries in the world with the national seaweed production capacity up to 10 million tons in 2014 (FAO, 2016). Red algal seaweed K.
alvarezii is an abundant and important commodity in Indonesia (Ask, 2001). Indonesia is a tropical
archipelago that has many potential areas for seaweed farming. There are four largest seaweed farming areas in Indonesia: Karimujawa, Sulawesi, Bali, and Sumba (Soegiarto and Sulustijo, 1990; Manuhara et al. 2016). Seaweed K. alvarezii is a major source of industrial use of kappa type carrageenan.
Carrageenan
Carrageenan is a sulfated linear polysaccharide accumulated in Rhodophyceae (Normah and Nazarifah, 2003). The kappa carrageenan consists of D-galactose-4-sulfate and 3,6 anhydrous D-galactose residues linked with the β (1,4) and α (1,3) carbon bonds. Sulfate accounts for about 20%–35% of the molecular weight (fig. 1; Lechat et al. 1997; campo et al. 2009; Necas and Bartosikova, 2013; Rhein-Knudsen 2015; Cunha and Grenha, 2016). Kappa carrageenan possesses a strong gelling property, which is reversibly liquefied depending on the temperature, and is one of the valuable materials required for dairy and other products (Distantina et al. 2011). The
5
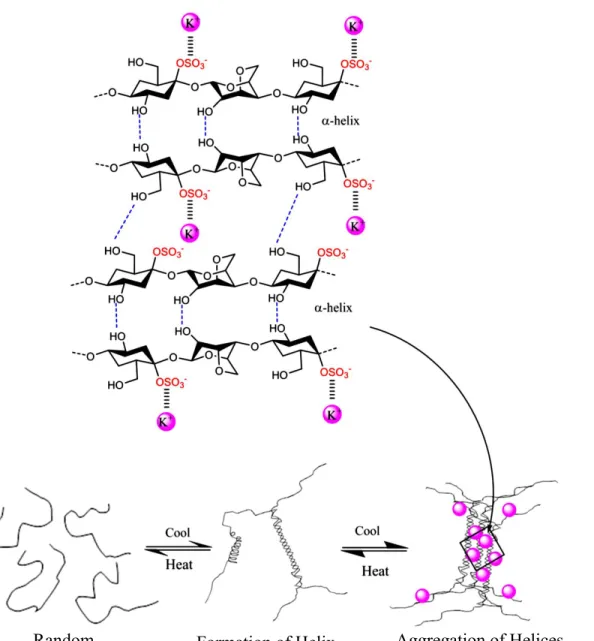
molecular structure of carrageenan is at high temperature akin to a random coil, but at a low temperature adopts a helical structure while in the presence of potassium at the low temperature, it will form aggregation of helices (fig. 2) (Rhein-Knudsen et al., 2015).
Advantages of carrageenan
Carrageenan has many useful properties in several biological and industrial applications. Carrageenan plays important biological roles in immunomodulatory, anticoagulant, antithrombotic, antiviral, and antitumor responses (Necas and Bartosikova, 2013). Carrageenan has been used for anti-inflammatory in rat paw edema (Sugishita et al. 1981; Henriques et al. 1987; Jain et al. 2001; Paschapur et al. 2009; Petersson et al. 2001; Sini et al. 2010). Carrageenan is a sulfated polysaccharide with the ability to function as an anticoagulant due to the sulfate content (Shanmugam and Mody, 2000). Furthermore, Carrageenan was also reported to be a selective inhibitor of several enveloped viruses, including human pathogens, such as human immunodeficiency virus (HIV), herpes simplex virus (HSV), human cytomegalovirus, human rhinoviruses, and others (Girond et al. 1991; Marchetti et al. 1995; Carlucci et al. 1999; Caceres et al. 2000; Zacharopoulos and Phillips, 1997; Stiles et al. 2008). In the industry, carrageenan has been widely used as a gelling, stabilizing, and thickening additive in food, cosmetics, and industrial pharmacy products. Especially in the food and pharmaceutical industries, carrageenan has been applied for cell immobilization in a fermentation batch reactor (Asanza-Teruel et al. 1997; Nigam, 2000). Finally, carrageenan is used in air freshener gels, toothpaste, firefighting foam, shampoo, cosmetic creams, and shoe polish (Necas and Bartosikova, 2013). Due to all these properties and functions, carrageenan is of high demand in many industries with the annual global market of carrageenan was up to 762.35 million USD in 2013.
6
Problem in seaweed farming
Since the cost of the production of carrageenan depends on the yield from the algal body, the quality of the seaweed simply refers to the yield of carrageenan, which is usually about 50% in dry weight of the seaweed. The production efficiency and carrageenan distribution in the algal body have not been studied in detail yet. Besides, instability of environmental conditions remains an uncontrollable factor for carrageenan production, i.e., temperature, pH, salinity, and, importantly, disease. The seaweed disease is one of the formidable problems in seaweed plantation. “Ice–ice” disease is the most famous seaweed disease caused by a bacterial pathogen. Ice-ice disease leads to a characteristic whitening and softening of the infected part of the algal body and causes fragmentation of the plant (Mendoza et al. 2002). Environmental conditions play important roles in the infection of bacterial pathogen in seaweed farming (Case et al. 2011).
Global warming is the most critical environmental issue imposing significant negative effects on aquaculture (Harley et al. 2012). Increasing global concentrations of atmospheric CO2
making glass house effects that affect increasing seawater temperature and marine acidification (Wootton et al. 2008, Harley 2011). Brown (1995) reported that increasing temperature and salinity suppress the growth of the algal body and carrageenan production in seaweed Solieria
chordalis. This is due to the alteration in ocean conditions, which leads bacterial infection of the
seaweed, especially during mass farming in a plantation. Decreasing seaweed production in the Philippines is due to ice-ice disease, as reported by Largo et al. (1995). The Ice-ice disease causes loss of the seaweed thallus stimulating cell wall degradation by enzymes produced by bacterial pathogens (Distel et al. 2002; Weiner et al. 2008). Bacteria belonging to the genera Vibrio,
Alteromonas, Cytophaga, Flavobacterium, and Pseudoalteromonas produce enzymes capable of
depolymerizing polysaccharides (Goecke et al. 2010). Bacterial interaction on seaweed body was facilitated by bacterial quorum sensing (QS) system such as biofilm formation, bioluminescence,
7
secondary metabolite production, motility, and virulence functions (Atkinson and Williams, 2009). On the other hand, many studies have reported that seaweed produces QS inhibitors to interrupt communication circuit in bacteria resulting inhibition of gene expression and colonization phenotype (Gonzalez and Keshavan, 2006). The ability to overcome bacterial pathogen interference, macroalgae produce QS inhibitor such as: hypobromus acid produced by brown macrolaga that able to interferes with QS regulated gene expression by deactivating acylated homoserine-lactone (AHL) signal; halogenate furanones from red macroalga Delisea pulchra, which act as AHL signal and inhibit gene expression; betocinine, floridoside and isethionic acid produced by Ahnfeltiopsis flabeliformis, which can modulate gene expression by competing AHL signal (Egan et al. 2014)
Study of seaweed with vibrational spectroscopy
A rapid and effective analytical tool is necessary to study the process occurring during bacterial invasion into the algal body in order to control bacterial infection on seaweed. The problems and the current situation in this research field motivated me to apply vibrational spectroscopy to investigate enzymatic reaction in seaweed body. Vibrational spectroscopy has a several advantages, such as being non-destructive, environmental friendly, requiring minimal or no sample preparation, and short period of time measurement (Teixeira dos Santos et al. 2016). Vibrational spectroscopy observes interactions between the vibrational motions of a molecule and photons irradiated towards the molecule. The vibrational modes of the molecule is observed by infrared (IR), near-infrared (NIR) and Raman spectroscopies (Ferraro et al. 2003). IR spectroscopy is a form of absorption spectroscopy, which follows the Beer-Lambert law. In contrast, Raman spectroscopy measures scattered light energy, which does not follow the law (Ferraro et al. 2003). Seaweed and carrageenan has been extensively studied using vibrational spectroscopy. For
8
example, infrared spectroscopy was applied for characterizing carrageenan in 1968 by Anderson et al. while Raman spectroscopy was utilized for the same task 20 years later by Malfait et al. in 1987. The studies were made on extracted and purified carrageenan molecules. IR and Raman spectroscopies were applied for the characterization of chemical contents in several types of dried and grounded seaweed by Pereira et al. (2009, 2011, and 2013) and Rodrigues et al. (2015). Of particular interest is that de Vega et al. (2017) studied the distribution of carrageenan in fresh algal body by fluorescent microscopy by labeling carrageenan with fluorochrome. However, this labeling method is difficult to apply to the quantitative analysis of bacterial degradation of carrageenan, because it is quite difficult to make perfectly homogeneous staining of the pigment of the inhomogeneous algal body.
The limitation of vibrational spectroscopy for plant sample
The application of IR and Raman spectroscopies has some limitations for fresh plant materials (Gierlinger and Schwanninger, 2007). IR and NIR spectra have a strong interference from water as water has strong absorption bands all over the spectral area due to its large dipole moment. In contrast, Raman spectroscopy has low interference of water in the sample, which gives a large advantage in its application of characterizing biological samples. The major disadvantage of Raman spectroscopy is the inherent fluorescence of photosynthetic pigments, such as chlorophyll and carotenoids, existing in the plant body. Chlorophyll and carotenoid are usually abundant in plant samples and are part of the light-harvesting proteins of photosynthetic organisms (Kish et al. 2016). Their fluorescence is often observed in the Raman spectra, when the energy of excitation light is greater than the transition energy between the lowest electronic levels. The scattering cross-section of Raman scattered light is less than 10-7, which is smaller by 5 to 6 orders
9
A resonance enhancement effect is another issue created by the presence of the photosynthetic pigments. The resonance effect is often observed when the wavelength of excitation laser is within or close to the electronic absorption band. The order of the enhancement is up to 103-105 (Ferraro et al, 2003). The strong resonant bands can overwhelm the bands of interest, in
this case the plant body materials. The resonance Raman effect was widely used to study natural pigments (Sato et al. 1995a, 1995b; Ruban et al. 1995; Kish et al. 2016). The natural pigments of biological samples were studied using several different excitation lasers, for example 488 nm for carotenoid, 441.6 nm for chlorophyll a and b, and 413.1 nm for chlorophyll a and carotenoid (Ruban et al. 1995).
The fluorescence effect is often observed when a visible laser is used, but a NIR light is able to reduce the fluorescence effect. An application of 1064 nm laser combined with a Fourier-transform spectrometer allowed the avoidance of fluorescent interference. The technique was referred to as near infrared Fourier Transform (NIR-FT) Raman spectroscopy and applied to plant samples (Hirschfeld Chase, 1986; Sato et al. 1995a; 1995b). Use of NIR-FT Raman spectroscopy has several disadvantages, i.e., lowering in spatial resolution, low sensitivity, and thermal emission effect (Schrader et al. 1991). In the present study, Raman spectroscopy imaging combining with chemometrics analysis was used to investigate enzymatic polysaccharide degradation activity in the algal body in spite of the challenge of the fluorescence effect from such samples.
Chemometric Analysis
Chemometrics is aimed at extracting relevant chemical information out of the measurements by employing various statistical algorithms to all types of analytical data. However, Raman spectroscopy is rarely applied for quantitative analysis because it is quite difficult to obtain the absolute intensity of a signal. Unlike IR and NIR spectroscopies, the spectral intensity of a
10
Raman spectrum depends on many factors, such as laser power, focal distance from the sampling point, and optical throughput of the Raman spectrometer. IR and NIR spectroscopies are forms of absorption spectroscopy in which the Beer-Lambert law is applied for the quantitative analysis. Chemometric analysis in Raman spectra is achieved by so-called spectral processing. Processing of spectra normally consists of minor manipulation, such as smoothing, averaging, mean centering, baseline removal, zeroing baseline, and normalization (Ferraro et al, 2003). However, in the case of imaging Raman spectroscopy that produces about 10.000 to 100.000 spectra within one sample, this seems difficult to analyze. In this study, I have employed and improved several spectral processing techniques to overcome this problem. New spectral processing software has been developed for interpolation, background subtraction, baseline correction, and internal standard normalization with MatLab R2007b (The Mathwork, Inc, US). The interpolation process increases number of sampling points by adding artificially calculated data using polynomial fitting. The background subtraction removes unnecessary spectral interferences due to water, glass dish, stray lights, and so on, from the raw data. As mentioned previously, auto-fluorescence often observed from natural pigment in biological samples. To remove interference due to the baseline undulations by the auto-fluorescence, dark current of the charge-coupled device (CCD) detector, and other instrumental noise, a sixth order polynomial curve fitting method is applied. In order to compare spectral intensity from one sample to another, internal standard normalization is applied. In absorption spectroscopy, many normalization techniques have been reported, including vector normalization, min-max normalization, and multiplicative scatter correction (Bag et al. 2011). Unfortunately, it is impossible to apply most of those techniques because the Beer-Lambert law is not applicable to emission spectroscopy methods, such as Raman spectroscopy. I have applied a normalization technique using a single major sharing band, which is due to a well-known material
11
in the sample as a standard. Therefore, the quantitative analysis in the present research is semi-quantitative analysis in which the concentration of the target material is relative to the material that corresponds to the standard band.
Partial Least Square Regression (PLSR) analysis is a qualitative technique often used in the present study, as it is more robust than other least square methods, such as classical least square (CLS) analysis. The PLSR analysis requires a number of test samples to create a calibration curve, but it is stable against perturbations and noise in Raman data and therefore especially suitable for data obtained from biological samples. The PLSR analysis is a technique used to obtain the most suitable calibration model to fit both the X- and Y-matrices simultaneously by selecting latent (or hidden) variables in X, which gives best prediction of the latent variables in Y (Wold et al. 2001). The model were made from the most significant component extracted from all data set of Raman spectra. Cross Validation were employed to test the predictive significance and determine the number of components (Wold et al. 2001). Unlike the CLS method that requires full knowledge of all components in the test samples of the measured system, the PLSR method can work with only knowledge of the substance or material of interest (Nadler and Ronald, 2005). On the other hand, to make a robust quantitative analysis using PLSR method, a huge number of test samples are required to build PLSR model due to a complex multicomponent system in the sample (Nadler and Ronald, 2005).
Synopsis of the work described in each chapter of the thesis
This study consists of three chapters. The aim of this research was to develop a new analytical technique to improve aquaculture production. In the chapter 1, I will demonstrate a robust and low cost quantitative analysis to monitor a starch degrading enzyme reaction. Decreasing the number of PLSR model is my strategy to lower the cost of the analytical technique.
12
Using PLSR is usually regarded as an irregular procedure, as it may reduce the reliability of the quantitative model. I have found that the selection of the band area in the Raman spectra is able to improve the prediction model, because of its increasing specificity even with a small number of the test samples.
Amylase enzymes are used in this study because of their simple enzymatic functions. Amylase hydrolyzes the common amylose into small sugars, such as maltose and glucose. Enzymatic components in amylase system (starch, maltose and glucose) have simple Raman spectra. The selected enzymatic system is my strategy to study the activity in the algal body, because, Raman spectra of seaweed K. alvarezii also consists of relatively simple components. The ability of Raman spectroscopy to analyze the speed of enzymatic reactions in a cell-sized volume is discussed.
In chapter 2, the morphology and carrageenan distribution of K. alvarezii was studied with 3 dimensional (3D) Raman image technique to obtain basic knowledge of carrageenan production in the algal body. Good quality K. alvarezii contains about 40-50% of carrageenan in dried weight. Imaging Raman spectroscopy combined with PLSR analysis was employed to predict the concentration of carrageenan in algal body. The PLSR model was built using only 11 test samples following my previous study (chapter 1). The hyperspectral images consist of a number of Raman spectra that was measured at several thousand sampling points in the sample. The sampling points were aligned with several 50 to 250 μm intervals in the X-, Y-, and Z-axis in the measured area. I demonstrate the potential of the 3D Raman image in the investigation of distribution and concentration of carrageenan in the algal body. The issue of fluorescence interference is overcome by reducing the naturally occurring pigments by photo-degradation during the sun-drying
13
procedure of the seaweed. The concentrations of rich and poor carrageenan branches of K. alvarezii were described in this chapter.
In chapter 3, the techniques developed in chapters 1 and 2 were evaluated with practical samples. The enzymatic activity was studied in seaweed body during the decomposition due to microorganisms. I searched a naturally decomposed K. alvarezii sample to collect bacteria having an enzyme to decompose carrageenan. The bacteria were selected by culturing in a low nutrient environment with carrageenan as the sole source of carbon to find bacteria producing a crude external enzyme. The degradation process of the algal body by the bacteria was then studied with the developed techniques, in which decomposition of carrageenan was quantitatively investigated in order to estimate the process of bacterial invasion and decomposition the algal body.
14
References
Anderson WS, Dolan TCS, Penman A, Rees DA, Muller GP, Stancioff GP, Stanley NF (1968) Carrageenans. Part IV. Variations in the structure and gel properties of κ-carrageenan, and the characterization of sulphate esters by infrared spectroscopy. J Chem Soc C: 602-606.
Asanza-Teruel ML, Gontier E, Bienaime C, Nava-Saucedo JE, Barbotin JN (1997) Response surface analysis of chlortetracycline and tetracycline production with κ-carrageenan immobilized Streptomyces aureofaciens. Enzyme Microb Technol 21: 314–320.
Ask EI, Batibasaga A, Zertuche-González JA, San M de (2003) Three decades of Kappaphycus
alvarezii (Rhodophyta) introduction to non-endemic locations. Proceedings of the 17th
International Seaweed Symposium, South Africa, pp 49-57.
Atkinson S, and Williams P (2009) Quorum sensing and social networking in the microbial world. J R Soc Interface 6: 959–978.
Bag SK, Srivastav PP, Mishra HN (2011) FT-NIR Spectroscopy: A Rapid Method for Estimation of Moisture Content in Bael Pulp. Brit Food J 113(4): 494-504.
Brown MT (1995) Interactions between environmental variables on growth-rate and carrageenan content of Solieria chordalis (Solieriaceae, Rhodophyceae) in culture. J Appl Phycol 7: 427-432.
Caceres PJ, Carlucci MJ, Damonte EB, Matsuhiro B, Zuniga EA (2000) Carrageenans from chilean samples of Stenogramme interrupta (Phyllophoraceae): structural analysis and biological activity. Phytochem 53: 81–86.
15
Campo VL, Kawano DF, da Silva Jr DB, Carvalho I (2009) Carrageenans: Biological properties, chemical modifications and structural analysis– A review. Carbohydr Polym 77:167–180.
Carlucci MJ, Scolaro LA, Damonte EB (1999) Inhibitory action of natural carrageenans on Herpes
simplex virus infection of mouse astrocytes. Chemother 45: 429–436.
Cunha L, Grenha A (2016) Sulfated seaweed polysaccharides as multifunctional materials in drug delivery applications. Mar Drugs 14:42.
de Vega GB, Ceballos JA, Anzalone A, Digman MA, Gratton E (2017) A laser-scanning confocal microscopy study of carrageenan in red algae from seaweed farms near the Caribbean entrance of the Panama Canal. J Appl Phycol 29:495–508.
Distantina P, Wiratni, Fahrurrozi M, Rochmadi (2011) Carrageenan Properties Extracted from
Eucheuma cottonii, Indonesia. Int J Chem Mol Eng 5:6.
Distel DL, Morrill W, MacLaren-Toussaint N, Franks D, Waterbury J (2002) Teredinibacter turnerae gen. nov., sp. nov., a dinitrogen-fixing, cellulolytic, endosymbiotic gamma-proteobacterium isolated from the gills of wood boring molluscs (Bivalvia: Teredinidae). Int J Syst Evol Microbiol 52: 2261–69.
Egan S, Fernandes ND, Kumar V, Gardiner M, Thomas T (2014) Bacterial pathogens, virulence mechanism and host defense in marine macroalgae – minireview. Environ Microbiol 16(4): 925–938.
Egan S, Harder T, Burke C, Steinberg P, Kjelleberg S, Thomas T (2013) The seaweed holobiont: understanding seaweed-bacteria interactions. FEMS Microbiol Rev 37: 462–476.
16
Egan S, Fernandes ND, Kumar V, Gardiner M, Thomas T (2014) Bacterial pathogen, virulence, mechanism and host defence in marine macroalgae. Environ Mibrobiol 16 (4): 925-938.
Ferraro JR, Nakamoto K, Brown CW (2003) Introduction Raman Spectroscopy. Academic Press, New York.
Gierlinger N, Schwanninger M (2007) The potential of Raman microscopy and Raman imaging in plant research. Spec 21: 69–89.
Girond S, Crance JM, Van Cuyck-Gandre H, Renaudet J, Deloince R (1991) Antiviral activity of carrageenan on hepatitis A virus replication in cell culture. Res Virol 142: 261–270.
Goecke F, Labes A, Wiese J, Imhoff J (2010) Chemical interactions between marine macroalgae and bacteria. Mar Ecol Prog Ser 409: 267–299.
Gonzalez JE, Keshavan ND (2006) Messing with bacterial quorum sensing. Microbiol Mol Biol Rev 70: 859-875.
Harley CDG (2011) Climate change, keystone predation, and biodiversity loss. Sci 334:1124–7.
Harley CDG, Anderson KM, Demes KW, Jorve JP, Kordas RL, Coyle TA, Effects of climate change on global seaweed communities. J Phycol 48: 1064–1078.
Henriques MGMO, Silva PMR, Martins MA, Flores CA, Cunha FQ, Assreuy-Filho J, Cordeiro RSB (1987) Mouse paw oedema. A new model for inflammation? Braz J Med Biol Res 20: 243–249.
Hirschfeld T, Chase B (1986) FT-Raman spectroscopy: development and justification. Appl Spec 40(2): 133 – 137.
17
Jain NK, Patil CS, Singh A, Kulkarni SK (2001) A simple technique to evaluate inflammatory pain along with anti-inflammatory studies in carrageenan-induced paw edema. Indian J Pharmacol 33: 114–115.
Karsten U, Bischof K, Wiencke C (2001) Photosynthetic performance of Arctic macroalgae after transplantation from deep to shallow waters. Oecologia 127: 11–20.
Kish E, Wang K, Llansola-Portoles MJ, Ilioaia C, Pascal AA, Robert B, Yang C (2016) Probing the pigment binding sites in LHCII with resonance Raman spectroscopy: The effect of mutations at S123. Biochim Biophys Acta 1875: 1490–1496.
Largo DB, Fukami K, Nishijima T, Ohno M (1995) Laboratory-induced development of the ice-ice disease of the farmed red algae Kappaphycus alvarezii and Eucheuma denticulatum (Solieriaceae, Gigartinales, Rhodophyta). J Appl Phycol 7: 539-543.
Lechat H, Amat H, Mazoyer J, Gallant DJ, Buléon A, Lahaye M (1997) Cell wall composition of the carrageenophyte Kappaphycus alvarezii (Gigartinales, Rhodophyta) partitioned by wet sieving. J Appl Phycol 9:565–572.
Malfait T, Van Dael H, Van Cauwelaert F (1987) Raman spectroscopic analysis of the sodium salt of kappa-carrageenan and related compounds in solution. Carbohydr Res 163: 9–14.
Manuhara GJ, Praseptiangga D, Riyanto RA (2016) Extraction and characterization of refined κ-carrageenan of red algae [Kappaphycus alvarezii (Doty ex P.C. Silva, 1996)] originated from Karimun Jawa Islands. Aquat Procedia 7:106 – 111.
18
Marchetti M, Pisani S, Pietropaolo V, Seganti L, Nicoletti R, Orsi N (1995): Inhibition of Herpes
simplex virus infection by negatively charged and neutral carbohydrate polymers. J
Chemother 7: 90–96.
Mendoza WG, Montaño NE, Ganzon-Fortes ET, Villanueva RD (2002) Chemical and gelling profile of ice-ice infected carrageenan from Kappaphycus striatum (Schmitz) Doty “sacol” strain (Solieriaceae, Gigartinales, Rhodophyta). J Appl Phycol 14: 409.
Nadler B, Coifman RR (2005) The prediction error in CLS and PLS: the importance of feature selection prior to multivariate calibration. J Chemom 19:107–118.
Necas J, Bartosikova L (2013) Carrageenan: A review. Vet Med 58(4):187–205.
Normah O, Nazarifah I (2003) Production of semi-refined carrageenan from locally available red seaweed, Eucheuma cottonii on a laboratory scale. J Trop Agric and Fd Sc 31(2):207–213.
Paschapur MS, Patil MB, Kumar R, Patil SR (2009) Evaluation of anti-inflammatory activity of ethanolic extract of Borassus flabellifer L. male flowers (inflorescences) in experimental animals. J Med Plants Res 2: 49–54.
Pereira L, Amado AM, Critchley AT, van de Velde F, Ribeiro-Claro PJA (2009) Identification of selected seaweed polysaccharides (phycocolloids) by vibrational spectroscopy (FTIR-ATR and FT-Raman). Food Hydrocoll 30:1-7.
Pereira L, Gheda SF, Ribeiro-Claro PJA (2013) Analysis by vibrational spectroscopy of seaweed polysaccharides with potential use in food, pharmaceutical, and cosmetic industries. Int J Carbohydr Chem 2013: 7p.
19
Pereira L, Sousa A, Coelho H, Amado AM, Ribeiro-Claro PJA (2003) Use of FTIR, FT-Raman and 13C-NMR spectroscopy for identification of some seaweed phycocolloids. Biomol Eng 20:223-228.
Potin P, Richard C, Barbeyron T, Henrissat B, Gey C, Petillot Y, Forest E, Dideberg O, Rochas C, Kloareg B (1995) Processing and hydrolytic mechanism of the cgkA-encoded κ-carrageenase of Alteromonas carrageenovora. Eur J Biochem 228: 971–975.
Rhein-Knudsen N, Ale MT, Meyer AS (2015) Seaweed hydrocolloid production: An update on enzyme assisted extraction and modification technologies. Mar Drugs 13:3340-3359.
Rodrigues D, Sousa S, Silva A, Amorim M, Pereira L, Rocha-Santos TA, Gomes AM, Duarte AC, Freitas AC (2015) Impact of enzyme- and ultrasound-assisted extraction methods on biological properties of red, brown, and green seaweeds from the central west coast of Portugal. J Agric Food Chem 63(12): 3177-3188.
Ruban AV, Horton P, Robert B (1995) Resonance Raman spectroscopy of the photosystem i1 light-harvesting complex of green plants: a comparison of trimeric and aggregated states. Biochem 34: 2333-2337.
Sato H, Okada K, Ueharaan K, Ozaki Y (1995a) Near-Infrared Fourier-Transform Raman study of chlorophyll a in solutions. Photochem Photobiol 61(2): 175-182.
Sato H, Uehara K, Ishii T, Ozaki Y (1995b) FT-IR and Near-Infrared FT-Raman study of aggregation of bacteriochlorophyll c in solutions: evidence for involvement of the ester group in the aggregation. Biochem 34: 7854-7860.
20
Schrader B, Hoffmann A, Simon A Sawatzki J (1991) Can a Raman renaissance be expected via the near-Infrared Fourier-Transform technique. Vib Spectrosc 1(3): 239–250.
Shanmugam M, Mody KH (2000) Heparinoid-active sulphated polysaccharides from marine algae as potential blood anticoagulant agents. Curr Sci 79: 1672–1683.
Sini JM, Yaro AH, Ayanwuyi LO, Aiyelero OM, Mallum SM, Gamaniel KS (2010) Antinociceptive and anti-inflammatory activities of the aqueous extract of the root bark of Combretumsericeum in rodents. Afr J Biotechnol 9: 8872–76.
Soegiarto A, Sulustijo (1990) Utilization and farming of seaweeds in Indonesia. In Dogma IJ Jr, Trono GC Jr, Tabbada RA (Ed) Culture and use of algae in southeast Asia, Proceedings of the Symposium on Culture and Utilization of Algae in Southeast Asia, 8-11 December 1981, Philippines, pp 9-19
Stiles J, Guptill-Yoran L, Moore GE, Pogranichniy RM (2008) Effects of κ-carrageenan on in vitro replication of feline herpesvirus and on experimentally induced herpetic conjunctivitis in cats. Invest Ophthalmol Vis Sci 49: 1496–1501.
Sugishita E, Amagaya S, Ogihara Y (1981) Anti-inflammatory testing methods: comparative evaluation of mice and rats. J Pharmacobio-Dyn 8: 565–575.
Teixeira dos Santos CA, Páscoa RNMJ, Lopes JA (2017) A review on the application of vibrational spectroscopy in the wine industry: from soil to bottle. Trend Anal Chem 88:100-108.
Toohey BD, Kendrick GA (2007) Survival of juvenile Ecklonia radiata sporophytes after canopy loss. J Exp Mar Biol Ecol 349: 170–182.
21
Wahl M, Goecke F, Labes A, Dobretsov S, Weinberger F (2012) The second skin: ecological role of epibiotic biofilms on marine organisms. Front Microbiol 3: 292.
Weiner RM, Taylor LE, Henrissat B, Hauser L, Land M, Coutinho PM, et al. (2008) Complete genome sequence of the complex carbohydrate-degrading marine bacterium,
Saccharophagus degradans strain 2-40T. PLoS Genet 4: e1000087.
Wold S, Sjöström M, Eriksson L (2001) PLS-regression: a basic tool of chemometrics. Chemometr Intell Lab Syst 58: 109-130.
Wootton JT, Pfister CA, Forester JD (2008) Dynamic patterns and ecological impacts of declining ocean pH in a high-resolution multi-year dataset. Proc Nat Acad Sci 105:18848–53.
Zacharopoulos VR, Phillips DM (1997) Vaginal formulations of carrageenan protect mice from
22
Figures
Fig 1. Chemical structure of monomer unit in kappa (κ)-carrageenan.
n
O
α
1
4
β
1
3
23
Fig 2. Phase transition of κ-carrageenan into three gel structures (Rhein-Knudsen et al. 2015).
Random
Coil Formation of Helix
24
Chapter 1
Development of Quantitative Analysis Techniques for Saccharification Reactions Using Raman Spectroscopy
Abstract
A low cost and robust quantitative analysis to quantify each enzymatic component using Raman spectroscopy were describe in this study. It is a micro-volume, quantitative, and in situ technique, which can be used for studying saccharification processes in plant tissues. Prediction models for quantitative analysis of maltose, glucose, and starch were built with partial least square regression (PLSR) analysis to monitor the saccharification process caused by α-amylase. We examined the reliability of the prediction models built with a small number of test samples, only 7 samples. The spectral regions used to build the models were optimized for each sugar and were selected in such a manner that they did not overlap with strong protein and lipid bands that generally exist in plant tissues. The models were validated by monitoring the composition of reducing sugars and starch in a reactor and comparing the results with those obtained by a conventional method. The results of Raman analysis and the conventional method showed good agreement for the reaction with α-amylase; however, it is not perfect for reactions with a different enzyme, especially β-amylase. The results suggest that the present Raman technique is reliable and useful for sugar analysis; however, the prediction model built for a specific enzyme is valid only for that enzyme.
Keywords
25
Introduction
Sugar production through enzymatic reactions comprises a large sector of the food and beverage industries worldwide (Sugar and Bour, 2016). Generally, source of sugar production by enzymatic reaction is polysaccharide of biomass (Binder and Raines, 2010). The process of hydrolytic degradation for polysaccharides into simple sugar is referred to as saccharification. The main sugar components can be categorized as sucrose, glucose, fructose, and maltose. Sugar composition is essential for many physical properties, such as hygroscopic affinity, granulation, viscosity, and energy value (Ouchemoukh et al. 2010). However, independent determination of glucose and maltose in sugar is difficult when conventional methods are used. Nearly 40%–90% of maltose found in maltose syrups is purified starch hydrolysate (Gaouar et al. 1998). Pure maltose has been employed in the manufacture of vaccines, food, maltitol, antibiotics, etc., for which crystallized maltose purified from syrups is often used (Okada and Nakakuki, 1992). Studies on corn and rice for starch production have already been conducted by several researchers. Maize (corn) kernels are a major raw material for sugar and chemical production, with starch providing up to 70%–74% of the kernel weight (Shobha et al. 2010). Rice, a staple food of Asian countries, contains up to almost 80% starch (Mohan et al. 2005). The main enzymes used in the industry are amylases that hydrolyze the 1,4-glycosidic bond. Amylases converts starch molecules into smaller oligosaccharides and glucose. The major sources of α-amylases are plants, animals, microorganisms, and algae (de Souza and Magalhaes, 2010). Hence, it is necessary to analyze the saccharification process quantitatively in biomasss, to investigate the effective saccharification process, especially localized enzymatic reaction in cellular level.
Raman spectroscopy is one of the most promising noninvasive methods for observing the distribution of carrageenan in situ. It is a sensitive and reliable tool for determining biochemical
26
changes in biological samples, with no need for any labeling or chemical purification processes. In addition, the applications of Raman spectroscopy can be expanded with other techniques, such as Raman imaging and remote measurement with Raman probes (Katagiri et al. 2009; Komachi et al. 2005; Hattori et al. 2007). In this study, we aimed to develop a technique for quantitative analysis of localized saccharides produced by a specific enzyme, which requires small sample volumes based on Raman spectroscopy using multivariate analysis. The capability and accuracy of the technique were evaluated and discussed. Although the main target of the analysis was reaction with α-amylase, the feasibility of the analytical model to β-amylase was also examined. With conventional methods that analyze reducing sugars, it is difficult to measure glucose and maltose independently (Tihomirova et al. 2016). High-performance liquid chromatography (HPLC) is often used for the quantitative analysis of specific saccharides (Meyer et al. 2001; Xi et al. 2016; Ai et al. 2016). Özbalci et al. (2013) revealed that Raman spectroscopy can be used to quantify glucose, fructose, sucrose, and maltose contents independently in honey samples. Hence, Raman spectroscopy has high viability for the present purpose, i.e., for nondestructive, real-time, micro-volume, and quantitative analysis, which would be reliable for sugar analysis. PLSR analysis was employed for the purpose, because it is more robust than other least square methods, such as classical least square (CLS) analysis, to perturbations and noise. However, PLSR analysis requires building a robust prediction model for targeted material. For conducting saccharification of starch into glucose and maltose, independent prediction models are required for each targeted sugar. Moreover, collinearity of the materials must be avoided in the test samples to build the prediction model. To analyze glucose, maltose, and starch independently, an extremely large number of test samples is required. Hence, we have attempted to reduce the number of test sample in the present study, because we are considering a specific enzyme. The enzyme always has its
27
specific reaction pattern, the model could be much simpler. In the present study, we have examined the feasibility of a simple PLSR model built with a small number of test samples in the empirical condition with Raman spectra, which have strong noise and perturbation, such as baseline undulation due to fluorescence and white noise due to weak Raman scattered light.
Materials and methods Enzyme assay
Alpha-amylase (EC 3.2.1.1) enzyme from Aspergillus oryzae and β-amylase (EC 3.2.1.2, Sigma–Aldrich) were purchased. Fresh soluble starch, D-glucose, and maltose (Wako Pure Chem.
Ind. Ltd., Japan) were also purchased and used without further purification. The enzymatic reaction of α-amylase was conducted at room temperature, while β-amylase was reacted at 20°C. The α and β-amylase activity were estimated based on the amount of reducing sugar produced from starch by using the Miller method.17 Soluble starch (10,000 mg/L) in phosphate buffer (pH 7.0) was
preheated at 60°C for 5 min before adding 150 unit/mg α-amylase or β-amylase. The reaction mixture was incubated for 2 h, and the samples were taken at 0, 1, 3, 5, 10, 15, 30, 45, 60, 90, and 120 min from the reaction container. A small portion picked up during the reaction was immediately mixed with dinitrosalicylic acid (DNSA) and boiled at 100°C for 10 min following Miller’s (1959) procedure. The samples were then transferred to a UV spectrometer to measure absorption at 540 nm to quantify the sugar production. The other portion picked up for the Raman measurement was boiled for only 5 min to denature the enzyme.
Preparation of model mixtures
Model mixtures for estimating the enzymatic component (starch, D-glucose, and maltose)
28
or maltose; 0–8,000 mg/L) in phosphate buffer (pH 7.0). The concentrations of these materials in the model series are listed in Table 1. Aliquots (5 μL) from models and enzymatic reactions were dropped onto a quartz bottomed disk (27 mm in diameter) and dried by using a vacuum desiccator for 5 min. Samples were then analyzed by Raman spectroscopy.
Raman measurement
The Raman measurement of the samples was carried out by using a homemade confocal Raman system. The system was equipped with an inverted microscope (IX73, Olympus, Japan), a polychromator (Grating: 600 l/mm, 750 nm-blazed, f = 320 mm, Photon Design Co., Japan), a cooled CCD detector (DU401-BR-DD, Andor Technology), and a diode laser (785 nm, Toptica, Germany). A water-immersed objective lens (×60, NA 1.2; Olympus, Tokyo, Japan) was used for the measurements. The exposure time was 10 s × 3 times with excitation light, 60 mW at the sample point. Thirty spectra were collected from each sample over a range of 320–1950 cm-1.
Chemometrics analysis
Raw spectra were pretreated for background correction to remove the effect of the quartz window. To remove dark noise and fluorescence caused by impurities, a sixth-order polynomial baseline correction was employed. The spectra were smoothed by a second-order polynomial (Savitzky–Golay algorithm) with five points on both frequency sides. The spectra were then normalized with a band at 1263 cm-1, which was assigned to the CH2 bending mode. All spectral
processing data was atomized by my own software build in MatLab R2007b (The Mathwork, Inc, US). Partial least square regression (PLSR) analysis was performed by using the Unscrambler 10.1 software (CAMO Software AS., Oslo, Norway).
29
Result and Discussion
Starch is hydrolyzed into smaller sugars by α-amylase. The enzymatic reaction takes place randomly on starch, a polysaccharide, and produces the oligosaccharides, maltose, and glucose. In this study, a method to monitor this reaction quantitatively was developed using Raman spectroscopy. The purpose in this chapter is to measure the glycation reaction caused by amylase in plant materials; therefore, it is necessary to analyze the reaction per cells size (1-5 µm). The confocal Raman microscope employed in this research was equipped with an object lens with NA 1.2. The highest spatial resolution of this objective lens was estimated to be 0.80 µm. Meanwhile, the spatial resolution estimated from the confocal configuration is 0.98 μm, because the diameter of the confocal pinhole was 65 μm, with a 200-mm focusing lens, and a focusing distance (of the objective lens) of 3 mm. Hence, the diameter of the excitation volume is sufficiently small to observe the reaction in one cell.
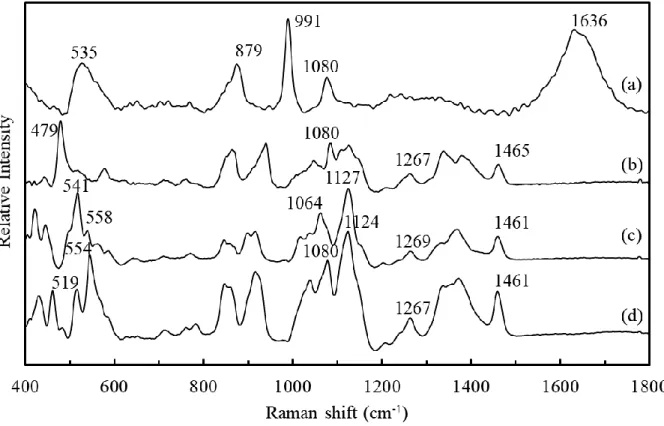
Raman spectra of aqueous solutions of phosphate buffer (a), starch (b), D-glucose (c), and
maltose (d) are shown in Fig. 1. The spectra of saccharides have few bands in the frequency region higher than 1500 cm-1 because they do not have any carbonyl groups or double bonds. Although there is a band near 1640 cm-1 due to OH group of saccharides, it is not available for analysis because there is strong overlapping with OH group of water. Söderholm et al. (1999) suggested that the 500–600 cm-1 range describes sugar species well. The bands below 600 cm-1 can be used to identify these saccharide species, i.e., the bands at 519 cm-1 and 554 cm-1 in maltose, those at
541 cm-1 and 558 cm-1 in D-glucose, and a band at 479 cm-1 in starch. The band frequencies for
maltose and glucose are similar, while their relative intensities are quite different. In the spectrum of the phosphate buffer, a broad band at 1636 cm-1 is attributable to the presence of water. Another broad band at 535 cm-1 can be attributed to an interaction between phosphate and water, which overlaps the characteristic bands of the saccharides. Lipids and proteins have relatively weak bands
30
near these band area (Wua et al. 2011). Our final targets are plants with relatively low concentrations of these latter materials; therefore, the bands described are good marker bands for these sugars. Conventional methods that are normally used to analyze reducing sugars struggle to measure glucose and maltose independently. HPLC is often employed to analyze glucose and maltose. It is necessary to prepare a test solution for HPLC that does not include any solid or insoluble materials; therefore, HPLC is not applicable for nondestructive analysis of in situ localized sugars. Hence, Raman spectroscopy has good potential for maltose and glucose analysis as well.
In order to determine the concentrations of maltose and glucose, as well as starch, in the reaction mixture with α-amylase, it is necessary to build reliable calibration curves for Raman analysis. First, a series of test mixtures of starch, D-glucose and maltose in phosphate buffer
solution without α-amylase was prepared to build the calibration curve. The concentrations of these materials in the model series can be found in Table 1. The test model has a strong correlation among those sugar concentrations, which is usually an insufficient example for the estimation of each material. Moreover, it lacks oligosaccharides in the model. However, that would not be a problem because an enzyme usually keeps the reaction ratio of its products in a relatively small range. We assumed that the analytical model for maltose or glucose should have a margin in which the target sugar can be independently analyzed when the spectral area to build the model was correctly selected. The Raman spectra of the model solution were very similar to that of the real reaction mixture, i.e., with α-amylase (Fig. 1). There was no band attributable to the amide I mode of α-amylase observed in the spectrum.
Raman spectroscopy is a kind of emission spectroscopy, and hence, the intensity of the spectrum is affected by many instrumental and sample conditions. Therefore, quantitative Raman
31
analysis without a standard material will be semi quantitative, in which only relative concentrations can be obtained. In the present study, we have used the area of a band near 1263 cm-1 attributable to a CH2 bending mode on the sugar ring, which is minimally affected by the
enzymatic reaction. When the initial concentration of starch is known, it is possible to determine the absolute concentrations of glucose and maltose. PLSR calibration models were initially built with spectra of aqueous solutions; however, the Raman bands attributable saccharides were extremely weak to obtain reliable results. The model solutions were then dried up to increase the intensity of the saccharide bands. Hence, the current analysis is semi-quantitative. The model was built for the entire spectral region; however, the result was not perfect because each material exhibited an extremely strong correlation. The model was then recalculated with a reduced spectral region, which was optimized for prediction of maltose, glucose, and starch independently. The best spectral region for maltose and glucose analysis was 500–650 cm-1 while it was 460-490 cm
-1 for starch. The correlation coefficients (R2) for the model and validation to analyze maltose,
glucose and starch were 0.964 and 0.962, 0.927 and 0.923, and 0.900 and 0.890, respectively. Detailed description of the PLSR calibration models is available in the supplementary
information.
The prediction models were applied to monitor the enzymatic reaction of α-amylase. Figure 2(a) shows the concentration changes of maltose, glucose, and starch analyzed with Raman spectroscopy and that of the reducing sugars (maltose and glucose) analyzed with the Miller method. Soluble starch in phosphate buffer (pH 7.0; 10,000 mg/L) was incubated with α-amylase and its spectrum was acquired after 0, 1, 3, 5, 10, 15, 30, 45, 60, 90, and 120 min. At the same times as the Raman measurements, a portion of the mixture was analyzed by the Miller method (Fig. 2(b)). The concentrations of maltose, glucose, and starch estimated with the PLSR prediction
32
models are plotted in Fig. 2(a). The concentration of starch reduced quickly in the first minute and reduced slowly after that. In contrast, the concentration of D-glucose, which was the final product,
increased quickly in the first minute and continued to increase with time. The concentration of maltose showed a quick increment in the first minute; however, it showed a variation above and below it. The experiments were repeated 20 times, and the results always showed similar tendencies. The concentrations of reducing sugars analyzed by the Miller method is shown in Fig. 2(b). The result of the Miller method showed a similar curve to that of the Raman analysis in the reaction rate, suggesting that the prediction models work correctly in the real α-amylase reaction. The value of sugar concentration drops at 60 min in the graph of the Miller method (Fig. 2(b)), which is not reasonable because α-amylase never causes a reverse reaction. In contrast, the result obtained by Raman analysis (Fig. 2(a)) changes smoothly, which seems to agree with the theory of the enzymatic reaction.
α-Amylase belongs to endoamylase family (Van der Maarel et al. 2002). Endoamylase is able to cut the α-1,4 glycosidic bond in the inner part (endo-) of the amylose or amylopectin chain as well as starch. The main products of this enzyme are maltose, glucose, and oligosaccharides (having more than three D-glucose residue) (Wirnt and Stegbauer, 1974). The ratio of the products is relatively stable, but not exactly the same anytime because the enzymes randomly cut the bonding between saccharides, especially when the reaction is about to achieve the equilibrium point. The present PLSR analytical model was then examined in saccharification processes with different conditions. We employed three conditions: reaction at a lower temperature (10℃), adding excess maltose in the initial state, and using different enzyme (β-amylase). The maltose production curves at 10℃ and 25℃ are compared in Fig. 3. The reaction speed seemed to slightly decrease for the reaction at 10℃ in the first 30 min compared to that at 25℃; however, the concentration
33
caught up after 120 min of incubation. The reaction speed of the enzyme decreases because of the insufficient temperature; however, the final production depends on the concentration of the initial material (Silva et al. 2010). The result seems to agree with the theoretical results. In the second examination, we evaluated the ability of the present model with a sample that includes one of the final products. The enzymatic reaction does not always start with zero concentration of reducing sugars, in the case where the enzymatic reaction is performed using microorganism (bacteria or fungi), because maltose or glucose is often added into the reaction container to keep their activity. To restage the condition, excess maltose (1,000 mg/L) was added into the starch (10,000 mg/L) to observe the enzymatic reaction of α-amylase. The concentration curves for maltose and glucose estimated by Raman analysis are depicted in Fig. 4(a). The curve of maltose is in excess of 1,000 mg/L larger value relative to that for the sample without excess maltose. In contrast, the value of glucose did not show any difference. The results measured by Miller method is shown in Fig. 4(b). The curve obtained by Miller’s method showed unusual reduction in concentration in the curve at 15 min for the sample with additional maltose, which was also observed in the Raman analysis. It suggests that the present Raman-PLSR analysis is robust to this kind of perturbation. The present Raman-PLSR model was examined to monitor the sugar concentration in the reaction with a different enzyme (i.e., β-amylase). β-Amylase belongs to exoamylase, which exclusively cleaves to α-1,4 glycosidic bonds, successively yielding successive of maltose and a few glucose (Pandey et al. 2000) The concentration changes of starch, maltose, and glucose monitored by Raman analysis is depicted in Fig. 5(a). The maltose production by β-amylase was almost twice higher than that of α-amylase, while D-glucose was much lower. The curves suggest that the activity of β-amylase was remarkably high in the first minute, and stabilized thereafter. Because the concentration of the starch was initially 10,000 mg/L, the sum of concentrations of the products
34
must always be 10,000 mg/L. According to the curves in Fig. 5(a), the sum of the concentration of only maltose and starch is approximately 10,000 mg/L; however, it becomes more than that when the concentration of glucose is added. The concentration change of reducing sugar monitored by Miller’s method is depicted in Fig. 5(b). It showed similar concentration to the curve of maltose except for data at 120 min. It is assumed that the prediction value of glucose is a kind of artifact because of incorrect application of the analytical model. The results suggest that the analytical model built for a specific enzyme is valid only for that enzyme.
Conclusion
A confocal Raman microscope with a high NA objective lens realizes high spatial resolution to analyze the reaction in a cell-sized small volume. The PLSR model built with 7 test samples for a specific enzyme is relatively robust to reaction with external perturbation; however, it is not applicable for a different enzyme. Maltose, glucose, and starch were analyzed independently by selecting the spectral area to build the PLSR models, although the test samples exhibit correlations among their concentration values.
35
References
Ai Y, Yu Z, Chen Y, Zhu X, Ai Z, Liu S, Ni D (2016) Rapid determination of the monosaccharide composition and contents in tea polysaccharides from Yingshuang green tea by pre-column derivatization HPLC. J Chem 2016: 1-5.
Binder JB, Raines RT (2010) Fermentable sugars by chemical hydrolysis of biomass. PNAS 107(10): 4516–4521.
de Souza PM, Magalhaes PO (2010) Application of microbial α–amylase in industry – A review. Braz J Microbiol 41(4): 850-861.
Gaouar 0, Zakhia N, Aymard C, Rios GM (1998) Production of maltose syrup by bioconversion of cassava starch in an ultrafiltration reactor. Ind Crops Prod 7(2-3): 159–167.
Hattori Y, Komachi Y, Asakura T, Shimosegawa T, Kanai G, Tashiro H, Sato H (2007) In vivo Raman study of the living rat esophagus and stomach using a micro raman probe under endoscope. Appl Spectrosc 61(6): 579-584.
Katagiri T, Yamamoto YS, Ozaki Y, Matsuura Y, Sato H (2009) High axial resolution raman probe made of single hollow optical fiber. Appl Spectrosc 63(1): 103-107.
Komachi Y, Sato H, Aizawa K, Tashiro H (2005) Micro optical fiber probe for the use of intravascular Raman endoscope. Appl Opt 44(22): 4722-32.
Meyer A, Raba C, Fischer K (2001) Ion-pair RP-HPLC determination of sugars, amino sugars, and uronic acids after derivatization with p-aminobenzoic acid. Anal Chem 73(11): 2377-82.
36
Chem 31(3): 426–428.
Mohan BH, Gopal A, Malleshi NG, Tharanathan RN (2005) Characteristics of native and enzymatically hydrolyzed ragi (Eleusine coracana) and rice (Oryza sativa) starches. Carbohydr Polym 59(1): 43–50.
Okada M, Nakakuki T (1992) Oligosaccharides: production, properties and applications. In Schenck FW, Hebeda RE (Ed) Starch hydrolysis products: worldwide technology, production and applications. VCH, New York. Pp. 335–366.
Ouchemoukh S, Schweitzer P, Bey MS, Djoudad-Kadji H, Louaileche H (2010) HPLC sugar profiles of Algerian honeys. Food Chem 121(2): 561–568.
Özbalci B, Boyaci IH, Topcu A, Kadilar C, Tamer U (2013) Rapid analysis of sugars in honey by processing raman spectrum using chemometris methods and artificial neural networks. Food Chem 136(3-4): 1444-52.
Pandey A, Nigam P, Soccol CR, Soccol VT, Singh D, Mohan R (2000) Advances in microbial amylases. Biotechnol Appl Biochem 31(2): 135–152.
Shobha D, Sreeramasetty TA, Puttaramanaik, Pandurange-Gowda KT (2010) Evaluation of maize genotypes for physical and chemical composition at silky and hard stage. J Agric ScI 23(2): 311–314.
Silva RN, Quintino FP, Monteiro VN, Asquieri ER (2010) Production of glucose and fructose syrups from cassava (Manihot Esculenta Crantz) starch using enzymes produced by microorganisms isolated from brazilian cerrado soil. Ciênc Tecnol Aliment 30(1): 213-217.
37
in the amorphous and crystalline states. J Raman Spectrosc 30(11): 1009-18.
Sugar J, Bour P (2016) Quantitative analysis of sugar composition in honey using 532-nm excitation Raman and Raman optical activity spectra. J Raman Spectrosc 47(11): 1298-1303.
Tihomirova K, Dalecka B, Mezule L (2016) Application of conventional HPLC RI technique for sugar analysis in hydrolyzed hay. Agron Res 14(5): 1713–1719.
Van der Maarel MJEC, Van der Veen B, Uitdehaag JCM, Leemhuis H, Dijkhuizen L (2002) Properties and applications of starch-converting enzymes of the α-amylase family. J Biotechnol 94(2): 137-155.
Wirnt R, Stegbauer P (1974) α-Amylase measurement of reducing sugar in Bergmeyer HU (Ed) method of enzymatic analysis. Academic Press Inc, New York and London. 2: 885-890.
Wua H, Volponia JV, Oliverb AE, Parikhb AN, Simmonsa BA, Singh S (2011) In vivo lipidomics using single-cell Raman spectroscopy. PNAS 108(9): 3809–14.
Xi X, Xiao S, Tang F, Chu Q, Lan T, Dong G (2016) Monosaccharide analysis of dendrobium moniliforme polysaccharides by high performance liquid chromatography/electrospray ionization mass spectrometry. Am J Agric For 4(6): 156-162.
38
Figures
39
Fig. 2 Concentration estimation of starch (●), maltose (■), and glucose (▲) in the reaction with
enzyme, α-amylase, by PLSR analysis (a). Concentration estimation of reduction sugar by Miller method (DNSA reagent and UV spectroscopy) (b).
40
41
Fig. 4 Concentration estimations for maltose (■) and glucose (▲) in the α-amylase reaction with
adding 1,000 mg/L (♦) maltose at the initial reaction measured by PLSR analysis (a) and that by Miller method (b). The line (■) shows maltose concentration analyzed without adding excess maltose (Same to the line of maltose in Fig. 3).
42
Fig. 5 Estimation of the concentration of starch (●), maltose (■), and glucose (▲) in the reaction
43
44
Supplementary information: Detailed description of PLSR models
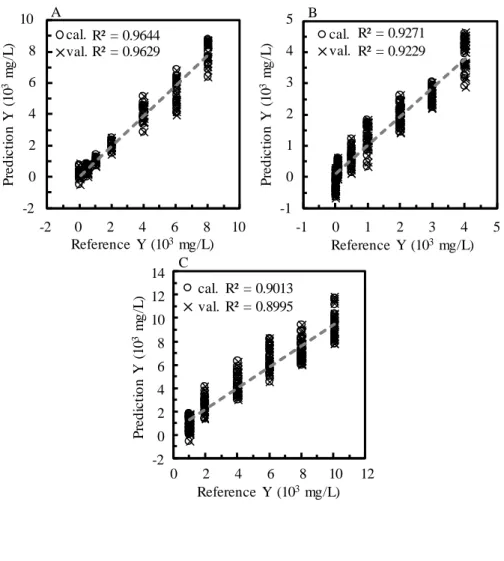
Figure 1A shows a calibration curve for maltose built using two factors. The loading plots for factors 1 (1) and 2 (2) are depicted in Fig. 2A. A broad feature with two tops at 529 and 580 cm-1 appears in the plot of factor 1. Although the band shape of factor 1 is not similar to that of pure maltose, the contribution of factor 1 to the prediction model was high at 57%. PLS model for maltose has high regression square (R2) up to 0.9644 and 0.926 for test and validation. The calibration model (Fig. 1B) for glucose was built with factors 1–3. The optimized spectral region was from 500–650 cm-1, in which the strong band at 519 cm-1 was excluded. The R2 values are 0.927 and 0.923 for the test and validation data sets. The loading plot of factor 1 (Fig. 2B) shows a gentle slope down to higher frequency and a small shoulder is seen near 541 cm-1, which may be attributed to glucose. The contribution of factor 1 to the calibration model was 98%. This fact indicates that factor 1 reflects the alteration in the band of water having an interaction with glucose. A calibration model and loading plots of factors for starch are shown in Figs. 1C and 2C, respectively. The model was built with only factor 1 and its spectral range was from 465 to 490 cm-1. The spectral range is extremely narrow because it includes only a band at 479 cm-1 that is characteristic to starch and, in this range, it does not become overwhelmed with water band and other components. The R2 values of this model are 0.900 and 0.890 for the test and validation data sets, respectively. The plot of factor 1 resembles of starch band in Fig. 2C.
45 A 10 R² = 0.9644 R² = 0.9629 cal. val. -2 0 2 4 6 8 10 -2 0 2 4 6 8 P re d ic ti o n Y ( 10 3 m g /L ) Reference Y (103mg/L) 5 R² = 0.9271 R² = 0.9229 cal. val. -1 0 1 2 3 4 5 -1 0 1 2 3 4 P re d ic ti o n Y ( 10 3 m g /L ) Reference Y (103mg/L) B 0 2 4 6 8 10 12 -2 0 2 4 6 8 10 P re d ic ti o n Y ( 10 3 m g /L ) Reference Y (103mg/L) R² = 0.9013 R² = 0.8995 cal. val. 12 14 C
Fig 1. Calibration curves (A, B and C) of the PLSR models to analyze maltose, glucose and
46 A 10 R² = 0.9644 R² = 0.9629 cal. val. -2 0 2 4 6 8 10 -2 0 2 4 6 8 P re d ic ti o n Y ( 10 3 m g /L ) Reference Y (103mg/L) 5 R² = 0.9271 R² = 0.9229 cal. val. -1 0 1 2 3 4 5 -1 0 1 2 3 4 P re d ic ti o n Y ( 10 3 m g /L ) Reference Y (103mg/L) B 0 2 4 6 8 10 12 -2 0 2 4 6 8 10 P re d ic ti o n Y ( 10 3 m g /L ) Reference Y (103mg/L) R² = 0.9013 R² = 0.8995 cal. val. 12 14 C
Fig 1. Calibration curves (A, B and C) of the PLSR models to analyze maltose, glucose and starch,
47
Chapter 2
Application of Imaging Raman Spectroscopy to study the Distribution of Kappa Carrageenan in the Seaweed Kappaphycus alvarezii
Abstract
Raman imaging spectroscopy has been applied to analyze carrageenan accumulations in the red algae, Kappaphycus alvarezii. The Raman spectra of the sample suggested that the thallus of K. alvarezii mainly consists of cellulose and carrageenan. A partial least square regression prediction model for carrageenan semi-quantitative analysis has been built with a simple two-material system and applied to visualize the three dimensional carrageenan distribution in the algal body. The images clearly depicted the differences in carrageenan distribution between carrageenan-rich and -poor samples. Images stained for carrageenan with methylene blue showed results similar to those from analysis with Raman imaging spectroscopy. Our results suggest that Raman imaging spectroscopy is an accurate and useful method for detecting carrageenan distribution in algae.
Keywords
48
Introduction
The seaweed Kappaphycus alvarezii is a macro alga belonging to the phylum Rhodophyta, and is abundant in tropical seawater, i.e. on the coasts of Indonesia, Philippines, China, and Vietnam (Ask et al. 2001). The Food and Agriculture Organization (FAO) reported that Indonesia is a major producer of K. alvarezii, with a production capacity of up to 10 million tons in 2014. There are many places of seaweed farming in Indonesia, i.e., Karimunjawa, Bali, Sumba, and Sulawesi (Soegiarto and Sulustijo 1990; Manuhara et al. 2016). K. alvarezii contains a high weight ratio of carbohydrates (Bixler 1996; Lechat et al. 1997). Carrageenan is sulfated polysaccharide extracted from red algae (Normah and Nazarifah, 2003). The most valuable carbohydrate extracted from K. alvarezii is kappa (κ)-carrageenan (Fig. 1), which has D-galactose 4-sulfate and 3,6 anhydrous D-galactose residues linked at the β (1,4) and α (1,3) carbons, respectively (Lechat et al. 1997; Rhein-Knudsen, 2015; Cunha and Grenha, 2016). Carrageenan is in high demand in many industries, i.e., food, pharmacy, and cosmetics, owing to its stabilizing, gelling, and thickening properties (Pereira et al. 2013; Necas and Bartosikova, 2013; Azevedo et al. 2013). In the market, there are two types of carrageenan products that are differentiated by quality: semi-refined carrageenan (SRC) and refined carrageenan (RC). SRC and RC use different purification steps such as centrifugation, filtration, and alcohol precipitation (McHugh 2003).
The purpose of the present study is to demonstrate that Raman imaging combined with chemometrics are powerful tools for studying carrageenan distribution in algae. Although the quality and yield of carrageenan production generally depends on the seaweed itself, there is no clear standard for quality control. It is difficult to determine the quality of the seaweed only from its appearance and shape. Currently, extraction is the only method to examine the quality of seaweed farming, but it is destructive and not applicable to study the localization of carrageenan in the algal body. Thus, many researchers in carrageenan industries have keen interest in a tool