IRUCAA@TDC : Clinical Care Provided on Post-graduate Dental Clinical Training Course at Tokyo Dental College Chiba Hospital, Department of General Dentistry
10
0
0
全文
(2) 205. Bull Tokyo Dent Coll (2009) 50(4): 205–213. Clinical Report. Clinical Care Provided on Post-graduate Dental Clinical Training Course at Tokyo Dental College Chiba Hospital, Department of General Dentistry Toshiyuki Takahashi, Masatake Tsunoda, Toshiko Sugiyama, Daiki Yamakura, Yoshihiro Kondo and Akio Noro Division of General Dentistry, Tokyo Dental College Chiba Hospital, 1-2-2 Masago, Mihama-ku, Chiba 261-8502, Japan. Received 15 July, 2009/Accepted for publication 31 August, 2009. Abstract Number of patients assigned to dental residents, course of treatment and number of various technical tasks performed as described in the Reports on Clinical Training of Dentists published by the Department of General Dentistry, Tokyo Dental College Chiba Hospital since its establishment in 2002 were compared between before (2003–2005) and after (2006–2007) clinical training was made mandatory, and the state of clinical residency evaluated. Number of patients assigned generally increased, and mean number of patients treated by each resident in 2007 (15.08) was approximately 2 times higher than that in 2003 (8.47). Total number of treatments was 1.38 times higher in 2007 than in 2003, and periodontal treatment accounted for approximately 40% of all treatment both before and after clinical training became mandatory. Number of technical tasks in 2004– 2007 was less than half the peak in 2003. To further improve clinical training, evaluation and implementation of effective approaches is necessary to secure an adequate number of patients, widen the variety of cases and increase the number of technical tasks. Key words:. Clinical care —Post-graduate course—Clinical training course— General Dentistry— Tokyo Dental College Chiba Hospital. Introduction Under the clinical training system for dentists, work toward implementation of clinical training was made mandatory by the 1996 amendment of the Dental Practitioners Law. Thereafter, in 2000, the Medical and Dental Practitioners Laws were simultaneously. amended by the Law to Partially Amend the Medical Care Law, and clinical training was made mandatory in 2004 for physicians and in 2006 for dentists2). In these circumstances, Tokyo Dental College organized a clinical training system at 3 hospitals, i.e., the Chiba, Suidobashi, and Ichikawa General Hospitals, and the Department of General Dentistry was. An abstract of this paper was presented at the 21st Conference of the Japanese Association for Dental Science (November 14–16, 2008; Yokohama City).. 205.
(3) 206. Takahashi T et al.. established at the Chiba Hospital in 2002. The Dental Practitioners Law stipulates that “Clinical training must be designed to allow dentists to develop an attitude appropriate as a dentist, understand the social role that dental science and dental services are expected to play, and acquire basic diagnostic and therapeutic abilities regardless of the specialties that they will pursue in the future so that they can appropriately treat injuries or diseases frequently encountered in general practice”. Therefore, to clarify the state of clinical activities of dentists under clinical training at the Department of General Dentistry, Chiba Hospital, we reviewed the Reports on Clinical Training of Dentists4–8) published before (2003– 2005) and after (2006–2007) clinical training was made mandatory. We investigated number of patients assigned, content of clinical activities, and number of technical tasks performed on the basis of the summary tables of number of patients assigned and diagnostic and therapeutic procedures and technical tasks performed after the establishment of the Department of General Dentistry, Chiba Hospital in 2002.. Materials and Methods The summary tables of numbers of patients, clinical actions, and technical tasks assigned to dental residents at the General Dentistry, Chiba Hospital in the Reports on Clinical Training of Dentists published in 2003–20054–6) and 2006–20077,8) before and after clinical training was made mandatory were reviewed. Num-. ber of patients, contents of clinical actions, and number of technical tasks assigned were compared annually and between before and after clinical training was made mandatory to evaluate the state of clinical training at the Department of General Dentistry, Chiba Hospital.. Results 1. Number of dental residents and patients assigned 1) Mean number of patients Mean number of patients assigned to a dental resident was 8.47 in 2003 but increased steadily until it nearly doubled to 15.08 in 2007 (Table 1). The target number of patients suitable to allow a team of 2 trainees to be able to perform a diagnosis and provide treatment with little delay, 5 days a week as suggested in the report by Takahashi et al.3), is considered to have been attained. Table 1 shows the mean, maximum, and minimum numbers of patients in Terms 1–3 from 2003 to 2007. They all increased between 2003 and 2007. Mean number of patients also increased with the advance of the term from 1 to 3 in each year except in Term 2 of 2005 (Table 1). 2) Number of dental residents Total number of dental residents was 84 (Term 1: 36, Term 2: 30, Term 3: 18) in 2003, 83 (Term 1: 30, Term 2: 34, Term 3: 19) in 2004 and 79 (Term 1: 26, Term 2: 29, Term 3: 24) in 2005 before clinical training became mandatory. It was 112 (Term 1: 38, Term 2: 38, Term 3: 36) in 2006 and 93 (Term 1: 33,. Table 1 Changes in number of patients from 2003–2007 Term 1 MNP 2003 2004 2005 2006 2007. 8.47 10.53 10.18 10.09 15.08. Term 2. Term 3. Mean. Max.. Min.. Mean. Max.. Min.. Mean. Max.. Min.. 5.69 8.53 9.15 8.32 13.48. 9 13 11 12 17. 4 5 7 5 10. 8.93 9.18 7.41 10.71 15.50. 13 15 12 18 19. 7 6 4 6 10. 10.78 13.89 13.96 11.25 16.25. 14 24 19 16 24. 8 8 8 7 9. Mean number of patients: MNP. unit: person.
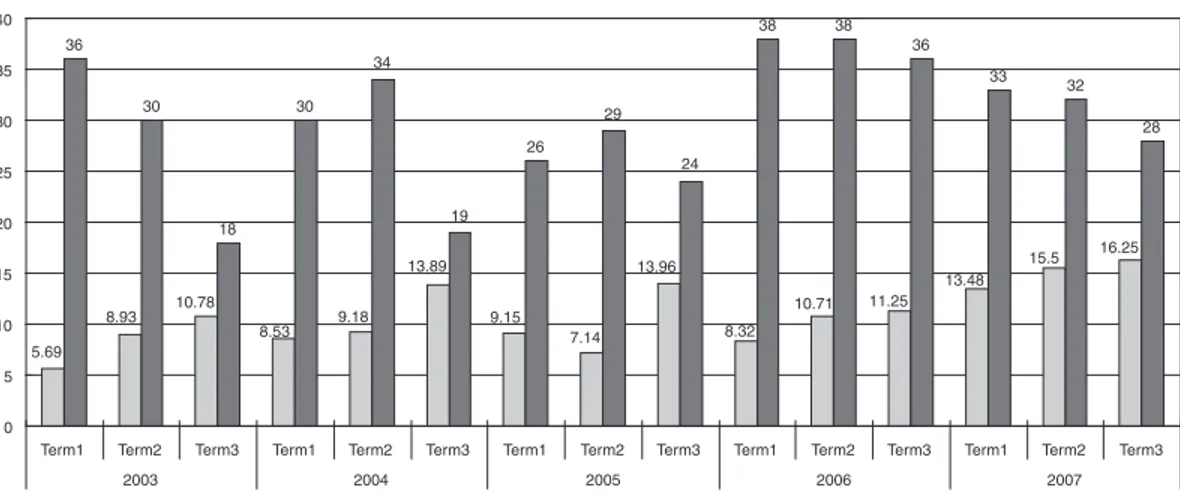
(4) 207. Clinical Care Provided on Post-graduate Course. Term 2: 32, Term 3: 28) in 2007 after clinical training became mandatory. Mean number of dental residents was 82 in 2003–2005 but increased by 25% to 102.5 in 2006–2007. 3) Relationship between number of dental residents and mean number of patients As shown in Table 1, the mean number of patients per resident was 8.32 in Term 1 of 2006, when the number of dental residents was highest (38), and 10.71 in Term 2 of 2006 (38). That in Term 3 of 2003, when the number of dental residents was lowest (18), was 10.78. Also, the mean number of patients per resident nearly tripled in Term 3 of 2007 (16.25, number of residents: 28) compared with Term 1 of 2003 (5.69, number of residents: 36). Number of patients assigned to. each resident increased steadily, even when the decrease in the number of residents by 8 in Term 3 of 2007 compared with Term 1 of 2003 is taken into consideration. Also, the mean number of patients assigned to each resident decreased when the number of dental residents, which varied among years and terms, was 35 or higher (Fig. 1). 2. Clinical actions performed by dental residents 1) Outline of clinical actions Total number of treatments increased approximately 1.38 times in 2007 compared with 2003 (Table 2). Among treatment categories, total number of periodontal treatments was highest, followed by endodontic MNP. unit: person 40. 38. NDR. 38 36. 36 34. 35 30. 33. 30. 32. 29. 30. 28. 26 24. 25 20. 19. 18 13.89. 15 10.78. 9.18. 8.93. 10. 15.5. 13.96 10.71. 9.15. 8.53. 11.25. 8.32. 7.14. 5.69. 16.25. 13.48. 5 0 Term1. Term2. Term3. Term1. 2003. Term2. Term3. Term1. 2004. Term2. Term3. Term1. Term2. 2005. Term3. Term1. 2006. Term2 2007. Fig. 1 Changes in number of residents and mean number of patients per resident from 2003–2007 Mean number of patients: MNP, Numbers of dental residens: NDR. Table 2 Outline of numbers of treatments in various categories PT. ET. RT. CB. RP. 2,239 2,464 3,329 2,548 3,626. 1,196 1,506 1,527 1,644 1,414. 843 583 898 1,164 1,045. 1,042 1,202 843 1,101 1,105. Total 14,206. 7,287. 4,533. 5,293. 2003 2004 2005 2006 2007. ST. Total. 706 687 643 843 1,118. 281 213 269 259 372. 6,307 6,655 7,509 7,559 8,680. 3,997. 1,394. 36,710. unit: case Periodontal treatment: PT, Endodontic treatment: ET, Restorative treatment: RT, Crown and bridge prosthetic treatment: CB, Removable prosthodontic treatment: RP, Oral surgical treatment: ST. Term3.
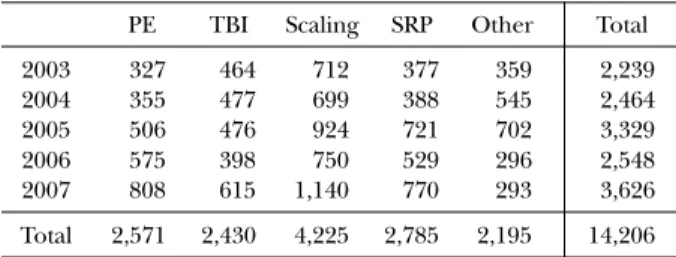
(5) 208. Takahashi T et al.. treatments, crown and bridge prosthetic treatments, restorative treatments, removable prosthodontic treatments and oral surgical treatments from 2003 to 2007, from 2003 to 2005, before clinical training became mandatory, and from 2006 to 2007, after clinical training became mandatory (Table 2). From 2003 to 2007, number of periodontal treatments was highest (Table 2), accounting for about 40% of all treatments, with no marked change either before or after clinical training became mandatory. Concerning changes in content of treatment, number of periodontal treatments, restorative treatments, removable prosthodontic treatments and oral surgical treatments increased almost progressively from 2003 to 2007, but number of other treatments generally remained similar with some annual variations (Table 2). The percentages of various treatments were generally similar between before and after clinical training became mandatory, despite. slight variation in some treatment categories. 2) Details of content of treatment (1) Periodontal treatment Concerning periodontal treatment, data regarding periodontal examination, tooth brushing instruction (TBI), scaling, scaling root planing (SRP) and other treatments were analyzed. Number of treatments was highest for scaling, number of periodontal examinations increased annually, and those of TBI, scaling, and SRP also generally increased with time (Table 3). Percentages of various treatment categories were generally similar between before and after clinical training became mandatory, despite some differences among categories. Percentage was highest for scaling in both periods, being 28% in 2003–2005 and 31% in 2006–2007. (2) Endodontic treatment Concerning endodontic treatment, data were collected regarding pulpectomy under anesthesia, treatment of infected root canals,. Table 3 Number of periodontal treatments PE. TBI. Scaling. SRP. Other. Total. 2003 2004 2005 2006 2007. 327 355 506 575 808. 464 477 476 398 615. 712 699 924 750 1,140. 377 388 721 529 770. 359 545 702 296 293. 2,239 2,464 3,329 2,548 3,626. Total. 2,571. 2,430. 4,225. 2,785. 2,195. 14,206. unit: case Periodontal examination: PE, Tooth brushing instruction: TBI, Scaling root planing: SRP. Table 4 Number of endodontic treatments PE. TIRC. RCDA. RCF. Other. Total. 2003 2004 2005 2006 2007. 85 84 89 111 112. 257 332 197 307 241. 567 743 788 889 775. 148 195 188 236 202. 139 152 265 101 84. 1,196 1,506 1,527 1,644 1,414. Total. 481. 1,334. 3,762. 969. 741. 7,287. unit: case Pulpectomy under anesthesia: PE, Treatment of infected root canals: TIRC, Root canal drug application: RCDA, Root canal filling: RCF.
(6) 209. Clinical Care Provided on Post-graduate Course. root canal drug application, root canal filling and other treatments. Number of treatments was highest in each year for root canal drug application, and number of treatments other than treatment of infected root canals, root canal drug application and others was stable with slight annual variations (Table 4). Percentages of various treatments generally did not change between 2003–2005 and 2006–2007, despite slight variations in some treatment categories. Percentage of root canal drug application was highest in both periods, being 49% and 55%, respectively. (3) Restorative treatment Concerning restorative treatment, data regarding composite resin restoration, preparation and impression of inlay, and inlay placement were collected. Number of composite resin restorations was highest, and those of preparation and impression of inlay and inlay placement were nearly the same. Total number of treatments was lowest in 2004, highest in 2006 and approximately 2 times higher in 2006 compared with in 2004. Number of treatments showed slight progressive increases (Table 5). Percentages of treatments were generally similar between 2003–2005 and 2006–2007 with slight variations in individual categories. Percentage of composite resin restorations was highest in both periods, being 60% and 63%, respectively. (4) Crown and bridge prosthetic treatment Concerning crown and bridge prosthetic treatment, data regarding preparation and. impression of crown, crown placement, preparation and impression of bridge, bridge placement, preparation and impression of metal core, metal core placement, other prosthetic treatments and placement of other prostheses were analyzed. Numbers of all treatments were lowest in 2005. Among all treatments, number of crown prosthetic treatments was highest each year, and numbers of preparation and impression of bridge, bridge placement and placement of other prostheses were low. Number of preparation and impression of crown was approximately 1.2 times higher in 2007 than in 2003, that of crown placement was approximately 1.8 times higher in 2007 than in 2003, but those of preparation and impression of bridge, bridge placement, preparation and impression of metal core, metal core placement and placement of other prostheses were nearly the same in all years except 2005 (Table 6). Percentages of various treatments were generally. Table 5 Number of restorative treatments CRR. PII. IP. Total. 2003 2004 2005 2006 2007. 517 329 549 752 654. 184 142 187 220 215. 142 112 162 192 176. 843 583 898 1,164 1,045. Total. 2,801. 948. 784. 4,533. unit: case Composite resin restoration: CRR, Preparation and impression of inlay: PII, Inlay placement: IP. Table 6 Number of crown and bridge prosthetic treatments PIC. CP. PIB. BP. PIM. MP. OPT. POP. Total. 2003 2004 2005 2006 2007. 171 214 152 175 210. 108 166 121 155 191. 62 67 28 70 53. 39 36 21 36 40. 180 187 148 185 149. 128 155 127 155 139. 307 323 212 271 280. 47 54 34 54 43. 1,042 1,202 843 1,101 1,105. Total. 922. 741. 280. 172. 849. 704. 1,393. 232. 5,293. unit: case Preparation and impression of crown: PIC, Crown placement: CP, Preparation and impression of bridge: PIB, Bridge placement: BP, Preparation and impression of metal core: PIM, Metal core placement: MP, Other prosthetic treatments: OPT, Placement of other prostheses: POP.
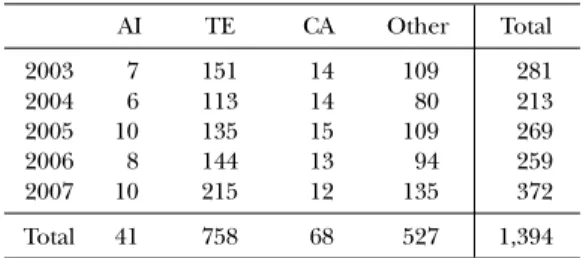
(7) 210. Takahashi T et al.. similar between 2003–2005 and 2006–2007, despite some changes in individual treatment categories. Percentages of preparation and impression of crown, crown placement, preparation and impression of metal core, metal core placement and other prosthetic treatments were 17, 13, 17, 13 and 28%, respectively, in 2003–2005 and 17, 16, 15, 13 and 26%, respectively, in 2006–2007. (5) Removable prosthodontic treatment Concerning removable prosthodontic treatment, data regarding the final impression of removable dentures, bite taking of removable dentures, placement of removable dentures, adjustment of removable dentures, repair of dentures, denture relining and mucosal adjustment were analyzed. Among various treatments, number of denture adjustment was highest. Number of final impression of removable denture was approximately 1.9 times higher, number of bite taking of removable dentures was approximately 1.9. times higher, number of placement of removable dentures was approximately 1.8 times higher and number of denture adjustment was approximately 1.8 times higher in 2007 than in 2003. Numbers increased progressively, and numbers of other treatments also increased, despite some fluctuations (Table 7). Among various treatments, percentage of denture adjustment was highest in both 2003–2005 and 2006–2007, being 55 and 56%, respectively. (6) Oral surgical treatment Concerning oral surgical treatment, data regarding abscess incisions, tooth extractions, conduction anesthesia and other treatments were analyzed. Number of tooth extractions was highest among treatments. It increased annually and was 1.4 times higher in 2007 than in 2003. Numbers of other treatments also increased, despite some annual fluctuations (Table 8). Percentages of various treatments remained. Table 7 Number of removable prosthodontic treatments FID. BTD. PD. AD. RD. DR. MA. Total. 2003 2004 2005 2006 2007. 61 67 48 79 118. 45 49 39 82 87. 69 61 50 92 121. 384 374 382 429 672. 93 87 85 110 82. 28 36 20 19 26. 26 13 19 32 12. 706 687 643 843 1,118. Total. 373. 302. 393. 2,241. 457. 129. 102. 3,997. unit: case Final impression of removable dentures: FID, Bite taking of removable dentures: BTD, Placement of removable dentures: PD, Adjustment of removable dentures: AD, Repair of dentures: RD, Denture relining: DR, Mucosal adjustment: MA. Table 8 Number of oral surgical treatments AI. TE. CA. Other. Total. 2003 2004 2005 2006 2007. 7 6 10 8 10. 151 113 135 144 215. 14 14 15 13 12. 109 80 109 94 135. 281 213 269 259 372. Total. 41. 758. 68. 527. 1,394. unit: case Abscess incisions: AI, Tooth extractions: TE, Conduction anesthesia: CA.
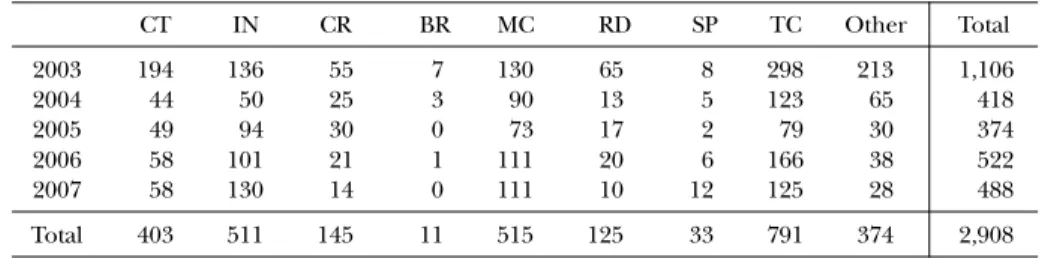
(8) 211. Clinical Care Provided on Post-graduate Course. similar between 2003–2005 and 2006–2007, despite some changes in individual treatments. Percentage of tooth extraction was highest, being 52% in 2003–2005 and 57% in 2006–2007. 3. Numbers of technical tasks performed by dental residents Data concerning the preparation of custom trays, preparation of inlays, preparation of crowns, preparation of bridges, preparation of metal cores, preparation of removable dentures, preparation of sprints, preparation of temporary crowns and preparation of other materials were analyzed. Total number of technical tasks, which was 1,106 in 2003, decreased to less than half, being 418 (37.8%) in 2004, 374 (33.8%) in 2005, 522 (47.2%)in 2006 and 488 (44.1%) in 2007. While there was no change between 2004 and 2007, slight increases were observed in 2006 and 2007 compared with in 2004 and 2005 (Table 9). Concerning numbers of individual tasks, those of preparation of custom trays, preparation of inlays, preparation of crowns, preparation of metal cores, and preparation of temporary crowns were high each year, but numbers of all tasks except those of preparation of inlays, preparation of metal cores and preparation of sprints decreased markedly compared with in 2003 (Table 9). Percentages of various tasks were generally similar between 2003–2005 and 2006–2007, despite some fluctuations in individual tasks,. and those of preparation of bridges, preparation of crowns, and preparation of sprints were low. Percentages of preparation of custom trays, preparation of inlays, preparation of metal cores, preparation of temporary crowns and other technical tasks were 15, 15, 15, 26 and 16%, respectively, in 2003–2005 and 11, 23, 22, 29 and 7%, respectively, in 2006–2007. In 2006–2007, number of bridge preparation was only 1. This is considered to be a serious problem, and more intensive instruction in technical tasks is necessary for the future.. Discussion 1. Number of patients The progressive increase in the mean number of patients per resident from 2003 to 2007 is considered to have been due to the increase in the total number of patients at the Department of General Dentistry, i.e., the increases in the mean number of patients per instructor (about 35) and the mean number of recall patients (about 15). The mean number of patients increased with the advance from Term 1 to Term 3 in each year, probably because residents became willing to examine more patients in the preliminary examination stage and began to be involved in the care of more difficult cases as they got used to the tasks at the department. The mean number of patients was low in. Table 9 Number of technical tasks CT. IN. CR. BR. MC. RD. SP. TC. Other. Total. 2003 2004 2005 2006 2007. 194 44 49 58 58. 136 50 94 101 130. 55 25 30 21 14. 7 3 0 1 0. 130 90 73 111 111. 65 13 17 20 10. 8 5 2 6 12. 298 123 79 166 125. 213 65 30 38 28. 1,106 418 374 522 488. Total. 403. 511. 145. 11. 515. 125. 33. 791. 374. 2,908. unit: case Preparation of custom trays: CT, Preparation of inlays: IN, Preparation of crowns: CR, Preparation of bridges: BR, Preparation of metal cores: MC, Preparation of removable dentures: RD, Preparation of sprints: SP, Preparation of temporary crowns: TC.
(9) 212. Takahashi T et al.. Term 1, probably because the trainees in the previous year tried to finish treatment by the end of their residency in March, and because the number of patients distributed to the Department of General Dentistry after preliminary examinations was low in April, which was in Term 0, as only instructor dentists were on duty and more patients were assigned to them. When the number of dental residents increased to 35 or above, the mean number of patients per resident decreased, presumably because the number of patients used by instructor dentists for resident training was limited. This suggests the necessity for evaluation of appropriate numbers of instructors and residents to make clinical training more efficient. 2. Contents of clinical activities Compared with the data concerning Japanese dentists in general in June observed in the national statistics in the Social Medical and Clinical Actions in 20049), the number of periodontal treatments was slightly lower, and the numbers of endodontic treatments and removable prosthetic treatments were slightly higher, but the differences were not marked3). This suggests that the goal of clinical training, i.e., “acquiring basic diagnostic and therapeutic abilities so that trainees can appropriately handle injuries and diseases commonly encountered in general clinical practice”, was attained. Periodontal treatment accounted for about 40% of all treatments, probably because periodontal disease is prevalent. Periodontal treatment is a basic process in dentistry along with treatment of caries. Therefore, as pretreatment, periodontal examination, scaling and tooth brushing instruction, in particular, are necessary to ensure a favorable outcome of dental treatment. Numbers of periodontal treatments, restorative treatments, removable prosthodontic treatments and oral surgical treatments generally increased with time between 2003 and 2007. This is considered to be a reflection of a positive attitude of the dental residents toward clinical training.. In the future, we would also like to perform formative evaluation of clinical actions of dental residents using an evaluation chart such as that devised by Kishi et al.1). 3. Number of technical tasks In 2006–2007, bridge preparation was performed for only 1 patient, which is a serious problem. This is considered to have been due to the fact that relatively simple prostheses could be prepared by the residents themselves, who treated patients on a weekly basis, but more complex and time-consuming technical tasks had to be ordered to outside agents. It is difficult to reconcile clinical work with the performance of technical tasks, so the number of technical tasks performed by a trainee will depend on which activity is emphasized during clinical training. According to the present principle of “placing emphasis on allowing trainees to experience many clinical cases”, sacrificing the number of technical tasks is considered unavoidable to some extent. However, it is indispensable for a dentist to acquire the knowledge to enable them to give appropriate instructions to dental technicians and the ability to properly assess the prepared prostheses. More intensive instruction in technical tasks may be necessary during clinical training in the future to compensate for this lack of experience in technical tasks.. Conclusion This study revealed problems that must be evaluated and resolved concerning securing number of patients, widening variety and improving appropriateness of cases and increasing number of technical tasks to improve clinical training. It is necessary to continue monitoring the state of clinical training at the Department of General Dentistry, Chiba Hospital by collecting and analyzing data concerning the number of patients, contents of examination and treatment and technical tasks experienced by dental residents during each term and year of clinical training..
(10) Clinical Care Provided on Post-graduate Course. Acknowledgement We would like to thank Associate Professor Jeremy Williams, Tokyo Dental College, for his assistance with the English of this manuscript.. References 1) Kishi M, Kudo Y, Yonemitsu M, Miura H (2006) Development of a total assessment for junior residents using radar charts. JJADE 24: 27–34. (in Japanese) 2) Sumitomo M (2005) Postgraduate clinical training of dentists. Committee for the preparation of white paper on education in dental science. Japanese Association for Dental Science. Supplement:69–77. (in Japanese) 3) Takahashi T, Tsunoda M, Yamakura D, Sugiyama T, Miyashita Y, Adachi R, Morinaga K, Itou A, Haruyama C, Takeda T, Nakajima K (2007) The clinical care situation of postgraduate dental clinical training course at Chiba Hospital General Dentistry. Shikwa Gakuho 107:519–527. (in Japanese) 4) Tokyo Dental College Chiba Hospital (2003) Report on the postgraduate dentists clinical training in general dentistry in 2003rd. (in Japanese). 213. 5) Tokyo Dental College Chiba Hospital (2004) Report on the postgraduate dentists clinical training in general dentistry in 2004th. (in Japanese) 6) Tokyo Dental College Chiba Hospital (2005) Report on the postgraduate dentists clinical training in general dentistry in 2005th. (in Japanese) 7) Tokyo Dental College Chiba Hospital (2006) Report on the postgraduate dentists clinical training in general dentistry in 2006th. (in Japanese) 8) Tokyo Dental College Chiba Hospital (2007) Report on the postgraduate dentists clinical training in general dentistry in 2007th. (in Japanese) 9) Volume II, Survey of Social Medical and Clinical Actions, 2004. Book of Statistical Tables (Subcategories of Clinical Actions) (Eds) (2006) Statistics and information department, minister’s secretariat, Ministry of Heath, Labour and Welfare. Health and welfare statistics association. Dental Services 575–635. (in Japanese) Reprint requests to: Dr. Toshiyuki Takahashi General Dentistry, Tokyo Dental College, 1-2-2 Masago, Mihama-ku, Chiba 261-8502, Japan E-mail: totakaha@tdc.ac.jp.
(11)
図


+3
関連したドキュメント
We study the real roots of the Yablonskii–Vorob’ev polynomials, which are spe- cial polynomials used to represent rational solutions of the second Painlev´ e equation.. It has
Department of Orthopedic Surgery Okayama University Medical School Okayama Japan.. in
If condition (2) holds then no line intersects all the segments AB, BC, DE, EA (if such line exists then it also intersects the segment CD by condition (2) which is impossible due
In Section 3, we study the determining number of trees, providing a linear time algorithm for computing minimum determining sets.. We also show that there exist trees for which
Classical definitions of locally complete intersection (l.c.i.) homomor- phisms of commutative rings are limited to maps that are essentially of finite type, or flat.. The
Yin, “Global existence and blow-up phenomena for an integrable two-component Camassa-Holm shallow water system,” Journal of Differential Equations, vol.. Yin, “Global weak
It is well known that in the cases covered by Theorem 1, the maximum permanent is achieved by a circulant.. Note also, by Theorem 4, that the conjecture holds for (m, 2) whenever m
In recent years, its abuse has been spreading, especially among the youth in their 20's, and the number of arrests for cannabis abuse in 2004 reached a record high of 2,209 (108.7%
