APPENDICES
Appendix A: Research Methodology
Appendix B: Organization Charts, Available Data Information and Survey Results Appendix C: Questionnaires and Checklist
Appendix D: Respondent’s Survey Results Appendix E: Photo Section
APPENDIX A
RESEARCH DESIGN AND PROCESS
Making Assumptions Identified Research Questions
Analytical Methods and Data Processing Data Collection
Methods
Setting Research Objectives
Data Analysis and Interpretation
Conclusion and Recommendations
- Literature review
- Field survey, Institutional survey - Interviews, Discussions, Investigation - Observations, Learning Experiences - Empirical explanatory approach
- Qualitative analysis - Quantitative analysis - Descriptive analysis - Multivariate analysis Research concept Secondary data Primary data P H A S E I P H A S E I I P H A S E I II
APPENDIX - B
ORGANIZATION CHARTS AND AVAILABLE DATA INFORMATION
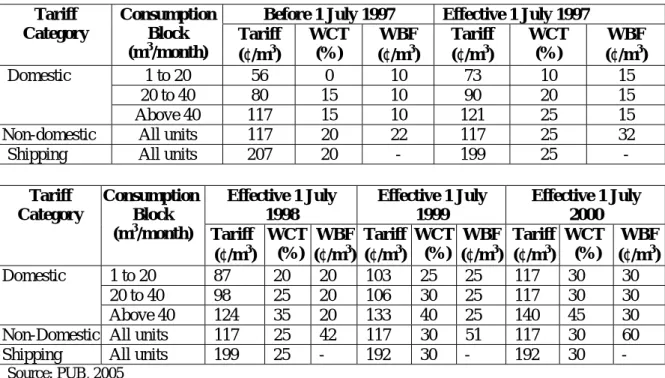
Table 1: Effective Water Tariff in PUB, Singapore
Before 1 July 1997 Effective 1 July 1997 Tariff Category Consumption Block (m3/month) Tariff (¢/m3) WCT (%) WBF (¢/m3) Tariff (¢/m3) WCT (%) WBF (¢/m3) 1 to 20 56 0 10 73 10 15 20 to 40 80 15 10 90 20 15 Domestic Above 40 117 15 10 121 25 15
Non-domestic All units 117 20 22 117 25 32
Shipping All units 207 20 - 199 25 -
Effective 1 July 1998 Effective 1 July 1999 Effective 1 July 2000 Tariff Category Consumption Block (m3/month) Tariff (¢/m3) WCT (%) WBF (¢/m3) Tariff (¢/m3) WCT (%) WBF (¢/m3) Tariff (¢/m3) WCT (%) WBF (¢/m3) 1 to 20 87 20 20 103 25 25 117 30 30 20 to 40 98 25 20 106 30 25 117 30 30 Domestic Above 40 124 35 20 133 40 25 140 45 30 Non-Domestic All units 117 25 42 117 30 51 117 30 60 Shipping All units 199 25 - 192 30 - 192 30 -
Source: PUB, 2005
Note: WCT= Water Conservation Tax: Levied by the Government to reinforce the water conservation message
WBF= Water Borne Fee and Sanitary Appliance Fee (SAF): Statutory charges prescribed under the statutory Appliances and water charges regulation to offset the cost of treating used water and for the maintenance and extension of the public sewerage system. SAF is S$3per sanitary fitting per month.
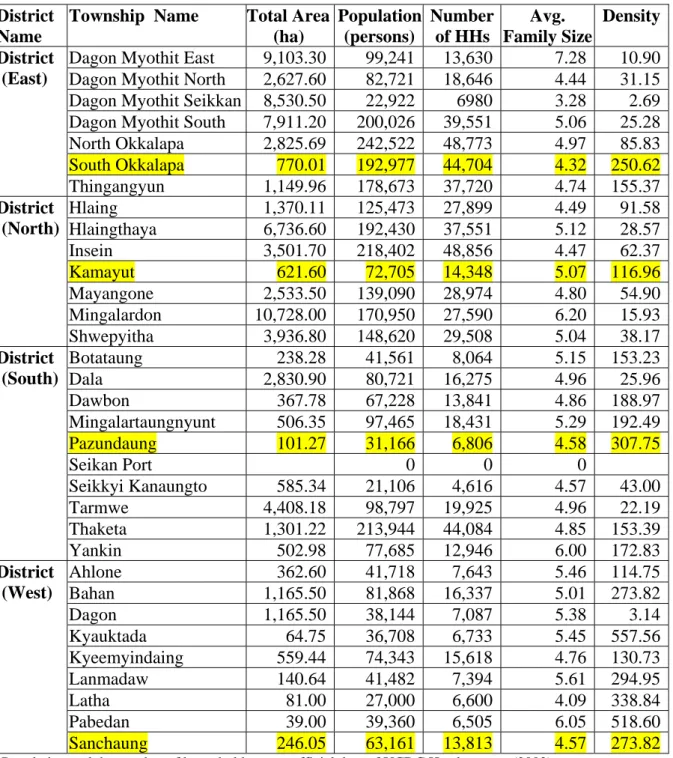
Table 2: Population Density in each Townships and Districts of Yangon City District
Name
Township Name Total Area (ha) Population (persons) Number of HHs Avg. Family Size Density Dagon Myothit East 9,103.30 99,241 13,630 7.28 10.90 Dagon Myothit North 2,627.60 82,721 18,646 4.44 31.15 Dagon Myothit Seikkan 8,530.50 22,922 6980 3.28 2.69 Dagon Myothit South 7,911.20 200,026 39,551 5.06 25.28 North Okkalapa 2,825.69 242,522 48,773 4.97 85.83 South Okkalapa 770.01 192,977 44,704 4.32 250.62 District (East) Thingangyun 1,149.96 178,673 37,720 4.74 155.37 Hlaing 1,370.11 125,473 27,899 4.49 91.58 Hlaingthaya 6,736.60 192,430 37,551 5.12 28.57 Insein 3,501.70 218,402 48,856 4.47 62.37 Kamayut 621.60 72,705 14,348 5.07 116.96 Mayangone 2,533.50 139,090 28,974 4.80 54.90 Mingalardon 10,728.00 170,950 27,590 6.20 15.93 District (North) Shwepyitha 3,936.80 148,620 29,508 5.04 38.17 Botataung 238.28 41,561 8,064 5.15 153.23 Dala 2,830.90 80,721 16,275 4.96 25.96 Dawbon 367.78 67,228 13,841 4.86 188.97 Mingalartaungnyunt 506.35 97,465 18,431 5.29 192.49 Pazundaung 101.27 31,166 6,806 4.58 307.75 Seikan Port 0 0 0 Seikkyi Kanaungto 585.34 21,106 4,616 4.57 43.00 Tarmwe 4,408.18 98,797 19,925 4.96 22.19 Thaketa 1,301.22 213,944 44,084 4.85 153.39 District (South) Yankin 502.98 77,685 12,946 6.00 172.83 Ahlone 362.60 41,718 7,643 5.46 114.75 Bahan 1,165.50 81,868 16,337 5.01 273.82 Dagon 1,165.50 38,144 7,087 5.38 3.14 Kyauktada 64.75 36,708 6,733 5.45 557.56 Kyeemyindaing 559.44 74,343 15,618 4.76 130.73 Lanmadaw 140.64 41,482 7,394 5.61 294.95 Latha 81.00 27,000 6,600 4.09 338.84 Pabedan 39.00 39,360 6,505 6.05 518.60 District (West) Sanchaung 246.05 63,161 13,813 4.57 273.82 Population and the number of households are unofficial data of YCDC Headquarters (2002)
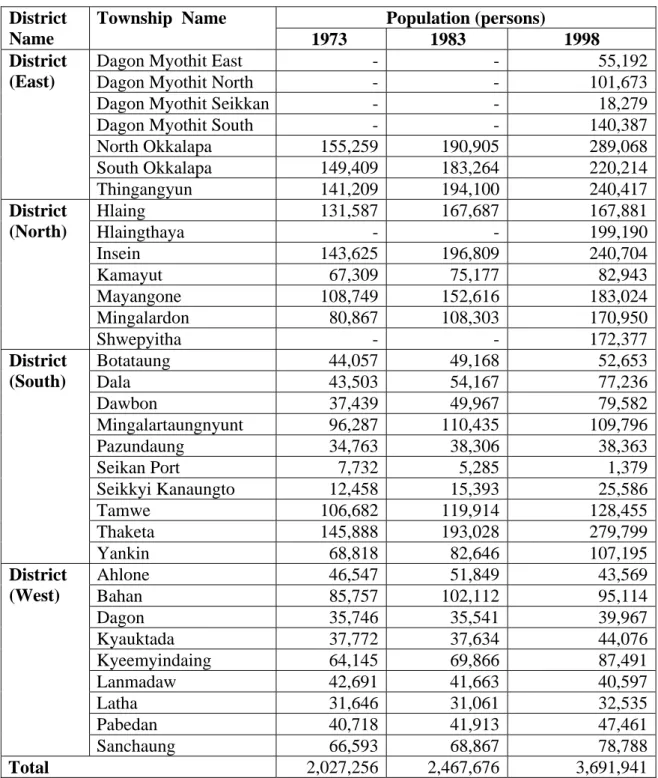
Table 3: Population in each Townships and Districts of Yangon City Year 1973-1998 Population (persons) District Name Township Name 1973 1983 1998
Dagon Myothit East - - 55,192
Dagon Myothit North - - 101,673
Dagon Myothit Seikkan - - 18,279
Dagon Myothit South - - 140,387
North Okkalapa 155,259 190,905 289,068 South Okkalapa 149,409 183,264 220,214 District (East) Thingangyun 141,209 194,100 240,417 Hlaing 131,587 167,687 167,881 Hlaingthaya - - 199,190 Insein 143,625 196,809 240,704 Kamayut 67,309 75,177 82,943 Mayangone 108,749 152,616 183,024 Mingalardon 80,867 108,303 170,950 District (North) Shwepyitha - - 172,377 Botataung 44,057 49,168 52,653 Dala 43,503 54,167 77,236 Dawbon 37,439 49,967 79,582 Mingalartaungnyunt 96,287 110,435 109,796 Pazundaung 34,763 38,306 38,363 Seikan Port 7,732 5,285 1,379 Seikkyi Kanaungto 12,458 15,393 25,586 Tamwe 106,682 119,914 128,455 Thaketa 145,888 193,028 279,799 District (South) Yankin 68,818 82,646 107,195 Ahlone 46,547 51,849 43,569 Bahan 85,757 102,112 95,114 Dagon 35,746 35,541 39,967 Kyauktada 37,772 37,634 44,076 Kyeemyindaing 64,145 69,866 87,491 Lanmadaw 42,691 41,663 40,597 Latha 31,646 31,061 32,535 Pabedan 40,718 41,913 47,461 District (West) Sanchaung 66,593 68,867 78,788 Total 2,027,256 2,467,676 3,691,941 Source: YCDC 2002
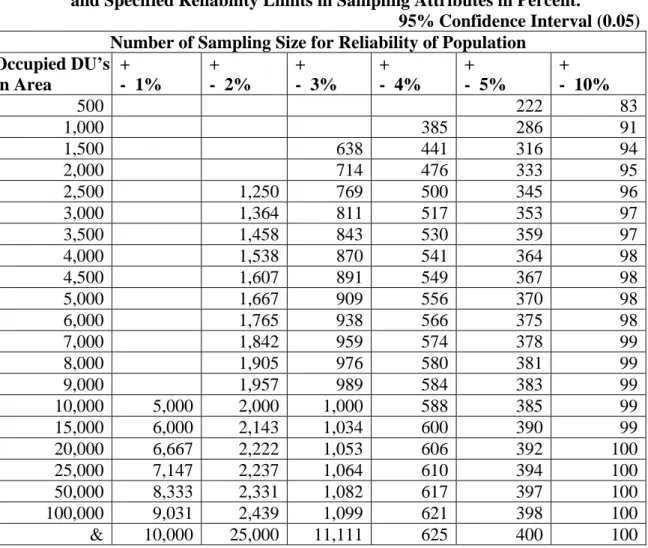
Table for Statisticians (Herbert Arkin and Raymond R. Colton, 1950)
Table 4: Table of Sample Size Required for Finite Population for Confidence Limits and Specified Reliability Limits in Sampling Attributes in Percent.
95% Confidence Interval (0.05) Number of Sampling Size for Reliability of Population
Occupied DU’s in Area + - 1% + - 2% + - 3% + - 4% + - 5% + - 10% 500 222 83 1,000 385 286 91 1,500 638 441 316 94 2,000 714 476 333 95 2,500 1,250 769 500 345 96 3,000 1,364 811 517 353 97 3,500 1,458 843 530 359 97 4,000 1,538 870 541 364 98 4,500 1,607 891 549 367 98 5,000 1,667 909 556 370 98 6,000 1,765 938 566 375 98 7,000 1,842 959 574 378 99 8,000 1,905 976 580 381 99 9,000 1,957 989 584 383 99 10,000 5,000 2,000 1,000 588 385 99 15,000 6,000 2,143 1,034 600 390 99 20,000 6,667 2,222 1,053 606 392 100 25,000 7,147 2,237 1,064 610 394 100 50,000 8,333 2,331 1,082 617 397 100 100,000 9,031 2,439 1,099 621 398 100 & 10,000 25,000 11,111 625 400 100
95 % Confidence Interval means that we have a 95% probability of being “correct” and only 5% of being “wrong” if we make 100guesses.
Table 5: Specification of Transmission Pipes
Name Pipe Material Diameter Length (km)
Operation Starting Year Gyobyu Pipe Mild Steel Pipe 1,400 mm
(56 inch)
68.6 1940 Phugyi Pipe Pre-stressed RC Pipe 1,500 mm
(60 inch)
25.9 1988 Hlawga Pipe (No.1) Cast Iron Pipe 1,050 mm
(42 inch)
22.9 1904 Hlawga Pipe (No.2) Pre-stressed RC Pipe 1,650 mm
(66 inch) 21.9 1988 Total length of Transmission Main 139.3 Source: YCDC 2002
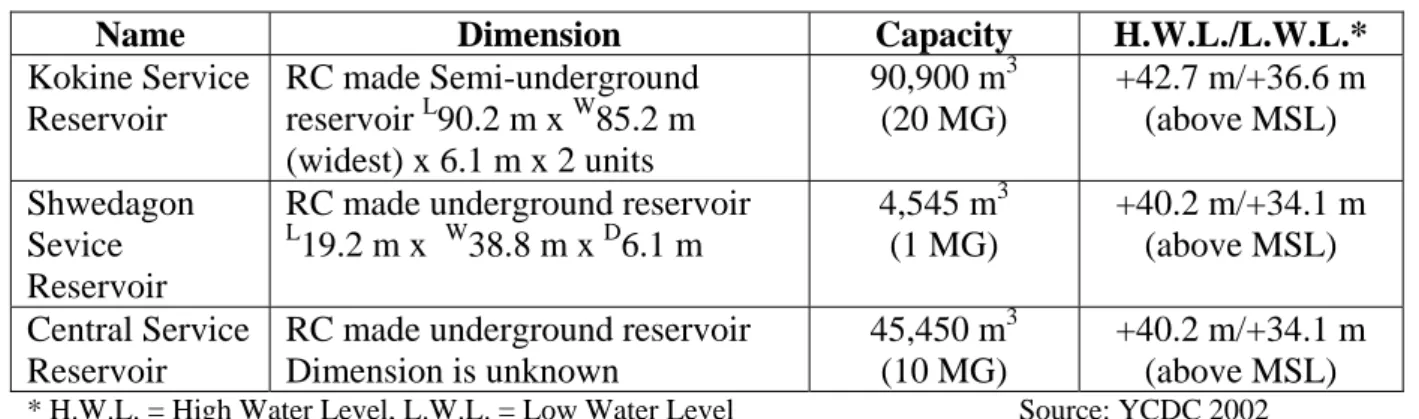
Table 6: Specification of Service Reservoirs
Name Dimension Capacity H.W.L./L.W.L.*
Kokine Service Reservoir RC made Semi-underground reservoir L90.2 m x W85.2 m (widest) x 6.1 m x 2 units 90,900 m3 (20 MG) +42.7 m/+36.6 m (above MSL) Shwedagon Sevice Reservoir
RC made underground reservoir L 19.2 m x W38.8 m x D6.1 m 4,545 m3 (1 MG) +40.2 m/+34.1 m (above MSL) Central Service Reservoir
RC made underground reservoir Dimension is unknown
45,450 m3 (10 MG)
+40.2 m/+34.1 m (above MSL) * H.W.L. = High Water Level, L.W.L. = Low Water Level Source: YCDC 2002
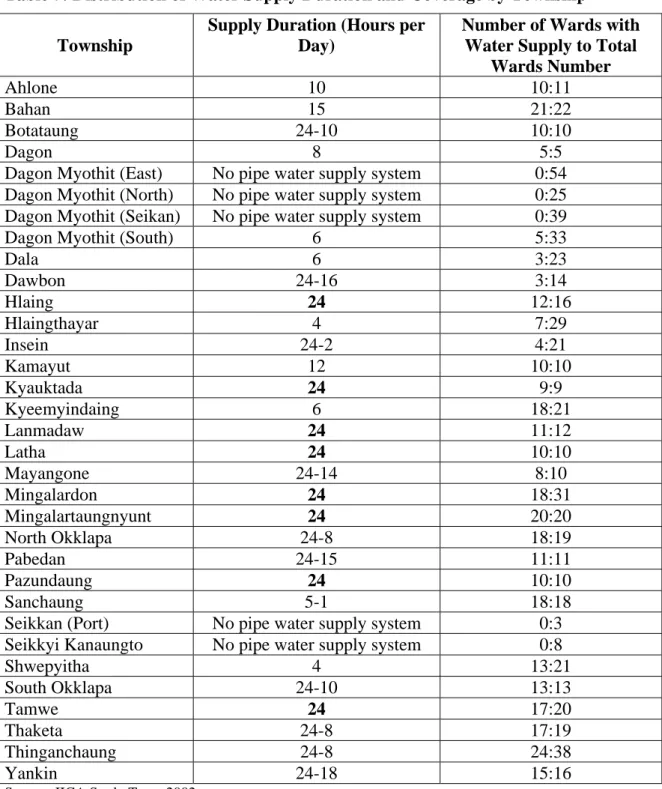
Table 7: Distribution of Water Supply Duration and Coverage by Township
Township
Supply Duration (Hours per Day)
Number of Wards with Water Supply to Total
Wards Number
Ahlone 10 10:11
Bahan 15 21:22
Botataung 24-10 10:10
Dagon 8 5:5
Dagon Myothit (East) No pipe water supply system 0:54 Dagon Myothit (North) No pipe water supply system 0:25 Dagon Myothit (Seikan) No pipe water supply system 0:39
Dagon Myothit (South) 6 5:33
Dala 6 3:23 Dawbon 24-16 3:14 Hlaing 24 12:16 Hlaingthayar 4 7:29 Insein 24-2 4:21 Kamayut 12 10:10 Kyauktada 24 9:9 Kyeemyindaing 6 18:21 Lanmadaw 24 11:12 Latha 24 10:10 Mayangone 24-14 8:10 Mingalardon 24 18:31 Mingalartaungnyunt 24 20:20 North Okklapa 24-8 18:19 Pabedan 24-15 11:11 Pazundaung 24 10:10 Sanchaung 5-1 18:18
Seikkan (Port) No pipe water supply system 0:3 Seikkyi Kanaungto No pipe water supply system 0:8
Shwepyitha 4 13:21 South Okklapa 24-10 13:13 Tamwe 24 17:20 Thaketa 24-8 17:19 Thinganchaung 24-8 24:38 Yankin 24-18 15:16
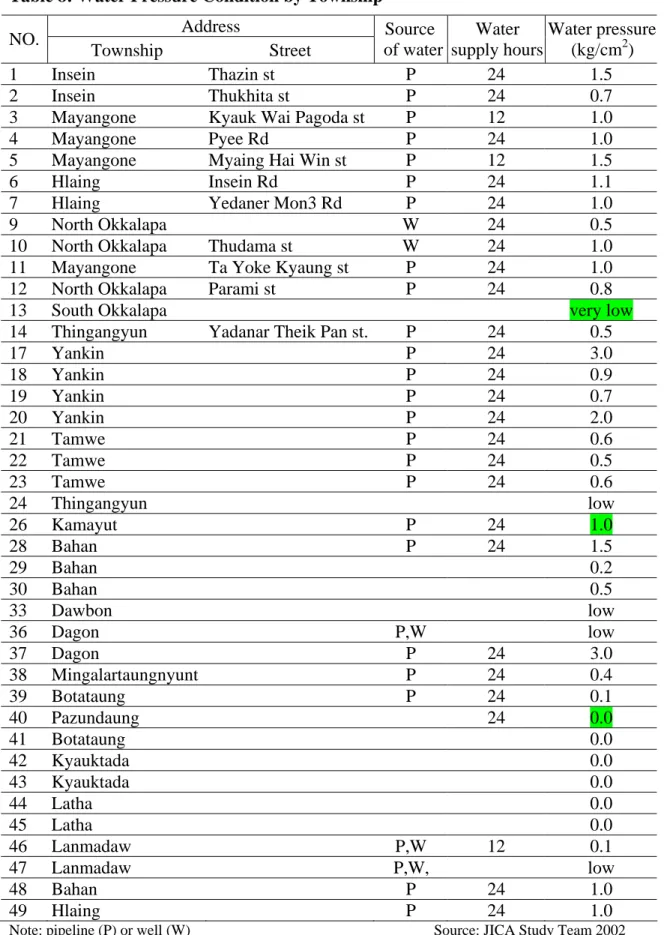
Table 8: Water Pressure Condition by Township Address NO. Township Street Source of water Water supply hours Water pressure (kg/cm2) 1 Insein Thazin st P 24 1.5 2 Insein Thukhita st P 24 0.7
3 Mayangone Kyauk Wai Pagoda st P 12 1.0
4 Mayangone Pyee Rd P 24 1.0
5 Mayangone Myaing Hai Win st P 12 1.5
6 Hlaing Insein Rd P 24 1.1
7 Hlaing Yedaner Mon3 Rd P 24 1.0
9 North Okkalapa W 24 0.5
10 North Okkalapa Thudama st W 24 1.0
11 Mayangone Ta Yoke Kyaung st P 24 1.0
12 North Okkalapa Parami st P 24 0.8
13 South Okkalapa very low
14 Thingangyun Yadanar Theik Pan st. P 24 0.5
17 Yankin P 24 3.0 18 Yankin P 24 0.9 19 Yankin P 24 0.7 20 Yankin P 24 2.0 21 Tamwe P 24 0.6 22 Tamwe P 24 0.5 23 Tamwe P 24 0.6 24 Thingangyun low 26 Kamayut P 24 1.0 28 Bahan P 24 1.5 29 Bahan 0.2 30 Bahan 0.5 33 Dawbon low 36 Dagon P,W low 37 Dagon P 24 3.0 38 Mingalartaungnyunt P 24 0.4 39 Botataung P 24 0.1 40 Pazundaung 24 0.0 41 Botataung 0.0 42 Kyauktada 0.0 43 Kyauktada 0.0 44 Latha 0.0 45 Latha 0.0 46 Lanmadaw P,W 12 0.1 47 Lanmadaw P,W, low 48 Bahan P 24 1.0 49 Hlaing P 24 1.0
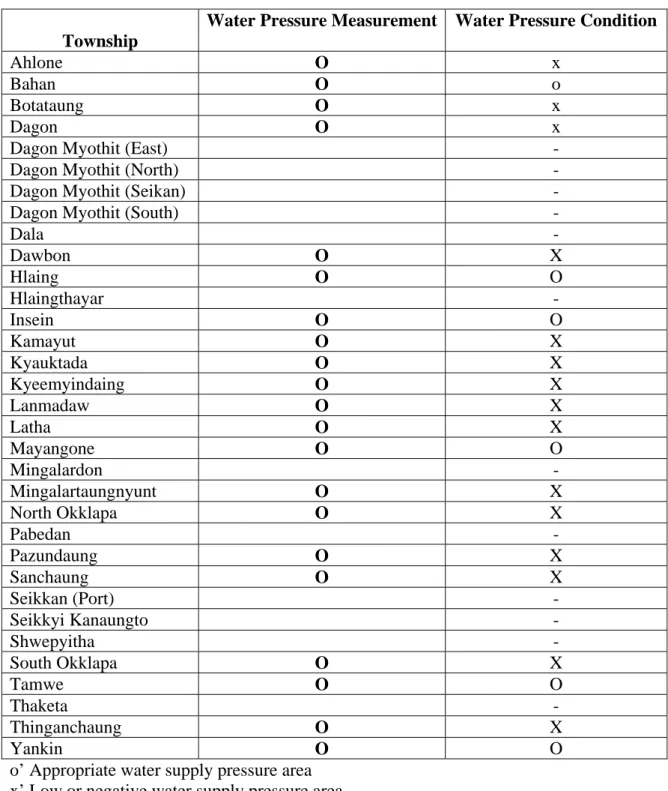
Table 9: Water Pressure Condition by Township
Township
Water Pressure Measurement Water Pressure Condition
Ahlone O x
Bahan O o
Botataung O x
Dagon O x
Dagon Myothit (East) -
Dagon Myothit (North) -
Dagon Myothit (Seikan) -
Dagon Myothit (South) -
Dala - Dawbon O X Hlaing O O Hlaingthayar - Insein O O Kamayut O X Kyauktada O X Kyeemyindaing O X Lanmadaw O X Latha O X Mayangone O O Mingalardon - Mingalartaungnyunt O X North Okklapa O X Pabedan - Pazundaung O X Sanchaung O X Seikkan (Port) - Seikkyi Kanaungto - Shwepyitha - South Okklapa O X Tamwe O O Thaketa - Thinganchaung O X Yankin O O
o’ Appropriate water supply pressure area x’ Low or negative water supply pressure area -‘ No measurement or no water supply system Source: JICA Study Team 2002
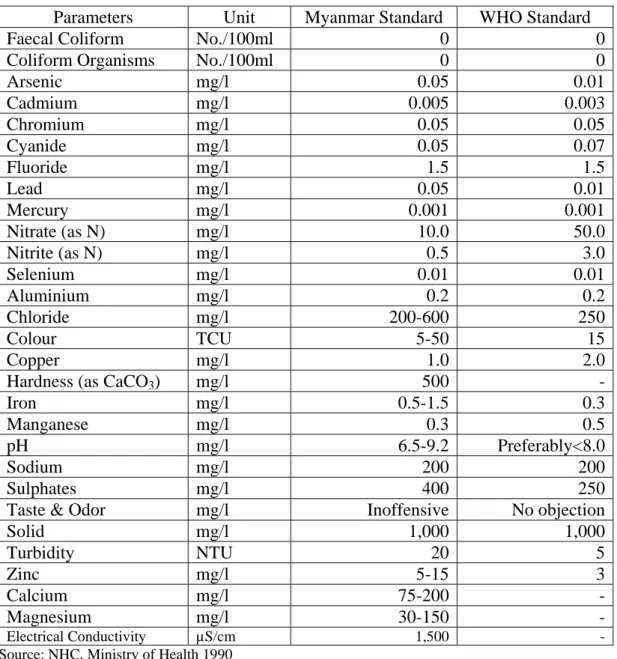
Table 10: Drinking Water Standard
Parameters Unit Myanmar Standard WHO Standard
Faecal Coliform No./100ml 0 0
Coliform Organisms No./100ml 0 0
Arsenic mg/l 0.05 0.01 Cadmium mg/l 0.005 0.003 Chromium mg/l 0.05 0.05 Cyanide mg/l 0.05 0.07 Fluoride mg/l 1.5 1.5 Lead mg/l 0.05 0.01 Mercury mg/l 0.001 0.001 Nitrate (as N) mg/l 10.0 50.0 Nitrite (as N) mg/l 0.5 3.0 Selenium mg/l 0.01 0.01 Aluminium mg/l 0.2 0.2 Chloride mg/l 200-600 250 Colour TCU 5-50 15 Copper mg/l 1.0 2.0
Hardness (as CaCO3) mg/l 500 -
Iron mg/l 0.5-1.5 0.3
Manganese mg/l 0.3 0.5
pH mg/l 6.5-9.2 Preferably<8.0
Sodium mg/l 200 200
Sulphates mg/l 400 250
Taste & Odor mg/l Inoffensive No objection
Solid mg/l 1,000 1,000 Turbidity NTU 20 5 Zinc mg/l 5-15 3 Calcium mg/l 75-200 - Magnesium mg/l 30-150 - Electrical Conductivity µS/cm 1,500 -
Table 11: Connection Number
Number of metered connection Number of unmetered connection Total connection %of
metered Township
Dmstic Dptmnt .
Com&Ind
. Foreign Total Dmstic Dptmnt. Com&Ind. Foreign Total Dmstic Dptmnt.
Com&Ind
. Foreign Total Domestic
1 Ahlone 109 2 111 2,112 38 50 - 2,200 2,221 38 52 2,311 4.9
2 Bahan 1,226 105 17 1,348 4,154 85 80 - 4,319 5,380 85 185 17 5,667 22.8
3 Botataung 755 5 118 878 3,927 100 132 - 4,159 4,682 105 250 5,037 16.1
4 Dagon 207 9 2 218 1,667 40 53 - 1,760 1,874 40 62 2 1,978 11.0
5 Dagon Myothit (East) - - - - - - - - -
6 Dagon Myothit (North) - - - - -7 Dagon Myothit (Seikka) - - - - -8 Dagon Myothit (South) - - - - -9 Dala 408 8 56 - 472 - 408 8 56 - 472 100.0 10 Dawbon 40 1 9 - 50 78 2 17 - 97 118 3 26 - 147 33.9 11 Hlaing 1,075 5 27 - 1,107 1,202 1 2 - 1,205 2,277 6 29 - 2,312 47.2 12 Hlaingthaya - - - - - - - - - 13 Insein 2,123 18 1,165 - 3,306 204 7 10 - 221 2,327 25 1,175 - 3,527 91.2 14 Kamayut 445 1 21 3 470 1,048 19 40 - 1,107 1,493 20 61 3 1,577 29.8 15 Kyauktada 373 11 172 1 557 5,679 96 212 - 5,987 6,052 107 364 1 6,544 6.2 16 Kyeemyindaing 59 59 1,865 30 24 - 1,919 1,924 30 271 - 1,978 3.1 17 Lanmadaw 1,055 7 115 1,177 4,835 46 249 - 5,130 5,890 53 145 - 6,307 17.9 18 Latha 795 1 36 832 3,924 38 235 - 4,197 4,719 39 136 - 5,029 16.8 19 Mayangone 1,496 1 144 3 1,644 1,966 40 1 - 2,007 3,462 41 412 3 3,651 43.2 20 Mingalardon 795 4 125 926 164 9 11 - 134 961 13 318 - 1,110 82.9 21 Mingalartaungnyunt 2,908 5 214 1 3.128 8,434 74 198 - 8,706 11,342 79 1,269 1 11,834 25.6 22 North Okkalapa 1,556 148 1,704 5,474 72 1,717 - 5,716 7,030 72 139 - 7,420 22.1 23 Pabedan 637 6 95 1 739 5,521 60 1,174 - 6,755 6,158 66 167 1 7,494 10.3 24 Pazundaung 1,452 15 52 - 1,519 4,411 48 87 - 4,546 5,863 63 - - 6,065 24.8 25 Sanchaung 138 11 - 149 3,175 40 156 - 3,371 3,313 40 - - 3,520 4.2 26 Seikan (port) - - - - - - - - - 27 Seikkyi Kanaungto - - - - - - - - - 28 Shwepyitha 1 2 - - 3 - - - - - 1 2 - - 3 100.0
29 South Okkalapa 440 4 76 - 520 4,113 97 121 - 4,331 4,553 101 197 - 4,851 9.7 30 Tamwe 3,062 1 58 1 3,122 11,377 78 107 - 11,562 14,439 79 165 1 14,683 21.2 31 Thaketa 227 1 20 - 248 2,025 61 202 - 2,288 2,252 62 222 - 2,536 10.1 32 Thingangyun 78 8 - 86 85 24 107 - 1,018 963 24 117 - 1,104 8.1 33 Yankin 1,150 5 153 11 1,319 3,780 66 32 - 3,878 4,930 71 185 11 5,186 23.3 Total 22,612 101 2.,939 40 25,692 82,020 1,171 3,472 - 86,663 104,632 1,272 6,411 40 112,315 21.6
Note: 26 townships have water connection., Dmstic = Domestic customers Dptmnt = Department customers
Com & Ind. = Commercial and Industrial Customers Foreign = Foreign customers
Table 12: Government Ministries involved in Water Supply within the Study Area Institutions &
Organizations
Water related activities Coverage Operational
Area
Yangon City Development Committee
Planning, construction, O&M and management of reservoirs, ponds, lakes, tube-wells, pipe networks, tanks, pumping stations and other facilities, related machinery and buildings. Actual supply of water for city dweller and industries
100 % to 20% customers in the townships where YCDC has water supply
28 Townships
Ministry of Home Affairs General Administration Department is responsible for the administration of Peace & Development Councils. PDCs have the responsibility for coordination of all development and social sector activities including water in townships.
Ministry of Co-operatives (Co-orperative Department )
Co-operative societies undertake planning, drilling tube-wells, install and manage water supply systems, provide water to society members, and overall management of water facilities
29 co-operative societies operate 33 tube-wells and distribute water to customers
12 Townships
Ministry of Agriculture & Irrigation (water resources Utilization Department)
Drilling tube-wells at the request of YCDC, other ministries and organizations
Has not drilled in YCDC area
Ministry of Construction (Dept of Human Settlement & Housing Development)
Issues licence for drilling wells, own and operate 18 tube-wells, provide water to ---- housing estates
Provide water to 20 housing estates and manage their water facilities
14 Townships
Ministry of Hotels & tourisms
Overall planning and coordination relating to hotel water supply, provide assistance and advice in providing water to hotels, coordinate with Ministry of Health for water quality monitoring
Each main hotel has a minimum of one tube-well
Throughout study area
Ministry of Health Monitoring water quality in private and industry tube-wells, issue certificate of fitness in respect of new tube-wells
All private and industry tube wells at the time of construction.
Subsequent quality monitoring is done of wells used by the industry on an annual basis
Throughout study area
Ministry of Industry I Overall planning and coordination of water supply for heavy industries
Ministry of Industry II Overall planning and coordination of water supply for small and cottage industries
Ministry of Livestock Feed Stuff and Fishery
Operation and maintenance of tube-wells owned by the ministry to provide water to livestock farms under the ministry, fisheries ponds, laboratories, and offices of the ministry.
All farms, laboratories and offices except for offices in Mingalardon and Insein town ships are supplied with own tube-wells.
Insein, Thaketa, Mingalardon, Dagon East, Dagon North Source: JICA Study Team 2002
Table 13: Private sector involvement in Water Supply in Yangon City
Source: JICA Study Team 2002 Type of
Organization Water-related Activity Coverage
Operational Area Individuals Digging and construction of tubewells and open wells; operate and manage
wells to supply water bear the cost of construction and operational cost; sharing and selling water
Entrepreneurs Digging and construction of deep tubewells; installation of water supply network to obtain water for domestic use and industries; sharing and selling water; management of private distribution networks; drilling, construction, operate and maintain tubewells; install, operate and manage private water supply systems for individual/groups of houses and industries; water selling to public and restaurants
Provide water needs of 100% of customers in different townships; provide 90% of the plumbing service in the study area
Private Organization Digging deep tubewells and install mechanisms to obtain water mainly for industries; manufacture and/or import materials needed for the water service organization including YCDC: stock and sell materials to the public and organizations
Table 14: Water Supply Activities of other Organization in Yangon City
Type of
Organization Water-related Activity Coverage
Operational Area Township Peace
and Development Council (Other)
Coordinate all development and social service activities including water supply in townships/wards; Resolve conflicts relating to water supply/demand; Provide leadership in and organize cleaning of drinking water lakes and adding alum to lakes; Distribute water (bottled) delivered by YCDC to customers
Coordination of activities with YCDC in 28 townships; lake cleaning work in 7 townships; distribute water (bottled) in Seikky Kanantungy township Ward Peace and
Development Council (CBO)
Coordination of development and social sector activities at the ward level; collect data on water sector activities including the numbers of wells and other water services.
Provide water needs of 100% of customers in different townships; provide 90% of the plumbing service in the study area
Union Solidarity and Development Organization (CBO)
Although the responsibility of this organization is to facilitate development at the grassroots level including water-related activities; provide logistic and organizational support to other organizations; provide information on broken pipes and leaks to supply staff; improve public awareness on water use
Through activities are insignificant scale at present cover the entire study area
Whole area
MSF – Holland (NGO)
Water sector service provision including improvement of hand pumps and water supply work
Hlainghtayar township
Committee Office WS SD HD AS REV VS IPR PG CS INS COR CPLAD RB MW BD PC AD BDG MK Joint- secretary Secretary
Vice Chairman (Vice Mayor)
Committee Member 5 Committee Member 4 Committee Member 3 PUD Chairman (Mayor)
CPLAD City Planning & Land Admin. Dept. PG Playgrounds, Parks & Gardens Dept. BD Engineering Dept. (Building) INS Inspection Dept.
RB Engineering Dept. (Road and Bridge) COR Coordination Dept. MW Motor Transport & Workshop Dept. CS Central Store Dept. AD Administration Dept REV Revenue Dept. BDG Budget Dept. AS Asessor’s Dept.
MK Market Dept. VS Veterinary & Slaughter House Dept. PC Pollution Control & Cleansing Dept. IPR Information & Public Relation Dept. PUD Production Unit Department H D Health Dept.
WS Engineering Dept. (Water and Sanitation) SD Security & Discipline Dept
Source: YCDC (2004)
Table 15: Group of Township in each District District Name Township Name
Dagon Myothit East Dagon Myothit North Dagon Myothit Seikkan Dagon Myothit South North Okkalapa South Okkalapa District (East) Thingangyun Hlaing Hlaingthaya Insein Kamayut Mayangone Mingalardon District (North) Shwepyitha Botataung Dala Dawbon Mingalartaungnyunt Pazundaung Seikan Port Seikkyi Kanaungto Tarmwe Thaketa District (South) Yankin Ahlone Bahan Dagon Kyauktada Kyeemyindaing Lanmadaw Latha Pabedan District (West) Sanchaung Source: YCDC Head Office, 2006
Table 16: Domestic Water Consumption by YCDC Water Customers
Township lit/cap/day
Dagon Myothit East 0
Dagon Myothit North 0
Dagon Myothit Seikkan 0
Dagon Myothit South 0
North Okkalapa 119 South Okkalapa 148 Thingangyun 127 Hlaing 146 Hlaingthaya 0 Insein 176 Kamayut 194 Mayangone 148 Mingalardon 179 Shwepyitha 0 Botataung 83 Dala 86 Dawbon 111 Mingalartaungnyunt 123 Pazundaung 99 Seikan Port 0 Seikkyi Kanaungto 0 Tarmwe 149 Thaketa 101 Yankin 271 Ahlone 75 Bahan 179 Dagon 173 Kyauktada 109 Kyeemyindaing 97 Lanmadaw 115 Latha 98 Pabedan 110 Sanchaung 109 Sub TOTAL Source: JICA, 2001
APPENDIX C
QUESTIONNAIRES AND CHECKLIST
Questionnaires for Domestic Household Survey (YCDC Water Supply Users)
The information collected from this questionnaires survey will be used for research purpose only. Please be frank and open-minded in your evaluations and opinions. All information obtained will be kept strictly confidential. Your kind cooperation is highly appreciated.
Questionnaire No.: …..………. Name of Interviewer: ……….………..
Date of interview: ………... I. Personal Information of Respondents
1. Name of respondent: ………... 2. Name of Township ………. 3. Address: ……….. 4. Sex 5. Age 6. Educational attainment 7. Occupation Sector Sector
8. How many persons live in your household?
Infants (less than 1 year old) ( ) persons Children (1-15 years old ( ) persons
Adults (more than 15 year old) ( ) persons Total ( ) persons
9. Please indicate type of dwelling (if your dwelling is apartment, please indicate the floor)
Type of dwelling Owned Rent Other (specify) Independent house
Apartment Others (specify)
10. Type of dwelling structure
11. Number of rooms in your dwelling Kitchen and dining room ( ) Bath room ( ) Living and bed room ( ) Toilet ( ) Total ( )
12. How long have you been living in this area? ……….Years
II. Socio-Economic Characteristic of Respondents 13. Monthly income (Kyats/month)
14. Does your household own the following items? If Yes, please describe quantity of each item.
No. Item Qty. No. Item Qty.
1 Telephone 9 Washing machine
2 Radio/cassette/recorder 10 Electric fan
3 Sewing machine 11 Air conditioner (water) 4 Refrigerator 12 Air conditioner (non-water)
5 Television 13 Microwave or oven
6 Computer 14 Bicycle
7 Generator 15 Motor cycle
8 Motor/pump 16 Car
15. Please indicate the monthly average household expenditure for the following utilities. No. Utility items Kyats/month Remarks
1 Waste water
disposal
For septic tank cleaning, wastewater disposal or treatment
2 Solid waste disposal For garbage collection and disposal
3 Gas For cooking and lighting
4 Electricity For cooking, lighting and electric appliance
5 Fuel For cooking, lighting
6 Telephone
7. Water For drinking, bathing, watering, etc Total
16. Please indicate monthly average household expenditure in following items. No. Utility items Kyats/month Remarks
1 Food & beverages Estimate average
2 Clothing Estimate average
3 House rent & repairs Apartment, house and land rental fee, etc 4 Charity & ceremonials Donation, marriage, funeral , etc.
5 Educational Including public and private school fee, books and so on.
6 Transportation 7 Medical care 8 Tax
Total
III. Water Sources, Usage and Consumer Interests on Water Supply System 17. Which water supply sources do your household use?
YCDC water supply sources
None YCDC water supply sources
18. What is the main water supply source for your household? Please select from above question No.17. ---
19. How does your household obtain the water from water supply sources?
20. If you answer “from taps”, how many taps do you have inside and outside of your house? Inside taps --- Outside taps --- Total --- 21. If you answer “by order”, how many time order for a day and how many drum have to
22. If you answer “by walk”, how long does it take you to get the water from the source per time?
23. Who mainly fetch the water in your household? 24. Does your household need to store water or directly use from water supply
distribution?
25. If yes, please indicate storage facility, capacity and quantity. Facilities Quantities Capacity (gallon or litre) Underground tank
Tank on ground Overhead tank Drum
Other (specify)
26. What purpose does your household use water from which source? (please see Q17) 27. How does your household use water for drinking purpose?
28. How do you feel about water quality from main water source in your household? Desirable (Nil) Slightly taste (some) Offensive (or) undesirable (specify) Taste
Color Odor
Appearance
29. Are you satisfied with the quality of main water source available in your household?
30. How do you feel about water quantity from main water source in your household? Rating Dry season Wet season
Sufficient
Sometime insufficient Insufficient
Insufficient mostly
31. How is water pressure from city water supply system without electric/fuel pump?
32. Does your household get steady supply of water from YCDC water supply system without using an electric/fuel pump?
33. If no, does your household need an electric/fuel pump to take water from YCDC water distribution pipeline?
If yes, please describe the power of motor. ---Watt or ---hp If others, how --- 34. If “Yes” for Q-32, how many hour per day do you get the water from YCDC water
distribution system without using electric/fuel pump? (please describe on average)
35. If “No” for Q-32, how many hours per day do you get the water from YCDC water distribution system by using an electric/fuel pump? (please describe on average)
36. What time does your household usually obtain the water from YCDC water distribution pipe? (on average)
37. Do you satisfy with current supply water both quantity and quality?
If No, why? --- 38. How do you think YCDC water supply system need to improve?
39. Are you willing to participate in upgrading process of water supply in or near your community?
40. Do you know how water is important for our human being life?
41. Do you think an importance for taking care of running water away unused through
leaks or wastage?
If yes, why? (please select one or more)
If no, why? (please select one or more)
42. Do you want (willing) to participate for preventing water running away through leaks
or wastage near your house?
43. If water leakage problem is in or near your household, how do you act for this problem? (please select one or more)
much cost
IV. Water Connection, Billing and Willingness to Pay for Water Supply 44. Who install for piped water connection?
45. Do you pay for water connection fee?
If yes, how much ---Kyats/connection
46. Does your household have a water meter?
If yes, is the water meter functioning? How much water do you consume per month? (Please check in your water bill) ----m3
47. If your household has no water meter, do you willing to install water meter and willing to pay for water according to water meter.
If No, why? --- 48. What tariff structure (or type of payment) does your household employ?
49. How frequently do you pay for water tariff?
50. How do you pay for water tariff?
51. How much your household pay for water in all purpose?
No. Water Usage Kyats/month
1 Drinking water purpose (bottle water)
2 Main water connection for all purpose (YCDC water bill) 3 Private water vender, tanker, for other supply water 4 Other (specify)
Total
52. How do you feel on current total water cost paid by your household?
53. Do you satisfy current water tariff structure?
If no, please give a reason --- 54. Do you satisfy current water tariff collection system?
If no, please give a reason --- 55. If YCDC will make some improvement for current water supply, are you willing to
pay more money for water supply service?
56. Are you willing to participate for the improvement of YCDC water supply service?
57. Do you know current laws, regulations and penalties for water users that obligated by YCDC?
58. Which way do you want to participate on water supply improvement and water resources sustainability? (Please select one or more)
Questionnaires for Domestic Household Survey (None YCDC Water Supply Users)
The information collected from this questionnaires survey will be used for research purpose only. Please be frank and open-minded in your evaluations and opinions. All information obtained will be kept strictly confidential. Your kind cooperation is highly appreciated.
Questionnaire No.: …..………. Name of Interviewer: ………..
Date of interview: ………... I. Socio-Economic Characteristic of Respondent Households
1. Name of respondent: ………... 2. Name of Township ………. 3. Address: ……….. 4. Sex 5. Age 6. Educational attainment 7. Occupation Sector Sector
8. How many persons live in your household?
Infants (less than 1 year old) ( ) persons Children (1-15 years old) ( ) persons
Adults (more than 15 years old) ( ) persons Total ( ) persons
9. Please indicate type of dwelling (if your dwelling is apartment, please indicate the floor)
Type of dwelling Owned Rent Other (specify) Independent house
Apartment Others (specify)
10. Type of dwelling structure
11. Monthly income (Kyats/month)
12. Number of rooms in your dwelling? Kitchen and dining room ( ) Bath room ( ) Living and bed room ( ) Toilet ( )
Total ( )
13. How long have you been living in this area? ……….Years 14. Does your household own the following items?
No. Item Qty. No. Item Qty.
1 Telephone 9 Washing machine
2 Radio/cassette/recorder 10 Electric fan
3 Sewing machine 11 Air conditioner (water)
4 Refrigerator 12 Air conditioner
(non-water)
5 Television 13 Microwave or oven
6 Computer 14 Bicycle
7 Generator 15 Motor cycle
8 Motor/pump 16 Car
15. Please indicate the monthly average household expenditure for the following utilities. No. Utility items Kyats/month Remarks
1 Waste water
disposal
For septic tank cleaning, wastewater disposal or treatment
2 Solid waste disposal For garbage collection and disposal
3 Gas For cooking and lighting
4 Electricity For cooking, lighting and electric appliance
5 Fuel For cooking, lighting
6 Telephone
7. Water For drinking, bathing, watering, etc Total
16. Please indicate monthly average household expenditure in following items? No. Utility items Kyats/month Remarks
1 Food & beverages Estimate average
2 Clothing Estimate average
3 House rent & repairs Apartment, house and land rental fee, etc 4 Charity & ceremonials Donation, marriage, funeral , etc.
5 Educational Including public and private school fee, books and so on.
6 Transportation 7 Medical care 8 Tax
II. Water Sources, Water Usage and Water Supply System 17. Which water supply sources do your household use?
YCDC water supply sources
None YCDC water supply sources
18. What is the main water supply source for your household? Please select from above question no. 17. ---
19. How does your household get the water from water supply sources?
If you answered “from taps”, how many taps do you have inside and outside of your house? Inside taps --- Outside taps --- Total --- If you answered “by order”, how many time order for a day and how many drum have to
order for a day? ---time/day, ---drum /day If you answered “by walk”, how long does it take you to get the water from the source per
time?
20. Who mainly fetch the water for your household? 21. Does your household need to store water or directly use from water supply distribution
22. If yes, please indicate storage facility, capacity and quantity. Facilities Quantities Capacity (gal or litre) Underground tank
Tank on ground Overhead tank Drum
Other (specify)
23. What purpose does your household use the water from which source? (please see Q17) 24. How does your household use water for drinking purpose?
25. How do you feel about water quality from main water source in your household? Desirable (Nil) Slightly taste (some) Offensive (or) undesirable (specify) Taste
Color Odor
Appearance
26. Are you satisfied with the quality of main water source for your household?
27. How do you feel about water quantity from main water source in your household? Rating Dry season Wet season
Sufficient
Sometime insufficient Insufficient
Insufficient mostly
28. Does your household need an electric/fuel pump to take water from tube well?
If yes, please tell us the power of motor. ---Watt or ---hp 29. Does your household get steady supply of water from your source of water supply?
30. Do you know how water is important for our human being life? 31. Do you think an importance for taking care of running water away unused through
leaks or wastage? If yes, why? --- If no, why? --- 32. If water leakage problem is in or near your household, how do you act for this
problem? much cost
III. Water Connection, Billing and Willingness to Pay for Water Supply System 33. Do you know who does the installation of piped water connection?
34. Do you pay for water supply connection?
If yes, how much ---Kyats/connection
35. If your household uses your own tube well, do you know tube well license?
36. If yes, do your household tube well have license? 37. How much do you pay for it? ---Kyats/tube well
38. How much your household pay for water in all purposes?
No. Water Usage Kyats/month
1 Drinking water purpose (bottle water) 2 Main water connection for all purpose 3 Private water vender, tanker
39. How do you feel on the current total water cost paid by your household?
40. If you use private water connection, how do you pay for water using in your household?
3
41. Do you satisfy with current water supply system available in your household?
If No, why? --- 42. If YCDC water supply connection will be made available for your household and you
can get necessary amount of water but you have to pay for water with metering rate, would you willing to connect?
43. Are you willing to participate in YCDC water supply upgrading process in near your area?
44. If yes, how much will be the maximum amount of money paying for getting water per month? ---Kyats/month
45. Do you know current laws, regulations and penalties related to water supply users that imposed by YCDC?
46. Which way do you want to participate on water supply improvement and water resources sustainability? (Please select one or more)
Checklists For Informants Interview With Government Officials
1. Water authorities concerned in YCDC, WSS Department, Districts, and Township 2. Total number of residents who are living in study area
3. Income and expenditure for water supply system in last 10 years 4. Average daily water production
5. Annual rainfall, land use, population of Yangon City 6. Water tariff structure, penalties
7. Current situation of financial, administrative, legislative, political
8. Existing enforcement policy of the government in term of laws and regulation compliance, relating with water
9. Informant opinion about existing water supply system management situation 10. Operation and maintenance practices
11. Education and training program of the authorities for raising NRW awareness, working skills and people participation.
12. Organization structure of responsible parties
13. Opinion about willingness to pay and willingness to participate in water supply system management of professional persons, retire experts, responsible person who are very well understand about NRW control in water supply
14. Opinion of staff, professional persons, officer who related organization of water supply management
15. Their solution and recommendation to reduce NRW in water supply system management for Yangon City
APPENDIX - D
RESPONDENT’S SURVEY RESULT
Table 1: Main Source of Water of YCDC Supply Water Users
No. Source of Water f Percent (%) 1 Household taps connected to YCDC pipe water supply 110 54 2 YCDC supply public water tap (stand pipe) 36 18 3 Household taps connection + stand pipe users 56 27
4 YCDC supply communal tank 3 1
5 YCDC supply water tanker -
-6 YCDC own lakes and ponds -
-Total 205 100
Source: Field survey 2006 Note: f = frequency Table 2: Main Water Source for Non-YCDC Water Supply Customers
No. Source of water f Percent (%) 1 Household tap connected to neighbor tube well 14 16 2 Private tube well installed with electric/fuel pump 42 47 3 Private tube well installed with hand pump 12 13
4 Unprotected dug well (open type) 3 3
5 Protected dug well (covered type) -
-6 Private water tanker 15 17
7 Rain water 4 4
Total 90 100
Source: Field survey 2006 Note: f = frequency
Table 3: Way of Taking Water Treatment for Drinking Purpose by YCDC Customers
Way of Water Treatment f Percentage (%)
Buying Bottle Water 38 18.5
Boiled Water 24 11.7
Filtered Water 86 42.0
Filtered and Boiled Water 41 20.0
Others 16 7.8
Total 205 100
Source: Field survey 2006 Note: f = frequency
Table 4: Way of Taking Water Treatment for Drinking Purpose by Non-YCDC Customers
Way of Water Treatment f Percentage (%)
Buying Bottle Water 22 24.2
Boiled Water 5 5.6
Filtered Water 37 41.2
Filtered and Boiled Water 17 18.9
Others 9 10.0
Total 90 100.0
Table 5: Duration of Water Getting from YCDC Supply Line by Using Pump Time (Avg. Duration) f Percentage (%)
<4 hr 8 4.4 4 hr 2 1.1 6hr 57 28.0 12hr 37 18.0 18hr 2 1.2 24hr 97 47.3 Total 188 100
Source: Field survey 2006
Table 6: Duration of Water Getting from YCDC Supply Line without Using Pump Time (Avg. Duration) f Percentage (%)
<4 hr 16 8.7 4 hr 3 1.5 6hr 57 30.3 12hr 51 27.3 18hr 1 0.5 24hr 60 31.7 Total 188 100
Source: Field survey 2006
Table 7: Respondents’ Perception on Sufficiency of Supply Water (YCDC Customers)
Sufficient for whole year Insufficient in dry season Insufficient in whole year No Answer Total Township f % f % f % f % f % S.Okkalapa 16 29.6 17 31.5 16 29.6 5 6.5 54 100.0 Sanchaung 9 29.0 9 29.0 12 38.7 - - 31 100.0 Kamayut 20 33.3 27 45.0 13 21.7 - - 60 100.0 Puzundaung 19 31.7 25 41.7 14 23.3 2 3.3 60 100.0 Total 64 31.2 79 38.1 55 27.3 7 3.4 205 100.0 Source: Field survey 2006
Table 8: Respondents’ Perception on Sufficiency of Supply Water (Non-YCDC Customers)
Sufficient for whole year Insufficient in dry season Insufficient in whole year No Answer Total Township f % f % f % f % f % S.Okkalapa 17 73.8 3 13.0 2 8.9 1 4.3 23 100.0 Sanchaung 42 89.4 4 8.5 1 2.1 - - 47 100.0 Kamayut 18 90.0 1 5.0 1 5.0 - - 20 100.0 Puzundaung - - - 100.0 Total 77 86.2 8 8.5 4 4.2 1 1.1 90 100.0
Table 9: Respondent’s Satisfaction of Current Supplied Water Quality (YCDC customers)
Satisfied Do not satisfied No Answer Parameter
f % f % f %
Odor 177 86.3 28 13.7 -
-Color 170 82.8 35 17.2 -
-Taste 195 95.0 10 5.0 -
-Source: Field survey 2006 Note: f = frequency
Table 10: Respondent’s Opinion on Water Price
Expensive Right Amount Above right Amount Cheap Respondents
f % f % f % f %
YCDC Customers 15 7.0 176 86.0 10 5.0 4 2.0
Non-YCDC Customers 51 56.5 27 30.0 9 10 3 3.5 Source: Field survey 2006 Note: f = frequency
Table 11: Water Consumption of Industrial Zones in Yangon
No. of plot No. of Operating Plot Water Consumption (m3/day) Zone Name Area
(ha) Total Opera -ting % Start (year) No. of worker 2000 2005 2010 2015 2020 2000 2005 2010 2015 2020 Shwepyitha 254 584 101 17.3 1992 14,432 101 Hlaingthayar 580 1048 271 25.9 1995 36,543 271 543 814 1,048 1,048 5,402 10,834 16,226 20,890 20,890 Dagon South 157 2019 737 36.5 1992 11,822 737 1,198 1658 2,019 2,019 14,691 23,880 33,049 40,245 40,245 Dagon Seikan 334 432 22 5.1 1996 3,606 22 50 77 105 132 439 997 1535 2093 2631 Mingaladon 90 39 2 5.1 1995 NA 2 4 6 8 10 40 80 120 159 199 Shwepaukkan 31 348 70 20.1 1998 4,205 70 245 348 348 348 1,395 4,884 6,937 6,937 6,937 Yangon 22 194 0 0.0 2000 0 29 58 87 116 0 578 1156 1734 2312 Sub total 1,468 4,664 1,203 25.8 70,608 Planned Dagon East 200 2003 0 9 30 51 73 0 179 598 1,017 1,455 Shwehitha 161 2004 0 12 72 131 191 0 239 1435 2,611 3,807
Source: DHSHD (Department of Human Settlement and Housing Development), JICA Study Team Consumer Survey, 2001
Table 12: Respondent’s Income Distribution in Each Township of Study Area S Okkalapa Sanchaung Kamayut Puzundaung Total Monthly Income f % f % f % f % f % <100,000 21 27.3 4 5.1 2 2.5 14 23.3 41 13.9 100,001- 200,000 53 68.8 59 75.6 69 86.3 44 73.4 225 76.3 >200,001 3 3.9 15 19.2 9 11.2 2 3.3 29 9.8 Total 77 100.0 78 100.0 80 100.0 60 100.0 295 100.0 Source: Field survey 2006
Table 13: Respondent’s Household Expenditure Distribution in Each Township of Study Area S Okkalapa Sanchaung Kamayut Puzundaung Total
Monthly HH Expenditure f % f % f % f % f % 40,001-60,000 2 2.6 - - - 2 0.7 60,001-80,000 16 20.8 4 5.1 2 2.5 11 18.3 33 11.2 80,001-100,000 33 42.9 25 32.1 17 21.3 11 18.3 86 29.1 100,001-120,000 4 5.2 6 7.7 19 23.7 7 11.7 36 12.2 120,001-140,000 9 11.6 17 21.8 16 20.0 14 23.3 56 19.0 140,001-160,000 11 14.3 21 26.9 18 22.5 15 25.0 65 22.0 160,001-180,000 2 2.6 2 2.6 2 2.5 - - 6 2.0 180,001-200,000 - - 3 3.8 4 5.0 2 3.4 9 3.1 Above 200,001 - - - - 2 2.5 - - 2 0.7 Total 77 100.0 78 100.0 80 100.0 60 100.0 295 100.0 Source: Field survey 2006
Table 14: Comparison of Average Monthly Expenditure of Respondents % of Total Income No. Expenditure Items
YCDC water customers
Non-YCDC water customers
1 Foods and beverages 52.1 50.6
2 Clothing 2.1 2.0
3 House rent and repairs 1.2 1.2
4 Charity and ceremonials 2.2 2.0
5 Education 8.2 8.0
6 Transportation 5.4 7.2
7 Medical care 3.0 2.5
8 Utilities (telephone, electricity, fuel, water, etc.) 21.7 23.9
9 Tax 1.4 1.1
10 Saving amount 2.7 1.5
Total 100.0 100.0
Source: Field survey 2006
Table 15: Comparison of Average Monthly Utilities Expenditure of Respondents YCDC water customers Non-YCDC water customers Expenditure for utility
% of total utility expenses % of total utility expenses
Water 5.3 20.2
Waste water disposal 3.3 3.3
Electricity 44.0 41.0
Solid waste disposal 2.4 1.8
Gas 9.7 9.7
Fuel 13.9 11.9
Telephone 21.4 12.1
Total 100.0 100.0
APPENDIX E PHOTO SECTION
YCDC Official explain about Yangon City Water Supply System
Schematic Flow Diagram of New Water Supply Project (Ngamoeyike Water Supply Project)
Hlawga Reservoir
Pumping Station in New Water Supply Project
Cleaning Floating Material from Water Treatment Plant by Manual Practice in City Water Supply Project
Water Authority’s Demonstration in New Water Treatment Plant Project
Sludge Disposing Practice from New Water Treatment Plant (This Water Drainage to Agricultural Paddy Field)
Communal Tank Practices in City Water Supply System
Water Meter Installation and Maintenance Practices in City Water Supply Management
Water Distribution Pipe Rehabilitation Project