研 究
Analysing the Reasons for Financial Reporting Innovation:
The Case of Group Accounting in the UK 1927-1951
Eri Kanamori
1 Introduction
Financial reporting is considered undoubtedly regulated by disclosure rules, but at the same time it is also considered true that it is created, innovated or introduced by company directors. The role of company directors in preparing financial reports has long been discussed, because there could not be a single set of accounting procedures that produce indisputably ‘correct’ financial statements. For example, Dicksee (1924: 298) noted ‘until an undertaking has actually been wound up, any statement as to the profits earned is merely an estimate, or a statement of opinion, and not a question of fact’ 1). Financial reporting seems inevitably related to company directors’ estimation or opinions.
This article focuses on financial reporting innovation that was achieved by company directors. It studies accounting innovation regarding group accounting information in the U.K. between 1927 and 1951. In the United Kingdom, it was not until 1948 that all holding companies were required to submit group accounts in the form of consolidated balance sheet and consolidated profit and loss statement. Accordingly, the years from 1927 to 1947 represent the period when there was no regulation regarding the form of group accounts. It is considered appropriate to study group accounting practices during the period, because it enables to distinguish accounting innovations achieved by company directors from those by regulations. The years from 1948 to 1951 are also studied for the additional analysis of the influence of introduction of regulations on the group accounting reporting.
This paper examines four variables of the companies investigated − i.e. their auditors, their size, their stock exchange (whether they were quoted on the London Official List
THE RITSUMEIKAN BUSINESS REVIEW Vol. XLVI No.2
or on a provincial stock exchange) and their type of business (Iron, Coal & Steel (ICS) or Commercial & Industrial (CI)) − to discover whether they help to explain the accounting innovation achieved by company directors. It will be shown that the engagement of particular auditors (Cooper Brothers (CB), Thomson McLintock (TM), Price Waterhouse (PW) and Peat Marwick, Mitchell (PMM)), company size (the big companies) and where they were quoted (the Official List) seem to have relation to the adoption of group accounting. Further, consolidated accounts are found to be adopted by almost all British holding companies in later years irrespective of who audited them, their size, where they were quoted and types of their business. Moreover, it will be revealed that CB-audited companies were more likely to use the equity method in early years, but that company size and location listed appear not to have influenced use of the equity method.
2 Research design
The holding companies examined in this study were selected through following process. First, all Iron, Coal & Steel companies (IC&S companies) and the Commercial & Industrial companies (those companies whose names start with A, B, C and D) (C&I companies) listed in the Stock Exchange Year Books2) of 1926, 1933, 1942, 1946 were selected3). For 1950/51, the companies whose names start with A and B, only, provided a comparable-sized sample. Second, from amongst these companies were identified those where information about their auditors, their issued capitals and the stock exchanges on which they were listed are all given4). This produced: 223 IC&S companies and 308 C&I companies for 1927/28; 188 IC&S companies and 333 C&I companies for 1930/31; 183 IC&S companies and 381 C&I companies for 1942/43; 197 IC&S companies and 407 C&I companies for 1946/47; and 184 IC&S companies and 539 C&I companies for 1950/51.
From these sets, companies are classified as holding companies for the purpose of this study where one or more of the listed conditions are satisfied:
2) Stock Exchange Year Books of 1926, 1933 and 1952 were used instead of 1927, 1930 and 1950 because the latter were unavailable to the author.
3) Company accounts are stored at Guildhall Library in alphabetical order. In other words, published accounts of those companies whose names start with A, B, C and D are filed together. This is why this study selects the companies data in this manner, rather than at random. When the sample is gathered at random, it is necessary to consult 86 volumes, which would make this investigation impractical. However, 31 volumes are enough when following the manner this study adopted. The consultation is limited to 10 items in any one day at Guildhall Library.
4) There are some companies who lack all three types of information, mainly because of being founded abroad or any other reasons.
For 1927/28,
・any type of group accounts is submitted;
・the legal entity-based balance sheet identifies the existence of a ‘subsidiary’ or ‘associated company’ through entries such as ‘shares in subsidiary (associated company)’ and ‘loans to subsidiary (associated company)’;
・the legal entity-based balance sheet itemizes ‘shares in the other companies’5);
・the legal entity-based balance sheet shows name(s) of other company(ies)6) among the list of assets7).
For 1930/31, 1942/43, 1946/47,
・any type of group accounts is submitted;
・the legal entity-based balance sheet identifies the existence of a ‘subsidiary’ through entries such as ‘shares in subsidiary’ and ‘loans to subsidiary’;
・the legal entity-based balance sheet is accompanied by a statement from the directors in compliance with Section 126 of CA29 concerning how a subsidiary has been accounted for.
For 1950/51,
・any type of group accounts is submitted;
・the legal entity-based balance sheet identifies the existence of a ‘subsidiary’ through 5) It is, of course, unknown if ‘the other companies’ are subsidiaries or not. However, the reasons of selecting those companies as holding companies in this study are following. First, in 1927/28, the term ‘subsidiary’ was not uniformally adopted. Some companies use the term ‘associated company’ and some companies specify the names of subsidiaries. Second, in 1920s assets are only classified in balance sheets, often in very broad terms, and it is not unusual to find some companies listing assets under only a couple of headings. Under these circumstances, the relatively specific item of ‘shares in the other companies’ makes it clear that the investment has different characteristics from investments such as government securities. Third, at the time of Greene Committee, a witness (the London Chamber of Commerce) used the term ‘investments in other companies which are subsidiary to or associated with the Company in question’ (cited in Walker, 1978: 65) (emphasis added). Therefore it seems plausible to infer that ‘shares in the other companies’ is an abbreviation of ‘shares in the other companies which are subsidiary to or associated with the company’.
6) Banks at which cash was held were naturally excluded.
7) It is, of course, unknown if the companies whose names are shown in balance sheets are subsidiaries or not. However, there are cases where holding company accounts show a company’s name and add the company ’s profit to holding company’s profit. In this study the treatment is classified as the equity method. For example, see the accounts of The British Automatic Company Limited, dated at 30th September, 1927.
entries such as ‘shares in subsidiary’ and ‘loans to subsidiary’;
・the legal entity-based balance sheet is accompanied by a statement from the directors in compliance with Schedule to the CA48 concerning why no group accounts are submitted.
For all years, the mere appearance of the item ‘investment’ in the balance sheet does not result in an entity being treated as a holding company due to the inability to attach any particular significance, in terms of the level of share ownership, to that label. Also, where subsidiaries have not been trading during the year or where holding company directors state that all subsidiaries’ accounts were not be available for them (usually the explanation is that they were operating abroad), the holding company is excluded from the sample. As a result, 168 companies in 1927/28, 264 companies in 1930/31, 323 companies in 1942/43, 364 companies for 1946/47 and 426 companies for 1950/51 have been extracted as a data for this study. Table 1 summarises the results.
This study recognises and distinguishes between six methods of group accounting. This categorization is based on a previous literature (Edwards and Webb, 1984), except for modification of the definition of method 18).
Method 1: The inclusion of profits and losses of subsidiary companies in the holding company’s statutory (legal entity-based) accounts irrespective of dividends actually declared or paid.
8) Edwards & Webb (1984) describe method 1 as ‘Profits earned by subsidiaries accounted for on the accruals basis in the holding company’s statutory accounts’, but this has been changed as above in the text since the original definition cannot handle cases where subsidiary companies incur losses.
Method 2: Balance sheets of subsidiaries published in addition to the holding company’s statutory accounts.
Method 3: Combined statement of assets and liabilities of subsidiaries published in addition to the holding company’s statutory accounts.
Method 4: Combined statement of assets and liabilities of group published in addition to the holding company’s statutory accounts
Method 5: Consolidated balance sheet published instead of the holding company’s statutory accounts
Method 6: Consolidated balance sheet published in addition to the holding company’s statutory accounts.
The method 1 is not always the same as today’s equity method. This is partly because, in the first half of twentieth century, the inclusion of profits and losses of subsidiary companies did not always clearly related to the valuation of asset items such as ‘shares in subsidiaries’, although the profits and losses are reflected in the amount of the holding company’s own capital. Moreover, it occurred quite often that a full amount of, rather than a proportionate amount of, losses incurred by subsidiary companies was provided for Table 1 Holding Companies Investigated
Iron, Coal & Steel Commercial & Industrial examined holding cos
(a+b) all cos cos judged to be holding cos (a) A-, B-, C-, & D- cos* cos judged to be holding cos (b)
1927/28 223 81 36.3% 308 87 28.2% 168
1930/31 188 96 51.1% 333 168 50.5% 264
1942/43 183 100 54.6% 381 223 58.5% 323
1946/47 197 111 56.3% 407 253 62.2% 364
1950/51 184 91 49.5% 539 335 62.2% 426
* A- and B- company for 1950/51
Source: derived from an analysis of company accounts
Table 2 Companies Employing Group Accounting Methods 1-6
sample companies employing group accounts holding
cos method 1 method 2 method 3 method 4 method 5 method 6 other** total*
1927/28 168 7 1 2 3 13 100.0% 4.2% 0.6% 1.2% 0.0% 0.0% 1.8% 7.7% 1930/31 264 36 3 2 1 2 9 53 100.0% 13.6% 1.1% 0.8% 0.4% 0.8% 3.4% 20.1% 1942/43 323 41 9 1 1 1 41 94 100.0% 12.7% 2.8% 0.3% 0.3% 0.3% 12.7% 29.1% 1946/47 364 49 8 3 1 2 127 190 100.0% 13.5% 2.2% 0.8% 0.3% 0.5% 34.9% 52.2% 1950/51 426 34 16 1 2 371 4 428 100.0% 8.0% 3.8% 0.2% 0.5% 87.1% 0.9% 100.5%
* 1 company in 1927/28 (1&6), 4 companies in 1930/31 (1 company adopting 1&2 and 3 companies adopting 1&6), 12 companies in 1942/43 (1 company adopting 1&2, 1 company adopting 1&4, 11 companies adopting 1&6), 29 companies in 1946/47 (1 company adopting 1&3, 28 companies adopting 1&6, 1 company adopting 2&6) and 31 companies in 1950/51 (29 companies adopting 1&6, 1 company adopting 2&3, 1 company adopting 2&6) are counted twice.
** other 1950/51 2&3&6 1 company
parent B/S + consolidated P/L 2 companies new type 1 company
THE RITSUMEIKAN BUSINESS REVIEW Vol. XLVI No.2
by the holding company. In this study the term ‘equity method’ is used for indicating the method 1, but the above difference from today’s usage should be kept in mind.
Table 2 shows the number and proportion of holding companies which were judged to be employing group accounting methods 1-6.
All holding companies thus investigated are companies where information about their auditors, their issued capitals, the stock exchanges on which they were listed and their type of business are all available. The availability of these data for each company makes it possible to identify (and then analyse) any relationships between each variable and the group accounting practices adopted by the holding companies. The relationship between auditors and group accounting practices is first examined (3.1). The relationship between issued capitals and adopted group accounting methods is then focused on (3.2), with an assumption that the issued capitals of the companies represent their sizes. The stock exchanges where they were listed are consulted in order to see if there is any regional effect on group accounting practices (3.3). Finally, the relationship between type of business and group accounting practices is examined (3.4).
3 Analysis
3.1 Auditor analysis
This paper first focuses on the relationship, if any, between accounting firms and the group accounting practices adopted by the holding companies that they audited. In this paper, those accounting firms which audited more than five companies are selected for study. It is considered that five is minimum number of clients required in order to make a meaningful judgement. When two accounting firms audit one company jointly, the number of its client is measured as one-half.
Table 3 shows the accounting firms which audited more than five companies and the group accounting methods which their clients adopted.
Firstly, the relationship between group accounting as a whole and accounting firm can be observed by consulting the two right-hand columns in Table 3. In 1927/28, 21.7% (= 2.5/11.5) clients of Cooper Brothers & Co. (CB) and 11.4% (= 2/17.5) clients of Price Waterhouse & Co. (PW) adopted group accounting. These proportions are higher than overall average (7.7% = 13/168). This finding suggests that these two accounting firms were a little more willing than other firms to encourage or allow their clients to publish group accounts in 1927/28. A similar pattern of certain accounting firms having a greater
Table 3 Auditor Analysis
1927/28 method 1 method 2 method 3 method 4 method 5 method 6 total all cos
Alfred Tongue & Co 0 6 1/2
Cooper Brothers & Co 2 1/2 2 1/2 11 1/2
Deloitte, Plender, Griffiths & Co 1/2 1/2 10 Price Waterhouse & Co 1 1 2 17 1/2
2 1/2 0 1 0 0 1 1/2 5 45 1/2 Other firms 4 1/2 1 1 0 0 1 1/2 8 122 1/2 7 1 2 0 0 3 13 168 1930/31 method 1 method 2 method 3 method 4 method 5 method 6 total all cos
Alfred Tongue & Co 1 1/2 1 1/2 7 1/2
Carter & Co 1/2 1/2 5 1/2
Cooper Brothers & Co 2 2 10 1/2
Deloitte, Plender, Griffiths &
Co 4 1 1 6 21
Josolyne, Miles, Page & Co 1 1 5 1/2
Peat, Marwick, Mitchell &
Co 2 1 1 4 22 1/2
Price, Waterhouse & Co 2 3 5 25 Thomson McLintock & Co 1 1/2 1 1/2 5 1/2 12 2 1 1/2 1 5 21 1/2 103 Other firms 24 1 1/2 1 1 4 31 1/2 161 36 3 2 1 2 9 53 264 1942/43 method 1 method 2 method 3 method 4 method 5 method 6 total all cos
Alfred Tongue & Co 1 1 7
Cooper, Brothers & Co 3 1 4 10
Deloitee, Plender, Griffiths &
Co 3 2 1 1 1/2 7 1/2 23 1/2
Peat, Marwick, Mitchell &
Co 7 1/2 3 7 17 1/2 31
Price Waterhouse & Co 4 2 6 29
Sharp, Parsons & Co 0 5
Thomson McLintock & Co 2 1/2 3 5 1/2 10 1/2 20 5 1 15 1/2 41 1/2 116 Other firms 21 4 1 1 25 1/2 52 1/2 207 41 9 1 1 1 41 94 323 1946/47 method 1 method 2 method 3 method 4 method 5 method 6 total all cos
Alfred Tongue & Co 1 1 7
Carter & Co 1 1 3 5 7
Cooper Brothers & Co 3 6 9 9
Deloitee, Plender, Griffiths &
Co 3 9 12 24
Gane, Jackson, Jefferys &
Freeman 1 1 1 3 5
Josolyne, Miles, Page & Co 1 1 3 5 6
Kerr, Macleod & Macfarian 1 1 5
Moores, Carson & Watson 1 1 6
Peat, Marwick, Mitchell &
Co 4 1 14 19 32
Price Waterhouse & Co 9 1 16 1/2 26 1/2 30 Sharp, Parsons & Co 2 1 1 4 5 Thomson McLintock & Co 2 8 10 12 Turquand, Youngs, McAulifee & Co 1 1 7
27 4 1 1 1 63 1/2 97 1/2 155 Other firms 21 4 2 1 63 1/2 92 1/2 209 49 8 3 1 2 127 190 364
proportion of clients adopting group accounting procedures also applies in the other years studied and this phenomenon is further examined in Table 4.
In Table 4, CB and Thomson McLintock & Co. (TM) have four times as many clients choosing to publish group accounts, and PW and Peat, Marwick, Mitchell & Co. (PMM) three times as many. It is therefore possible to suggest that these four accounting firms and their clients may have influenced the rate of adoption in the period from 1927 to 1951. Secondly, the possible relationship between consolidated accounts and accounting firms can be observed by consulting proportions of clients adopting consolidated accounts (method 6) compared with clients adopting any method of group accounting. It is assumed for the purpose of this study that, where more than one half (50%) of clients which adopt any method of group accounting are adopting consolidated accounts, the accounting firm and its clients favour the publication of consolidated accounts. Table 5 lists the auditing firms whose clients adopted consolidated accounts with the probability of more than 50% in the period from 1927 to 1951. In Table 5, it is clear that there is a big difference between the three earlier years (1927/28, 1930/31, 1942/43) and the two later years (1946/47 and 1950/51). To put it more specifically, in the earlier years one or two accounting firms appear to favour the publication of consolidated accounts, whereas in the later years most of the accounting firms investigated favoured towards the adoption of that method. This finding suggests that the reason for the increasing rate of adoption of consolidated accounts in later years is not attributable to any specific firm(s) but it was an overall tendency among the accounting firms to accept consolidated accounts more than earlier years.
Thirdly, the possible relationship between the equity method and accounting firms can be observed by consulting proportions of clients adopting the equity method (method 1) compared with clients adopting any other method of group accounting. Table 6 lists the auditing firms where more than 50% of the clients adopted the equity method in the period from 1927 to 1951. As it can be seen, for no accounting firm did the majority of its clients adopt the equity method in 1946/47 or in 1950/51. Another finding from Table 6 is that CB appears three times. 100% of clients in 1927/28 and 1930/31 and 75% in 1942/43 are users of the equity method. This proportion is far higher than any other firms.
Table 3 (continued)
1950/51 method 1 method 2 method 3 method 4 method 5 method 6 Other total all cos
Binder, Hamlyn & Co 5 1/2 5 1/2 5 1/2
Cooper Brothers & Co 2 14 16 15
Deloitee, Plender, Griffiths & Co 1 16 1/2 17 1/2 17 1/2
Franklin, Wild & Co 3 3 5
Moores, Carson & Watson 1 4 5 6
Peat, Marwick, Mitchell &
Co 7 2 26 35 32 1/2
Price Waterhouse & Co 3 1/2 1 32 36 1/2 35 1/2
Sharp, Parsons & Co 1 6 7 6
Thomson McLintock & Co 2 12 14 12
Whinney, Smith & Whinney 7 1 8 8 15 1/2 5 126 1 147 1/2 143 Other firms 18 1/2 11 1 2 245 3 280 1/2 283 34 16 1 2 371 4 428 426 Source: original
Table 4 Accounting firms whose clients reveal above average rates of adoption of group accounting
accounting firm total clients (a) group accounting clients adopting
(b) (b)/(a) average
1927/28
1 Cooper Brothers & Co. 11.5 2.5 21.7% 7.7%
2 Price, Waterhouse & Co. 17.5 2.0 11.4% 7.7%
1930/31
1 Deloitte, Plender, Griffiths & Co. 21.0 6.0 28.6% 20.1%
2 Thomson McLintock & Co. 5.5 1.5 27.3% 20.1%
1942/43
1 Peat, Marwick, Mitchell & Co. 31.0 17.5 56.5% 29.1%
2 Thomson McLintock & Co. 10.5 5.5 52.4% 29.1%
3 Cooper Brothers & Co. 10.0 4.0 40.0% 29.1%
4 Deloitte, Plender, Griffiths & Co. 23.5 7.5 31.9% 29.1% 1947/48
1 Cooper Brothers & Co. 9.0 9.0 100.0% 52.2%
2 Price, Waterhouse & Co. 30.0 26.5 88.3% 52.2%
3 Josolyne, Miles, Page & Co. 6.0 5.0 83.3% 52.2%
4 Thomson McLintock & Co. 12.0 10.0 83.3% 52.2%
5 Sharp, Parsons & Co. 5.0 4.0 80.0% 52.2%
6 Carter & Co. 7.0 5.0 71.4% 52.2%
7 Gane, Jackson, Jefferys & Freeman 5.0 3.0 60.0% 52.2% 8 Peat, Marwick, Mitchell & Co. 32.0 19.0 59.4% 52.2% 1950/51
1 Sharp, Parsons & Co. 6.0 7.0 116.7% 100.5%
2 Thomson McLintock & Co. 12.0 14.0 116.7% 100.5%
3 Peat, Marwick, Mitchell & Co. 32.5 35.0 107.7% 100.5%
4 Cooper Brothers & Co. 15.0 16.0 106.7% 100.5%
5 Price, Waterhouse & Co. 35.5 36.5 102.8% 100.5%
note: companies adopting plural methods are counted plural times, which results in the percentages in excess of 100 in the table (see Table 3 in Chapter 4).
THE RITSUMEIKAN BUSINESS REVIEW Vol. XLVI No.2
3.2 Size analysis
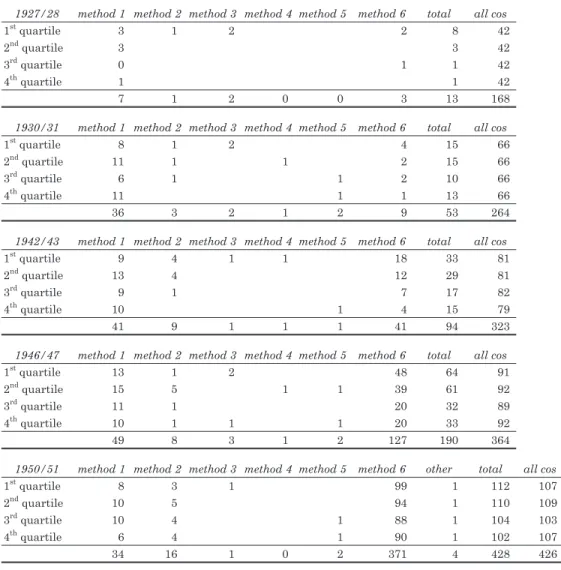
The second analysis is concerned with the relationship between size of the company and the group accounting practices adopted. The companies investigated are divided into four categories, according to their amount of issued capital. Table 7 summarises for each quartile (quartile 1 contains the 25% largest companies) and group accounting method adopted by the constituent companies.
Firstly, the possible relationship between overall group accounting and size can be observed by consulting the two right-hand columns in Table 7. It is possible to conclude
that larger companies were more likely to publish group accounts until this became a regulatory requirement for all companies. For example, in 1927/28, eight (19.0%) out of the 42 largest companies prepared group accounts compared with just one (2.4%) of the 42 smallest companies and 13 (7.7%) of companies in the full sample. In 1946/47, 125 (68.3%) companies in the top two quartiles published group accounts compared with 65 (35.9%) in the lower two quartiles.
Secondly, the possible relationship between consolidated accounts and size of company can be observed by studying the ‘method 6’ column of Table 7 compared to the total column. It is possible to conclude that in the three early years (1927/28, 1930/31 and 1942/43) the largest quartile were most likely, and the smallest quarter of companies were least likely, to publish consolidated accounts, whereas in later years (1947/48 and 1950/51) there was no substantial difference between big and small companies. For example, in 1930/31, four (26.7%) out of the 15 largest companies, two (13.3%) of 15 second largest companies and two (20.0%) of the 10 second smallest companies published consolidated accounts compared with just one (7.7%) of the 13 smallest companies adopting any form of Table 5 Accounting firms whose clients are adopting consolidated accounts with the
probability of more than 50%
accounting firm clients adopting group acc. (a)
clients adopting
method 6 (b) (b)/(a)
1927/28
1 Deloitte, Plender, Griffiths & Co. 0.5 0.5 100.0%
1930/31
1 Price, Waterhouse & Co. 5.0 3.0 60.0%
1942/43
1 Alfred Tongue & Co. 1.0 1.0 100.0%
2 Thomson McLintock & Co. 5.5 3.0 54.5%
1946/47
1 Alfred Tongue & Co. 1.0 1.0 100.0%
2 Kerr, Macleod & Macfarian 1.0 1.0 100.0%
3 Thomson McLintock & Co. 10.0 8.0 80.0%
4 Deloitte, Plender, Griffiths & Co. 12.0 9.0 75.0% 5 Peat, Marwick, Mitchell & Co. 19.0 14.0 73.7%
6 Cooper Brothers & Co. 9.0 6.0 66.7%
7 Price, Waterhouse & Co. 26.5 16.5 62.3%
8 Josolyne, Miles, Page & Co. 5.0 3.0 60.0%
9 Carter & Co. 5.0 3.0 60.0%
1950/51
1 Binder, Hamlyn & Co. 5.5 5.5 100.0%
2 Franklin, Wild & Co. 3.0 3.0 100.0%
3 Deloitte, Plender, Griffiths & Co. 17.5 16.5 94.3%
4 Price, Waterhouse & Co. 36.5 32.0 87.7%
5 Cooper Brothers & Co. 16.0 14.0 87.5%
6 Whinney, Smith & Whinney 8.0 7.0 87.5%
7 Sharp, Parsons & Co. 7.0 6.0 85.7%
8 Thomson McLintock & Co. 14.0 12.0 85.7%
9 Moores, Carson & Watson 5.0 4.0 80.0%
10 Peat, Marwick, Mitchell & Co. 35.0 26.0 74.3% Source: original
Table 6 Accounting firms whose clients are adopting the equity method with the probability of more than 50%
Accounting firm Clients adopting group acc. (a) clients adopting method 1 (b) (b)/(a)
1927/28
1 Cooper Brothers & Co. 2.5 2.5 100.0%
1930/31
1 Cooper Brothers & Co. 2.0 2.0 100.0%
2 Deloitte, Plender, Griffiths & Co. 6.0 4.0 66.7%
3 Alfred Tongue & Co. 1.5 1.0 66.7%
4 Thomson McLintock & Co. 1.5 1.0 66.7%
1942/43
1 Cooper Brothers & Co. 4.0 3.0 75.0%
2 Price, Waterhouse & Co. 6.0 4.0 66.7%
1946/47
None
1950/51
None Source: original
group accounting. A similar contrast can be seen in 1942/43 when 54.5% (=18/33) of the largest companies, 41.4% (=12/29) of the second largest companies and 41.2% (=7/17) of the second smallest companies prepared consolidated accounts whereas only 26.7% (=4/15) of the smallest companies presented their accounts in this manner. On the other hand, in 1946/47, 60.6% (=20/33) of the smallest companies adopted consolidated accounts and the proportion is not significantly different from 75.0% (=48/64) of the largest companies, 63.9% (=39/61) of the second largest companies and 62.5% (=20/32) of the second smallest companies. In 1950/51, 88.4% (=99/112), 85.5% (=94/110), 84.6% (=88/104) and 88.2% (=90/102) of companies in the 1st, 2nd, 3rd and 4th quartile respectively published
consolidated accounts.
Thirdly, the possible relationship between the equity method and size of company can be observed by consulting the contents of the ‘method 1’ column and the total column of Table 7. It seems reasonable to say that the use of the equity method has nothing to do with the company size. For example, in 1930/31, 19 (63.3%) out of the 30 companies in the top two quartiles adopted the equity method, while 17 (73.9%) out of the 23 companies in the lower two quartiles did the same. In 1950/51, 18 (8.1) of companies in the top two and 16 (7.8) of the lower two adopted the equity method.
3.3 Stock exchange- based analysis
The third stage of the analysis presented in this paper considers whether the group accounting innovations can be supplemented in terms of where companies were listed. For the purpose of this analysis, those companies listed on both the Official List and provincial stock exchanges are allocated to the former. Table 8 presents the findings.
Firstly, the possible relationship between group accounting and place of quotation can be observed by consulting the two right-hand columns in Table 8. It can be seen that Table 7 Size Analysis
1927/28 method 1 method 2 method 3 method 4 method 5 method 6 total all cos
1st quartile 3 1 2 2 8 42
2nd quartile 3 3 42
3rd quartile 0 1 1 42
4th quartile 1 1 42
7 1 2 0 0 3 13 168
1930/31 method 1 method 2 method 3 method 4 method 5 method 6 total all cos
1st quartile 8 1 2 4 15 66
2nd quartile 11 1 1 2 15 66
3rd quartile 6 1 1 2 10 66
4th quartile 11 1 1 13 66
36 3 2 1 2 9 53 264
1942/43 method 1 method 2 method 3 method 4 method 5 method 6 total all cos
1st quartile 9 4 1 1 18 33 81
2nd quartile 13 4 12 29 81
3rd quartile 9 1 7 17 82
4th quartile 10 1 4 15 79
41 9 1 1 1 41 94 323
1946/47 method 1 method 2 method 3 method 4 method 5 method 6 total all cos
1st quartile 13 1 2 48 64 91
2nd quartile 15 5 1 1 39 61 92
3rd quartile 11 1 20 32 89
4th quartile 10 1 1 1 20 33 92
49 8 3 1 2 127 190 364
1950/51 method 1 method 2 method 3 method 4 method 5 method 6 other total all cos
1st quartile 8 3 1 99 1 112 107 2nd quartile 10 5 94 1 110 109 3rd quartile 10 4 1 88 1 104 103 4th quartile 6 4 1 90 1 102 107 34 16 1 0 2 371 4 428 426 Source: original
Table 8 Stock Exchange-based Analysis
1927/28 method 1 method 2 method 3 method 4 method 5 method 6 total g.a. total
Official List 7 1 2 3 13 119
Provinces 0 49
Total 7 1 2 0 0 3 13 168
1930/31 method 1 method 2 method 3 method 4 method 5 method 6 total g.a. total
Official List 27 2 2 1 1 7 40 172
Provinces 9 1 1 2 13 92
Total 36 3 2 1 2 9 53 264
1942/43 method 1 method 2 method 3 method 4 method 5 method 6 total g.a. total
Official List 30 8 1 1 32 72 218
Provinces 11 1 1 9 22 105
Total 41 9 1 1 1 41 94 323
1946/47 method 1 method 2 method 3 method 4 method 5 method 6 total g.a. total
Official List 33 7 3 1 1 98 143 237
Provinces 16 1 1 29 47 127
Total 49 8 3 1 2 127 190 364
1950/51 method 1 method 2 method 3 method 4 method 5 method 6 Other total g.a. total
Official List 30 12 1 2 323 4 372 361
Provinces 4 4 48 56 65
Total 34 16 1 0 2 371 4 428 426
THE RITSUMEIKAN BUSINESS REVIEW Vol. XLVI No.2
companies in Official List were more likely to adopt group accounts throughout the period studied. For example, in 1927/28 10.9% (= 13/119) Official List companies published group accounts, whereas no Provincial companies did so. Consistent with this finding, 23.3% (= 40/172) in 1930/31, 33.0% (= 72/218) in 1942/43, 60.3% (= 143/237) in 1946/47 and 103.3% (= 372/361) in 1950/51 are all significantly higher proportions than for Provincial companies (14.1%, 21.0%, 37.0% and 86.2% respectively).
Secondly, the possible relationship between consolidated accounts and place of quotation can be observed by examining the contents of the ‘method 6’ column and the total g.a. column of Table 8. It seems that there is little difference between companies in Official List and in Provinces in terms of the rate of adoption of consolidated accounting practices throughout the period. For example, in 1930/31, 7 (17.5%) out of 40 Official List companies and 2 (15.4%) out of 13 Provincial companies adopted consolidated accounts. Similarly, 44.4% (=32/72), 68.5% (=98/143) and 86.8% (=323/372) of Official companies published consolidated accounts in 1942/43, 1946/47, and 1950/51 respectively and the proportions is not significantly different from those of Provincial companies which were 40.9% (=9/22), 61.7% (=29/47) and 85.7% (=48/56) for the same periods.
The third question (concerning a possible relationship between place of quotation and the adoption of the equity accounting) can be answered by examining the ‘method 1’ column and the total g.a. column of Table 8. It seems reasonable to say that the equity method is slightly more favoured by Provincial companies, but the difference is not significant. For example, in 1930/31, 27 (67.5%) out of 40 Official List companies adopted the equity method while 9 (69.2%) out of 13 Provincial companies did the same. Similarly, 41.7% (=30/72), 23.1% (=33/143) and 8.1% (=30/372) of Official List companies employed the equity method in 1942/43, 1946/47 and 1950/51 respectively and the proportions of Provincial companies adopting the same method in the same fiscal periods are 50.0% (=11/22), 34.0% (= 16/47) and 7.1% (=4/56) respectively.
3.4 Industry analysis
The last stage of the analysis presented in this paper considers whether further light can be shed by examining the group accounting practices of the types of business covered in this study. The companies investigated are divided into two groups according to their type of business, distinguishing between iron, coal and steel companies and commercial and industrial companies. Table 9 presents the findings.
Firstly, the possible relationship between group accounting and types of business can be observed by consulting the two right-hand columns in Table 9. It can be seen that CI companies are more likely to adopt group accounts in 1927/28 and 1930/31, but there seems no big difference between ICS companies and CI companies after 1942/43. For example, in 1927/28, 10 (11.5%) out of 87 CI companies prepared group accounts compared with 3 (3.7%) of the 81 ICS companies. In 1930/31, 42 (25.0%) out of 168 CI companies published group accounts compared with 11 (11.5%) of 96 ICS companies. After 1942/43, the proportion of ICS companies and CI companies adopting group accounts shows little substantial differences, since 33.0% (=33/100), 46.0% (=51/111) and 95.6% (=87/91) of ICS companies presented group accounts in 1942/43, in 1946/47 and 1950/51 respectively, whereas 27.3% (=61/223), 54.9% (=139/253) and 101.8% (=341/335) of CI companies published group accounts in the same fiscal years.
Secondly, the possible relationship between consolidated accounts and types of Table 9 Industry Analysis
1927/28 Method 1 method 2 method 3 method 4 method 5 method 6 total g.a. total
ICS 2 1 3 81
CI 5 1 2 2 10 87
Total 7 1 2 0 0 3 13 168
1930/31 method 1 method 2 method 3 method 4 method 5 method 6 total g.a. total
ICS 6 1 1 3 11 96
CI 30 2 2 1 1 6 42 168
total 36 3 2 1 2 9 53 264
1942/43 method 1 method 2 method 3 method 4 method 5 method 6 total g.a. total
ICS 11 5 17 33 100
CI 30 4 1 1 1 24 61 223
total 41 9 1 1 1 41 94 323
1946/47 method 1 method 2 method 3 method 4 method 5 method 6 total g.a. total
ICS 12 3 36 51 111
CI 37 5 3 1 2 91 139 253
total 49 8 3 1 2 127 190 364
1950/51 method 1 method 2 method 3 method 4 method 5 method 6 other total g.a. total
ICS 8 5 72 2 87 91
CI 26 11 1 2 299 2 341 335
Total 34 16 1 0 2 371 4 428 426
Notes:
*ICS for Iron, Coal & Steel industry; CI for Commercial & Industrial Source: original
business can be observed by studying the ‘method 6’ column and the total g.a column of Table 9. It seems possible to say that the ICS companies are slightly more likely to prepare consolidated accounts than CI companies. For example, in 1930/31, 3 (27.3%) out of 11 ICS companies adopted consolidated accounts, while 6 (14.3%) out of 42 CI companies did the same. Similarly, 51.5% (=17/33) and 70.6% (=36/51) of ICS companies presented consolidated accounts in 1942/43 and 1947/48 compared to 39.3% (=24/61) and 65.5% (=91/139) of CI companies. In 1950/51, the position reverses with 82.8% (=72/87) of ICS companies and 87.7% (=299/341) CI companies publishing consolidated accounts.
Thirdly, the possible relationship between the equity method and types of business can be observed by consulting the contents of the ‘method 1’ column and the total g.a. column of Table 9. It can be seen that CI companies show a significantly higher rate of adoption of the equity method compared with ICS companies up until 1946/47. For example, in 1930/31, 30 (71.4%) out of 42 CI companies employed the equity method compared to 6 (54.5%) of the 11 ICS companies. Similarly, 49.2% (=30/61) and 26.6% (=37/139) of CI companies adopted the equity method in 1942/43 and 1946/47 respectively, whereas 33.3% (=11/33) and 23.5% (=12/51) of ICS companies used the equity method in the same fiscal years. In 1950/51, the position turned around and more ICS companies (9.2%) employed the equity method than CI companies (7.6%).
3.5 Summary
Above, four variables have been examined − company auditor, company size, stock exchange on which the company was quoted, and types of business − to try to understand the group accounting innovation. The result of this exercise is now summarised in Table 10 below. For group accounting innovation as a whole, the analysis undertaken in this paper produces the following conclusions.
・Companies which were audited by any of Cooper Brothers (CB), Thomson McLintock (TM), Price Waterhouse (PW) and Peat Marwick, Mitchell (PMM), and which are listed on the Official List, were more likely to publish group accounts than other companies throughout the period.
・Before CA48 (1927/28, 1930/31, 1942/43, 1946/47) larger companies were more likely to publish group accounts, while after CA48 (1950/51) there was no substantial difference between big and small companies.
・In the two early years (1927/28, 1930/31) CI companies are more likely to publish group accounts, while there was no big difference in 1942/43, 1946/47 and 1950/51. For the introduction of consolidated accounts, the analysis presented in this paper produces the following conclusions.
・In the three earlier years (1927/28, 1930/31, 1942/43) there was no relationship between the apparent willingness to publish consolidated accounts and any specific accounting firm. In addition, the smallest quarter of companies were unlikely to publish consolidated accounts, whereas in the later years (1946/47, 1950/51) companies audited by most of the accounting firms adopted consolidated accounts and Table 10 Summary of the results from four analyses
group accounts
(methods 1-6) consolidated accounts (method 6) the equity method (method 1) auditors Companies audited by any
of CB, TM, PW, PMM were more likely to employ group accounts throughout the period
In the three earlier years (1927/28, 1930/31, 1942/43) there was no relation with any specific accounting f i r m , a n d i n t h e l a t e r years (1946/47, 1950/51) c o m p a n i e s a u d i t e d b y m o s t o f t h e a c c o u n t i n g firms adopted consolidated accounts
In the three earlier years (1927/28, 1930/31, 1942/43) companies audited by CB were more likely to adopt the equity method, whereas in the later years (1946/47, 1950/51) companies audited b y a c c o u n t i n g f i r m s investigated were unlikely to adopt the equity method Size B e f o r e C A 4 8 ( 1 9 2 7 / 2 8 ,
1930/31, 1942/43, 1946/47) l a r g e r c o m p a n i e s w e r e m o r e l i k e l y t o p u b l i s h group accounts, while after CA48 (1950/51) there was no substantial difference b e t w e e n b i g a n d s m a l l companies.
In the three early years (1927/28, 1930/31, 1942/43) the smallest quarter of companies were unlikely to publish consolidated accounts, whereas in later years (1946/47, 1950/51) there was no substantial difference between big and small companies
There was little relationship throughout the period.
Stock
exchange Companies on Official List were more likely to adopt group accounts throughout the period.
There was little relationship
throughout the period. There was little relationship throughout the period.
Types of
business In the two early years (1927/ 28, 1930/31) CI companies are more likely to adopt g r o u p a c c o u n t s , w h i l e there was no big difference in 1942/43, 1946/47 and 1950/51.
The ICS companies are s l i g h t l y m o r e l i k e l y t o p r e p a r e c o n s o l i d a t e d accounts than CI companies until 1946/47.
T h e C I c o m p a n i e s a r e s l i g h t l y m o r e l i k e l y t o employ the equity method than ICS companies until 1946/47.
*CB for Cooper Brothers & Co.; TM for Thomson McLintock & Co.; PW for Price Waterhouse & Co.; PMM for Peat, Marwick, Mitchell & Co.
THE RITSUMEIKAN BUSINESS REVIEW Vol. XLVI No.2 there was no substantial difference between big and small companies.
・There was little relationship between location of the stock exchange on which the company was quoted and adoption of consolidated accounts throughout the period. ・The ICS companies proved slightly more likely to prepare consolidated accounts than
CI companies until 1946/47.
・Overall, companies came to favour consolidated accounts irrespective of their auditors, their size, where they were quoted and their type of business. It was clearly shown that the publication of consolidated accounts (method 6) was the almost universal practice among British holding companies in the two later years (1946/47 and 1950/51).
For the adoption of the equity method, it was discovered that:
・Companies audited by CB were most likely to adopt equity accounting in the early years (1927/28, 1930/31 and 1942/43), whereas in the later years (1946/47 and 1950/51) companies audited by accounting firms investigated were unlikely to adopt the equity method.
・There was no relationship between use of the equity method and either company size or location of the stock exchange.
・The CI companies are slightly more likely to employ the equity method than ICS companies until 1946/47.
・Overall, there was no big difference between holding companies investigated regarding their auditors, their size, where they were quoted and their type of business, except for the case of companies audited by CB in the three earlier years (1927/28, 1930/31 and 1942/43).
4 Interpretations and discussions
4. 1 Plural methods for group accounting
The group accounting practices of companies selected for the purpose of this paper is based on a distinction between six methods of group accounting found in a previous literature (Edwards and Webb, 1984). Whereas Edwards and Webb’s study ended in 1933 and was based mainly on companies who were known to be publishing group accounts, the present study continues through to 1951 enlarging the sample number of companies derived from
the Stock Exchange Year Book. This study has revealed that several methods of group accounting continued to be employed by British holding companies throughout the period from 1927 to 1951 (see Table 2).
However, it was also found that publishing subsidiary companies’ balance sheets (Edwards and Webb, method 2), publishing combined accounts of subsidiary companies (method 3), publishing combined accounts of group without consolidation procedures (method 4) and publishing consolidated accounts without holding company’s individual accounts (method 5) have been the relatively less popular methods throughout the entire study period (Table 2).
Therefore, methods that can be said to be the most common ways of presenting group information during the period investigated are consolidated accounts published in addition to the holding company’s statutory accounts (method 6) and the inclusion of profits and losses of subsidiary companies in the holding company’s statutory (legal entity-based) accounts irrespective of dividends actually declared or paid (method 1). To put it chronologically, the development of group accounting can be interpreted as follows, according to the Table 2. In 1920s and 1930s, the equity method (method 1) was the most used form of group accounting by British holding companies, while after 1942/43, the number of companies adopting consolidated accounts (method 6) exceeded the number of those using the equity method, and consolidation became almost universal method after the Companies Act of 1948, with the equity method significantly less used. The development of group accounting as a whole reflects the dynamics surrounding the employment of these two methods.
4. 2 Consolidated accounts and the impact of regulations
In the accounting year of 1942/43, 12.7% of sampled British holding companies adopted the equity method and the same percentage (12.7%) of companies published consolidated accounts (see Table 2). The overall percentage of companies adopting any form of group accounting was 29.1%, which means most of them employed either the equity method or consolidated accounts. It is also revealed from Table 2 that, before 1942/43, the equity method was the most used, and after 1942/43 consolidated accounts were most popular among the sample companies.
Why did the turnaround take place? The reason seems quite clear. It was the effect of regulations: the ICAEW’s Recommendation on Accounting Principle No. 7 issued in
1944 and the Companies Act of 1948. In 1946/47, which was an accounting period that occurred after the business community was made aware of the profession’s judgment about what constituted best practice through the publication of RoAP7, companies adopting consolidation increased to 34.9%. After CA48 took effect, the proportion reached 87.1% in 1950/51 (Table 2). On the contrary, the equity method became used by 13.5% companies in 1946/47 and 8.0% in 1950/51. This implies the impact of regulations on the adoption of consolidated accounts by British holding company directors.
However, it must be added here that the number and proportion of companies publishing consolidated accounts did increase even before the regulations took effect. In 1927/28, there were only 1.8% of sampled holding companies publishing consolidated accounts, but the proportion rose to 3.4% in 1930/31 and 12.7% in 1942/43 (Table 2). The rise from 1930/31 to 1942/43 seems worthy of attention, because the revelations in the Royal Mail case (1931) and the publication of Dunlop Rubber’s ‘trail blazing’ consolidated accounts (1933) occurred between these years. The growth in use of consolidated accounts provides further empirical support for the notion of these events to having been influential, as previous literatures have suggested (de Paula, 1948; Edwards and Webb, 1984; Bircher, 1991). The contribution of this paper to the discussion seen in previous literatures is the finding that the company directors introduced consolidated accounts during this period almost irrespective of their auditors, their sizes, where they were quoted and their types of business.
Yet, it is clearly the case that these two events did not result in consolidated accounts becoming widely adopted by British holding companies, since only 12.7% of the sampled companies prepared consolidated accounts as late as 1942/43.
4. 3 The Equity Method Supported by Accountants
Table 2 shows that the equity method was the most used group accounting practice in 1920s and 1930s. Edwards and Webb (1984) revealed that various methods of group accounting were used by British holding companies and that the equity method was fairly popular, especially in early years. It is the case that the rate of adoption was then higher than in the 1920s when, for much of the time, it was the method of group accounting most commonly used in Britain (Edwards and Webb, 1984: 56).
Why was the equity method the most used in 1920s and 1930s? It was revealed that in the three earlier years (1927/28, 1930/31 and 1942/43) companies audited by Cooper Brothers & Co. (CB) were more likely to adopt the equity method. None of the other
variables (company size, stock exchange and type of business) appear to possess any explanatory potential for the use of the equity method.
The above finding concerning a relationship between company auditor and use of the equity method is consistent with the fact that D’Arcy Cooper, former senior partner in CB9), strongly supported adoption of the equity method10). The following public statements demonstrate D’Arcy Cooper’s criticism of the publication of consolidated accounts and his support for the use of the equity method:
I see no useful purpose in producing an amalgamated balance sheet which would be neither fish, flesh, fowl, nor good red herring. On the contrary, in my opinion it could only do harm. (D’Arcy Cooper, 1925a: 18)
I strongly support the present practice of holding Companies which is to take to the credit of Profit and Loss Account either the dividends declared or the profits earned by subsidiary Companies, whilst at the same time providing out of the holding Company’ s profits for all losses made by subsidiary Companies, and any legislation which may be necessary to enforce such a practice would, in my opinion, be sound and wise. (D’ Arcy Cooper, 1925b: lx)
From D’Arcy Cooper’s remarks above and the finding in this study, it seems reasonable to assume that the accounting firm strongly supported the use of the equity method.
5 Conclusions
The paper examined financial reporting innovation regarding group accounting information achieved by company directors in the U.K. between 1927 and 1951. It was shown that the engagement of particular auditors (Cooper Brothers (CB), Thomson McLintock (TM), Price Waterhouse (PW) and Peat Marwick, Mitchell (PMM)), company size (the big companies) and where they were quoted (the Official List) seem to have relation to the adoption of group accounting.
It was also revealed that the form of group accounts had little to do with the four variants examined. The adoption of consolidated accounts by British holding companies
9) For biographies of D’Arcy Cooper, see Edwards (1984a) and Wilson (1959).
10) Lever Brothers, of which D’Arcy Cooper was the chairman since 1925, was known as a famous user of the equity method. Simons reprinted the company’s Balance Sheet in his book in 1927 (Simons, 1927: 164). Camfferman and Zeff report ‘the long-held belief within Unilever that consolidated balance sheets would be misleading’ (Camfferman and Zeff, 2003: 186). Responses from the press to the accounts of Lever Brothers and Unilever are well documented in Camfferman and Zeff (2003).
THE RITSUMEIKAN BUSINESS REVIEW Vol. XLVI No.2
were found to have had little relationship with who audited them, their size, where they were quoted and types of their business. Moreover, it was seen that auditors, company size, location listed and types of business appear not to have influenced use of the equity method, except for early years (1927/28, 1930/31 and 1942/43) when majority of CB- audited companies adopted the equity method.
Therefore it seems possible to conclude that large companies, at the same time listed in London and audited either by CB, TM, PM or PMM, were likely to innovate their group accounting practices, but that the exact forms of group accounting varied among these companies and were nothing to do with those variants. In short, auditors, company size and location listed seem to have relationship with directors’ financial reporting innovation, but they do not explain how and what form they innovate. It can also be a conclusion that, in accounting years of 1927/28, 1930/31 and 1942/43, companies audited by CB were likely to adopt the equity method.
The limitation of this paper is that it does not provide any explanation on why those companies which were big, on the Official List and audited either by CB, TM, PM or PMM are likely to adopt group accounting practices, and why group accounting practices varied among the companies. The findings are therefore necessarily preliminary, and more research is required to extend enquiry to cover issues other than those examined here. Especially the research on directors’ way of producing estimation and opinions towards capital market, possibly in each case of a company, seems necessary for further understanding of financial reporting innovation.
References
Arnold, A.J. and Matthews, D.R. (2002) Corporate Financial Disclosures in the UK, 1920-50: the Effects of Legislative Change and Managerial Discretion, Accounting and Business Research, 32(1), pp.3-16.
Ashworth, R. (1925) Limited Liability Companies: A Guide to Promoters, Directors, Investors,
Secretaries and Accountants, London: Sir Isaac Pitman & Sons, Ltd.
Berle, A.A. and G.C. Means (1932), The Modern Corporation and Private Property, Harcourt, Brace & World, reprinted by Transaction Publishers in 1991.
Bircher, P. (1988) The Adoption of Consolidated Accounting in Great Britain, Accounting and
Business Research, 19(73), pp.3-13.
Bircher, P. (1991) From the Companies Act of 1929 to the Companies Act of 1948: A Study of Change
in the Law and Practice of Accounting, New York/ London: Garland Publishing.
Brooks, C. (1933) The Royal Mail Case: Rex v. Lord Kylsant, and Another, Toronto: Canada Law Book Company, Limited, reprinted by Arno Press Inc. in 1980.
Camfferman, K. and S.A. Zeff (2003) The Apotheosis of Holding Company Accounting: Unilever's Financial Reporting innovations from the 1920s to the 1940s, Accounting, Business & Financial
History, 13(2), pp.171-206.
Cash, W. (1929) Consolidated Balance Sheets, International Congress on Accounting, September
9-14, 1929, New York City, pp.639-685, reprinted in The Accountant, 7 December 1929,
pp.725-730.
D'Arcy Cooper, F. (1925a) Consolidated Balance Sheets, The Times, 3 June 1925, p.18.
D’Arcy Cooper, F. (1925b) ‘Memorandum by Mr. F. D’Arcy Cooper’ in: Minutes of Evidence Taken
Before the Departmental Committee Appointed by the Board of Trade to Consider and Report What Amendments are Desirable in the Companies Acts, 1908 to 1917, Appendix W, reprinted in
Edwards, 1980: pp.112-113.
D’Arcy Cooper, F. (1925c) ‘Minutes of Evidence’ in: Minutes of Evidence Taken Before the
Departmental Committee Appointed by the Board of Trade to Consider and Report What Amendments are Desirable in the Companies Acts, 1908 to 1917, pp.184-191, reprinted in
Edwards, 1980: pp.104-111.
de Paula, F.R.M. (1934) The Form of Presentation of the Accounts of Holding Companies, The
Accountant, 15 December 1934, pp.853-860.
de Paula, F.R.M. (1948) Developments in Accounting, London: Sir Isaac Pitman & Sons, Ltd. Dickinson, A.L. (1914) Accounting: Practice and Procedure, New York, The Ronal Press Company. Dicksee, L.R. (1924) Auditing: A Practical Manual for Auditors, 13th ed., London: Gee & Co. Edwards, J.R. (1984) Cooper, Sir Francis D’Arcy, in: D.J. Jeremy ed., Dictionary of Business
Biography: A Biographical Dictionary of Business Leaders Active in Britain in the Period 1860-1980, Vol. 1, London: Butterworths, pp.781-785.
Edwards, J.R. (1991) The Process of Accounting Innovation: The Publication of Consolidated Accounts in Britain in 1910, Accounting Historians Journal, 18(2), pp.113-132.
Edwards, J.R. and K.M. Webb (1984) The Development of Group Accounting in the United Kingdom to 1933, The Accounting Historians Journal, 11(1), pp.31-61.
Kitchen, J. (1972) The Accounts of British Holding Company Groups: Development and Attitudes to Disclosure in the Early Years, Accounting and Business Research, 6, pp.114-136.
Kitchen, J. (1974) Lawrence Dicksee, Depreciation, and the Double-Account System, in: H. Edey and B.S. Yamey eds., Debits, Credits, Finance and Profits, Sweet & Maxwell, pp.109-130. Matthews, D., M. Anderson and J.R. Edwards (1998) The Priesthood of Industry : The Rise of the
Professional Accountant in British Management, Oxford University Press.
May, G.O. (1943) Financial Accounting: A Distillation of Experience, New York : Macmillan Co. Nobes, C. (2002) An Analysis of the International Development of the Equity Method, ABACUS,
38(1), pp.16-46.
Parker, R.H. (1977) Explaining National Differences in Consolidated Accounts, Accounting and
Business Research, 27, pp.203-207.
Robson, T.B. (1956) Consolidated and Other Group Accounts: Principles and Procedure, 3rd ed., Gee & Company Ltd.
Stamp, J. (1925) Audit of "Holding Companies", The Accountant, 21 February 1925, p.312.
Takatera, S. (1971) Kogaisya Shihai Kabushiki no Kaikei to Rieki Sosa (Accounting for Controlling Stock Investment in Subsidiary), Keizai Ronso (The Economic Review of Kyoto University
Economic Society), 107(4/5/6), pp.18-30.
Walker, R.G. (1978) Consolidated Statements: A History and Analysis, Arno Press Inc.
Walker, R.G. and J. Mack (1998) The Influence of Regulation on the Publication of Consolidated Statements, ABACUS, 34(1), pp.48-74.